Lansing, Michigan Neighborhood Map - Income, House Prices, Occupations, Boundaries
Settings
X

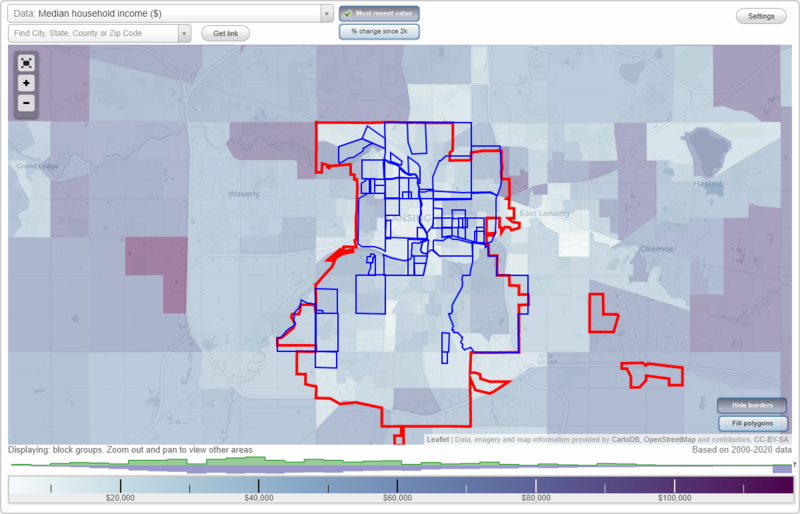
- City boundary
- Neighborhood boundaries
Business Search - 14 Million verified businesses
Neighborhoods:
Basset Park, Battenfield, Bingham, Cherry Hill, Churchill Downs, Colonial Village, Creston, Downtown, Durant Park, East Battenfield, Eastern, Eastfield, Eastside, Fabulous Acres, Fairview, Forest View, Genesee, Green Oaks, Groesbeck, Hull Court Park, Hunter Park, Hunter Park East, Hunter Park West, Knollwood-Willow, Lady Hill, Lansing Eaton, Moores Park, North Lansing, Northtown, Northwest, Old Forest, Old Oakland, PLACE, Potter-Walsh, Quentin Park, REO Town, Renaissance, Riverforest, Riverpoint, Sagamore Hills, Scottsdale, Shady Oak, Shepard Street, Square One, Stadium District, Turner Dodge, Walnut, Westside, Wexford Heights, Wood MereBasset Park neighborhood in Lansing statistics: (Find on map)
Area: 0.300 square miles
Population: 692
Population density:
Median household income in 2021:
Median rent in in 2021:
Male vs Females
Median age
Average estimated value of detached houses in 2021 (82.6% of all units):
Most popular occupations of males: service occupations (31.4%); business and financial operations occupations (27.0%); management occupations (except farmers) (15.1%); sales and office occupations (14.1%); healthcare practitioners and technical occupations (6.5%); production occupations (3.8%); material moving occupations (2.2%)
Most popular occupations of females: education, training, and library occupations (59.9%); sales and office occupations (15.8%); service occupations (9.7%); business and financial operations occupations (9.2%); legal occupations (2.5%); healthcare practitioners and technical occupations (1.7%); management occupations (except farmers) (1.2%)
Roads and streets: Robertson Ave; N Martin Luther King Jr Blvd (N Logan St); Bassett Ave; Glenrose Ave; Redwood St; Muskegon Ave; Roselawn Ave; Comfort St; Lamont St; Greenwood St; Ontario St; Owen St; N Jenison Ave; Sunset Ave; Keeney Ct.
Railroad features: Conrail RR.
Basset Park neighborhood detailed profile
Area: 0.300 square miles
Population: 692
Population density:
| Basset Park: | 2,306 people per square mile |
| Lansing: | 3,191 people per square mile |
Median household income in 2021:
| Basset Park: | $2,183,941 |
| Lansing: | $48,818 |
Median rent in in 2021:
| Basset Park: | $17,646 |
| Lansing: | $719 |
Male vs Females
| Males: | 303 |
| Females: | 388 |
Median age
| Males: | 818.1 years |
| Females: | 890.7 years |
Average estimated value of detached houses in 2021 (82.6% of all units):
| Basset Park: | $168,669 |
| Lansing: | $98,556 |
Most popular occupations of males: service occupations (31.4%); business and financial operations occupations (27.0%); management occupations (except farmers) (15.1%); sales and office occupations (14.1%); healthcare practitioners and technical occupations (6.5%); production occupations (3.8%); material moving occupations (2.2%)
Most popular occupations of females: education, training, and library occupations (59.9%); sales and office occupations (15.8%); service occupations (9.7%); business and financial operations occupations (9.2%); legal occupations (2.5%); healthcare practitioners and technical occupations (1.7%); management occupations (except farmers) (1.2%)
Roads and streets: Robertson Ave; N Martin Luther King Jr Blvd (N Logan St); Bassett Ave; Glenrose Ave; Redwood St; Muskegon Ave; Roselawn Ave; Comfort St; Lamont St; Greenwood St; Ontario St; Owen St; N Jenison Ave; Sunset Ave; Keeney Ct.
Railroad features: Conrail RR.
Basset Park neighborhood detailed profile
Battenfield neighborhood in Lansing statistics: (Find on map)
Area: 0.093 square miles
Population: 302
Population density:
Median household income in 2021:
Median rent in in 2021:
Male vs Females
Median age
Housing prices:
Average estimated value of detached houses in 2021 (82.8% of all units):
Average estimated value of townhouses or other attached units in 2021 (4.5% of all units):
Most popular occupations of males: production occupations (26.6%); farming, fishing, and forestry occupations (24.4%); service occupations (16.2%); management occupations (except farmers) (9.2%); education, training, and library occupations (8.1%); sales and office occupations (7.2%); material moving occupations (6.0%)
Most popular occupations of females: sales and office occupations (30.0%); business and financial operations occupations (19.4%); healthcare practitioners and technical occupations (17.0%); service occupations (10.6%); computer and mathematical occupations (7.0%); arts, design, entertainment, sports, and media occupations (5.9%); management occupations (except farmers) (5.3%)
Roads and streets: Devonshire Ave; Alpha St; E Jolly Rd; Tranter St; Kendon Dr; Samantha St.
Battenfield neighborhood detailed profile
Area: 0.093 square miles
Population: 302
Population density:
| Battenfield: | 3,264 people per square mile |
| Lansing: | 3,191 people per square mile |
Median household income in 2021:
| Battenfield: | $64,255 |
| Lansing: | $48,818 |
Median rent in in 2021:
| Battenfield: | $734 |
| Lansing: | $719 |
Male vs Females
| Males: | 169 |
| Females: | 132 |
Median age
| Males: | 37.6 years |
| Females: | 35.6 years |
Housing prices:
Average estimated value of detached houses in 2021 (82.8% of all units):
| Battenfield: | $67,682 |
| Lansing: | $98,556 |
Average estimated value of townhouses or other attached units in 2021 (4.5% of all units):
| This neighborhood: | $54,235 |
| city: | $168,956 |
Most popular occupations of males: production occupations (26.6%); farming, fishing, and forestry occupations (24.4%); service occupations (16.2%); management occupations (except farmers) (9.2%); education, training, and library occupations (8.1%); sales and office occupations (7.2%); material moving occupations (6.0%)
Most popular occupations of females: sales and office occupations (30.0%); business and financial operations occupations (19.4%); healthcare practitioners and technical occupations (17.0%); service occupations (10.6%); computer and mathematical occupations (7.0%); arts, design, entertainment, sports, and media occupations (5.9%); management occupations (except farmers) (5.3%)
Roads and streets: Devonshire Ave; Alpha St; E Jolly Rd; Tranter St; Kendon Dr; Samantha St.
Battenfield neighborhood detailed profile
Bingham neighborhood in Lansing statistics: (Find on map)
Area: 0.068 square miles
Population: 398
Population density:
Median household income in 2021:
Median rent in in 2021:
Male vs Females
Median age
Average estimated value of detached houses in 2021 (48.8% of all units):
Most popular occupations of males: sales and office occupations (23.3%); farming, fishing, and forestry occupations (18.6%); service occupations (13.5%); management occupations (except farmers) (12.7%); production occupations (11.3%); community and social services occupations (8.0%); education, training, and library occupations (7.0%)
Most popular occupations of females: management occupations (except farmers) (22.9%); service occupations (22.1%); business and financial operations occupations (15.5%); sales and office occupations (13.5%); material moving occupations (12.8%); healthcare practitioners and technical occupations (11.6%); production occupations (7.1%)
Roads and streets: E Michigan Ave; Prospect St; Eureka St; Bingham St; Jones St; S Pennsylvania Ave; S Holmes St; E Kalamazoo St.
Bingham neighborhood detailed profile
Area: 0.068 square miles
Population: 398
Population density:
| Bingham: | 5,829 people per square mile |
| Lansing: | 3,191 people per square mile |
Median household income in 2021:
| Bingham: | $41,598 |
| Lansing: | $48,818 |
Median rent in in 2021:
| Bingham: | $650 |
| Lansing: | $719 |
Male vs Females
| Males: | 227 |
| Females: | 171 |
Median age
| Males: | 37.6 years |
| Females: | 28.5 years |
Average estimated value of detached houses in 2021 (48.8% of all units):
| Bingham: | $70,763 |
| Lansing: | $98,556 |
Most popular occupations of males: sales and office occupations (23.3%); farming, fishing, and forestry occupations (18.6%); service occupations (13.5%); management occupations (except farmers) (12.7%); production occupations (11.3%); community and social services occupations (8.0%); education, training, and library occupations (7.0%)
Most popular occupations of females: management occupations (except farmers) (22.9%); service occupations (22.1%); business and financial operations occupations (15.5%); sales and office occupations (13.5%); material moving occupations (12.8%); healthcare practitioners and technical occupations (11.6%); production occupations (7.1%)
Roads and streets: E Michigan Ave; Prospect St; Eureka St; Bingham St; Jones St; S Pennsylvania Ave; S Holmes St; E Kalamazoo St.
Bingham neighborhood detailed profile
Cherry Hill neighborhood in Lansing statistics: (Find on map)
Area: 0.065 square miles
Roads and streets: River St; E St Joseph St; E Hillsdale St; Cherry St; E Lenawee St; Kalamazoo Plz.
Cherry Hill neighborhood detailed profile
Area: 0.065 square miles
Roads and streets: River St; E St Joseph St; E Hillsdale St; Cherry St; E Lenawee St; Kalamazoo Plz.
Cherry Hill neighborhood detailed profile
Churchill Downs neighborhood in Lansing statistics: (Find on map)
Area: 0.586 square miles
Population: 3,536
Population density:
Median household income in 2021:
Median rent in in 2021:
Male vs Females
Median age
Housing prices:
Average estimated value of detached houses in 2021 (91.7% of all units):
Average estimated value of townhouses or other attached units in 2021 (11.7% of all units):
Most popular occupations of males: service occupations (22.1%); material moving occupations (18.6%); sales and office occupations (18.4%); transportation occupations (11.1%); production occupations (7.7%); healthcare practitioners and technical occupations (4.7%); construction, extraction, and maintenance occupations (4.5%)
Most popular occupations of females: sales and office occupations (37.7%); service occupations (22.4%); healthcare practitioners and technical occupations (6.3%); material moving occupations (6.1%); business and financial operations occupations (4.9%); management occupations (except farmers) (4.8%); production occupations (4.4%)
Roads and streets: S Waverly Rd.
Roads and streets: Wainwright Ave; Stillwell Ave; Ronald St; Jerree St; W Jolly Rd; Glenbrook Dr; Brighton Dr; Karen St; Lucie St; S Deerfield Ave; Anson St; Wedgewood Dr; Maybel St; Churchill Ave; Kendalwood Dr; Hillborn Ln; Sumpter St; Stratford Ave; Berwick Dr; Lochmoor Dr; Hepfer St; Alpine Dr; Clayborn Rd; Risdale St (Risdale Ave); Raynell St; Reo Rd; Tennyson Ln; S Waverly Rd; Conners Ave; Grantsburg Dr; Sussex St; Fielding Dr; Hillcrest St; Barclay Pl; Sylvester Ave; Atlanta Pl.
Churchill Downs neighborhood detailed profile
Area: 0.586 square miles
Population: 3,536
Population density:
| Churchill Downs: | 6,038 people per square mile |
| Lansing: | 3,191 people per square mile |
Median household income in 2021:
| Churchill Downs: | $47,385 |
| Lansing: | $48,818 |
Median rent in in 2021:
| Churchill Downs: | $699 |
| Lansing: | $719 |
Male vs Females
| Males: | 1,537 |
| Females: | 1,999 |
Median age
| Males: | 30.4 years |
| Females: | 32.9 years |
Housing prices:
Average estimated value of detached houses in 2021 (91.7% of all units):
| Churchill Downs: | $105,078 |
| Lansing: | $98,556 |
Average estimated value of townhouses or other attached units in 2021 (11.7% of all units):
| This neighborhood: | $54,533 |
| city: | $168,956 |
Most popular occupations of males: service occupations (22.1%); material moving occupations (18.6%); sales and office occupations (18.4%); transportation occupations (11.1%); production occupations (7.7%); healthcare practitioners and technical occupations (4.7%); construction, extraction, and maintenance occupations (4.5%)
Most popular occupations of females: sales and office occupations (37.7%); service occupations (22.4%); healthcare practitioners and technical occupations (6.3%); material moving occupations (6.1%); business and financial operations occupations (4.9%); management occupations (except farmers) (4.8%); production occupations (4.4%)
Roads and streets: S Waverly Rd.
Roads and streets: Wainwright Ave; Stillwell Ave; Ronald St; Jerree St; W Jolly Rd; Glenbrook Dr; Brighton Dr; Karen St; Lucie St; S Deerfield Ave; Anson St; Wedgewood Dr; Maybel St; Churchill Ave; Kendalwood Dr; Hillborn Ln; Sumpter St; Stratford Ave; Berwick Dr; Lochmoor Dr; Hepfer St; Alpine Dr; Clayborn Rd; Risdale St (Risdale Ave); Raynell St; Reo Rd; Tennyson Ln; S Waverly Rd; Conners Ave; Grantsburg Dr; Sussex St; Fielding Dr; Hillcrest St; Barclay Pl; Sylvester Ave; Atlanta Pl.
Churchill Downs neighborhood detailed profile
Colonial Village neighborhood in Lansing statistics: (Find on map)
Area: 0.766 square miles
Population: 1,845
Population density:
Median household income in 2021:
Median rent in in 2021:
Male vs Females
Median age
Average estimated value of detached houses in 2021 (92.4% of all units):
Most popular occupations of males: material moving occupations (24.0%); farming, fishing, and forestry occupations (23.1%); sales and office occupations (12.4%); management occupations (except farmers) (8.6%); healthcare practitioners and technical occupations (8.1%); computer and mathematical occupations (7.3%); production occupations (6.4%)
Most popular occupations of females: sales and office occupations (41.8%); service occupations (17.3%); material moving occupations (10.5%); business and financial operations occupations (9.9%); arts, design, entertainment, sports, and media occupations (9.8%); computer and mathematical occupations (9.2%); life, physical, and social science occupations (2.7%)
Highways in this neighborhood: S Logan St (State Hwy 99, S Martin Luther King Jr Blvd); Logan St S (State Hwy 99, S Martin Luther King Jr Blvd).
Roads and streets: Victor Ave; Gordon Ave; Loraine Ave; W Holmes Rd; Cooper Ave; W Rundle Ave; Boston Blvd; Lenore Ave; Holly Way; Peggy Pl (Peggy St); Pattengill Ave; Marion Ave; Rock Way; Kelsey Ave; W Mount Hope Ave; S Holly Way; Fairfax Rd; Poxson Ave; Woodbine Ave; Chatham Rd; Quincy Ln; Wellington Rd; Concord Rd; Quentin Ave; Express Ct; Revere Pl; Berkshire Dr; Kellybrook Ln; Hemlock Cir; Holly Ct; S Rundle Ave.
Railroad features: Conrail RR.
Colonial Village neighborhood detailed profile
Area: 0.766 square miles
Population: 1,845
Population density:
| Colonial Village: | 2,408 people per square mile |
| Lansing: | 3,191 people per square mile |
Median household income in 2021:
| Colonial Village: | $35,476 |
| Lansing: | $48,818 |
Median rent in in 2021:
| Colonial Village: | $1,056 |
| Lansing: | $719 |
Male vs Females
| Males: | 1,019 |
| Females: | 826 |
Median age
| Males: | 32.2 years |
| Females: | 43.5 years |
Average estimated value of detached houses in 2021 (92.4% of all units):
| Colonial Village: | $114,602 |
| Lansing: | $98,556 |
Most popular occupations of males: material moving occupations (24.0%); farming, fishing, and forestry occupations (23.1%); sales and office occupations (12.4%); management occupations (except farmers) (8.6%); healthcare practitioners and technical occupations (8.1%); computer and mathematical occupations (7.3%); production occupations (6.4%)
Most popular occupations of females: sales and office occupations (41.8%); service occupations (17.3%); material moving occupations (10.5%); business and financial operations occupations (9.9%); arts, design, entertainment, sports, and media occupations (9.8%); computer and mathematical occupations (9.2%); life, physical, and social science occupations (2.7%)
Highways in this neighborhood: S Logan St (State Hwy 99, S Martin Luther King Jr Blvd); Logan St S (State Hwy 99, S Martin Luther King Jr Blvd).
Roads and streets: Victor Ave; Gordon Ave; Loraine Ave; W Holmes Rd; Cooper Ave; W Rundle Ave; Boston Blvd; Lenore Ave; Holly Way; Peggy Pl (Peggy St); Pattengill Ave; Marion Ave; Rock Way; Kelsey Ave; W Mount Hope Ave; S Holly Way; Fairfax Rd; Poxson Ave; Woodbine Ave; Chatham Rd; Quincy Ln; Wellington Rd; Concord Rd; Quentin Ave; Express Ct; Revere Pl; Berkshire Dr; Kellybrook Ln; Hemlock Cir; Holly Ct; S Rundle Ave.
Railroad features: Conrail RR.
Colonial Village neighborhood detailed profile
Creston neighborhood in Lansing statistics: (Find on map)
Area: 0.374 square miles
Population: 791
Population density:
Median household income in 2021:
Median rent in in 2021:
Male vs Females
Median age
Housing prices:
Average estimated value of detached houses in 2021 (90.9% of all units):
Average estimated value of mobile home in 2021 (1.5% of all units):
Most popular occupations of males: production occupations (16.8%); service occupations (13.0%); sales and office occupations (8.9%); construction, extraction, and maintenance occupations (7.2%); material moving occupations (5.6%); transportation occupations (5.3%); business and financial operations occupations (3.8%)
Most popular occupations of females: service occupations (29.8%); sales and office occupations (21.8%); production occupations (12.3%); healthcare practitioners and technical occupations (7.8%); education, training, and library occupations (5.9%); management occupations (except farmers) (4.6%); material moving occupations (3.6%)
Roads and streets: E Sheridan Rd (W Sheridan Rd).
Roads and streets: Creston Ave; E Sheridan Rd (W Sheridan Rd); E Gier St; E Howe Ave; N Cedar St; E Frederick Ave; E Harris St; Schultz St; Walker St; E Randolph St; Community St; Gary Ave; E Jackson St; W Randolph St; Turner St; E Paulson St; E Fairfield Ave; Lynwood Cir; Hi Mount Cir; Polly Ave; Chilson Ave.
Creston neighborhood detailed profile
Area: 0.374 square miles
Population: 791
Population density:
| Creston: | 2,114 people per square mile |
| Lansing: | 3,191 people per square mile |
Median household income in 2021:
| Creston: | $40,735 |
| Lansing: | $48,818 |
Median rent in in 2021:
| Creston: | $679 |
| Lansing: | $719 |
Male vs Females
| Males: | 445 |
| Females: | 345 |
Median age
| Males: | 34.3 years |
| Females: | 38.0 years |
Housing prices:
Average estimated value of detached houses in 2021 (90.9% of all units):
| Creston: | $81,172 |
| Lansing: | $98,556 |
Average estimated value of mobile home in 2021 (1.5% of all units):
| Creston: | $12,455 |
| Lansing: | $104,592 |
Most popular occupations of males: production occupations (16.8%); service occupations (13.0%); sales and office occupations (8.9%); construction, extraction, and maintenance occupations (7.2%); material moving occupations (5.6%); transportation occupations (5.3%); business and financial operations occupations (3.8%)
Most popular occupations of females: service occupations (29.8%); sales and office occupations (21.8%); production occupations (12.3%); healthcare practitioners and technical occupations (7.8%); education, training, and library occupations (5.9%); management occupations (except farmers) (4.6%); material moving occupations (3.6%)
Roads and streets: E Sheridan Rd (W Sheridan Rd).
Roads and streets: Creston Ave; E Sheridan Rd (W Sheridan Rd); E Gier St; E Howe Ave; N Cedar St; E Frederick Ave; E Harris St; Schultz St; Walker St; E Randolph St; Community St; Gary Ave; E Jackson St; W Randolph St; Turner St; E Paulson St; E Fairfield Ave; Lynwood Cir; Hi Mount Cir; Polly Ave; Chilson Ave.
Creston neighborhood detailed profile
Downtown neighborhood in Lansing statistics: (Find on map)
Area: 1.666 square miles
Population: 11,334
Population density:
Median household income in 2021:
Median rent in in 2021:
Male vs Females
Median age
Average estimated value of detached houses in 2021 (34.4% of all units):
Most popular occupations of males: computer and mathematical occupations (18.0%); service occupations (11.8%); material moving occupations (10.4%); sales and office occupations (8.5%); education, training, and library occupations (7.3%); arts, design, entertainment, sports, and media occupations (7.3%); construction, extraction, and maintenance occupations (6.8%)
Most popular occupations of females: sales and office occupations (23.7%); service occupations (21.8%); education, training, and library occupations (11.3%); management occupations (except farmers) (8.7%); production occupations (6.5%); computer and mathematical occupations (5.2%); community and social services occupations (5.1%)
Limited-access highways (interstate or state) in this neighborhood: US Hwy 27 Bus (I- 496).
Highways in this neighborhood: W Oakland Rd (I- 69 Bus, State Hwy 43).
Roads and streets: N Walnut St; W Washtenaw St; W Willow St; N Pine St; N Capitol Ave; W Ionia St; N Chestnut St; W Kalamazoo St; W Ottawa St; W Allegan St; W Lenawee St; W Lapeer St; W St Joseph St; Seymour Ave; W Shiawassee St; W Genesee St; N Sycamore St; W Maple St; N Grand Ave; W Madison St; W Hillsdale St; N Martin Luther King Jr Blvd (N Logan St); N Washington Ave; W Kilborn St; W Grand River Ave; S Grand Ave; S Walnut St; S Capitol Ave; Lansing Ave; Princeton Ave; N Butler Blvd; S Pine St; S Butler Blvd; S Sycamore St; Townsend St; E Hillsdale St; S Martin Luther King Jr Blvd (Logan St); Roosevelt Ave; Cross St; E St Joseph St; Knollwood Ave; E Lenawee St; Washington Sq S; Englewood Ct; Roseneath Ave; E Kalamazoo St; River St; Cypress St; Chicago Ave; Wisconsin Ave; Cherry St; Washington Sq N; S Chestnut St; Daleford Ave; Christopher St; Schoolcraft Dr; E Shiawassee St; Edgewood Ct; Summerville Ave; S Washington Ave; Brook St; N Grand River Ave; E Ottawa St; E Washtenaw St; E Michigan Ave; Daleford St; Bluff St; Muskegon Ave; E Ionia St; W Michigan Ave; E Allegan St; State St; Emerson St; Leonard Ct; E Madison St; Bancroft Ct; Leitram Ct; E Kilborn St; Glenn St; E Grand River Ave; Pleasant St; Edmore St; Ontario St; Inner Ct; Queen St; Greenwood St; Lawler Ct; E Maple St; Lemrock Ct; Savoy Ct; E Willow St; Kalamazoo Plz; Grand Ct; S Martin Luther King Jr Blvd (S Logan St).
Railroad features: Conrail RR.
Downtown neighborhood detailed profile
Area: 1.666 square miles
Population: 11,334
Population density:
| Downtown: | 6,804 people per square mile |
| Lansing: | 3,191 people per square mile |
Median household income in 2021:
| Downtown: | $43,872 |
| Lansing: | $48,818 |
Median rent in in 2021:
| Downtown: | $709 |
| Lansing: | $719 |
Male vs Females
| Males: | 5,282 |
| Females: | 6,051 |
Median age
| Males: | 31.8 years |
| Females: | 35.6 years |
Average estimated value of detached houses in 2021 (34.4% of all units):
| Downtown: | $86,848 |
| Lansing: | $98,556 |
Most popular occupations of males: computer and mathematical occupations (18.0%); service occupations (11.8%); material moving occupations (10.4%); sales and office occupations (8.5%); education, training, and library occupations (7.3%); arts, design, entertainment, sports, and media occupations (7.3%); construction, extraction, and maintenance occupations (6.8%)
Most popular occupations of females: sales and office occupations (23.7%); service occupations (21.8%); education, training, and library occupations (11.3%); management occupations (except farmers) (8.7%); production occupations (6.5%); computer and mathematical occupations (5.2%); community and social services occupations (5.1%)
Limited-access highways (interstate or state) in this neighborhood: US Hwy 27 Bus (I- 496).
Highways in this neighborhood: W Oakland Rd (I- 69 Bus, State Hwy 43).
Roads and streets: N Walnut St; W Washtenaw St; W Willow St; N Pine St; N Capitol Ave; W Ionia St; N Chestnut St; W Kalamazoo St; W Ottawa St; W Allegan St; W Lenawee St; W Lapeer St; W St Joseph St; Seymour Ave; W Shiawassee St; W Genesee St; N Sycamore St; W Maple St; N Grand Ave; W Madison St; W Hillsdale St; N Martin Luther King Jr Blvd (N Logan St); N Washington Ave; W Kilborn St; W Grand River Ave; S Grand Ave; S Walnut St; S Capitol Ave; Lansing Ave; Princeton Ave; N Butler Blvd; S Pine St; S Butler Blvd; S Sycamore St; Townsend St; E Hillsdale St; S Martin Luther King Jr Blvd (Logan St); Roosevelt Ave; Cross St; E St Joseph St; Knollwood Ave; E Lenawee St; Washington Sq S; Englewood Ct; Roseneath Ave; E Kalamazoo St; River St; Cypress St; Chicago Ave; Wisconsin Ave; Cherry St; Washington Sq N; S Chestnut St; Daleford Ave; Christopher St; Schoolcraft Dr; E Shiawassee St; Edgewood Ct; Summerville Ave; S Washington Ave; Brook St; N Grand River Ave; E Ottawa St; E Washtenaw St; E Michigan Ave; Daleford St; Bluff St; Muskegon Ave; E Ionia St; W Michigan Ave; E Allegan St; State St; Emerson St; Leonard Ct; E Madison St; Bancroft Ct; Leitram Ct; E Kilborn St; Glenn St; E Grand River Ave; Pleasant St; Edmore St; Ontario St; Inner Ct; Queen St; Greenwood St; Lawler Ct; E Maple St; Lemrock Ct; Savoy Ct; E Willow St; Kalamazoo Plz; Grand Ct; S Martin Luther King Jr Blvd (S Logan St).
Railroad features: Conrail RR.
Downtown neighborhood detailed profile
Durant Park neighborhood in Lansing statistics: (Find on map)
Area: 0.044 square miles
Population: 341
Population density:
Median household income in 2021:
Median rent in in 2021:
Male vs Females
Median age
Most popular occupations of males: material moving occupations (16.3%); education, training, and library occupations (15.8%); service occupations (15.0%); arts, design, entertainment, sports, and media occupations (12.2%); transportation occupations (7.4%); construction, extraction, and maintenance occupations (7.0%); production occupations (6.5%)
Most popular occupations of females: sales and office occupations (25.9%); service occupations (25.5%); education, training, and library occupations (15.1%); community and social services occupations (7.4%); management occupations (except farmers) (5.7%); production occupations (3.5%); transportation occupations (3.5%)
Highways in this neighborhood: W Saginaw St (State Hwy 43, I- 69 Bus).
Roads and streets: W Madison St; N Walnut St; Seymour Ave.
Durant Park neighborhood detailed profile
Area: 0.044 square miles
Population: 341
Population density:
| Durant Park: | 7,811 people per square mile |
| Lansing: | 3,191 people per square mile |
Median household income in 2021:
| Durant Park: | $38,075 |
| Lansing: | $48,818 |
Median rent in in 2021:
| Durant Park: | $690 |
| Lansing: | $719 |
Male vs Females
| Males: | 145 |
| Females: | 196 |
Median age
| Males: | 29.9 years |
| Females: | 29.6 years |
Most popular occupations of males: material moving occupations (16.3%); education, training, and library occupations (15.8%); service occupations (15.0%); arts, design, entertainment, sports, and media occupations (12.2%); transportation occupations (7.4%); construction, extraction, and maintenance occupations (7.0%); production occupations (6.5%)
Most popular occupations of females: sales and office occupations (25.9%); service occupations (25.5%); education, training, and library occupations (15.1%); community and social services occupations (7.4%); management occupations (except farmers) (5.7%); production occupations (3.5%); transportation occupations (3.5%)
Highways in this neighborhood: W Saginaw St (State Hwy 43, I- 69 Bus).
Roads and streets: W Madison St; N Walnut St; Seymour Ave.
Durant Park neighborhood detailed profile
East Battenfield neighborhood in Lansing statistics: (Find on map)
Area: 0.042 square miles
Population: 16
Population density:
Median household income in 2021:
Median rent in in 2021:
Male vs Females
Median age
Housing prices:
Average estimated value of detached houses in 2021 (40.0% of all units):
Average estimated value of townhouses or other attached units in 2021 (40.0% of all units):
Most popular occupations of males: service occupations (61.5%); transportation occupations (23.3%); sales and office occupations (21.5%); production occupations (12.9%); farming, fishing, and forestry occupations (10.7%); business and financial operations occupations (10.4%); construction, extraction, and maintenance occupations (9.1%)
Most popular occupations of females: sales and office occupations (48.7%); service occupations (14.7%); business and financial operations occupations (11.6%); education, training, and library occupations (8.9%); transportation occupations (6.9%); healthcare practitioners and technical occupations (6.0%); community and social services occupations (5.4%)
Roads and streets: Devonshire Ave; Shirley St; Ellas Ct.
East Battenfield neighborhood detailed profile
Area: 0.042 square miles
Population: 16
Population density:
| East Battenfield: | 380 people per square mile |
| Lansing: | 3,191 people per square mile |
Median household income in 2021:
| East Battenfield: | $76,000 |
| Lansing: | $48,818 |
Median rent in in 2021:
| East Battenfield: | $686 |
| Lansing: | $719 |
Male vs Females
| Males: | 7 |
| Females: | 9 |
Median age
| Males: | 38.9 years |
| Females: | 33.3 years |
Housing prices:
Average estimated value of detached houses in 2021 (40.0% of all units):
| East Battenfield: | $116,311 |
| Lansing: | $98,556 |
Average estimated value of townhouses or other attached units in 2021 (40.0% of all units):
| This neighborhood: | $54,235 |
| city: | $168,956 |
Most popular occupations of males: service occupations (61.5%); transportation occupations (23.3%); sales and office occupations (21.5%); production occupations (12.9%); farming, fishing, and forestry occupations (10.7%); business and financial operations occupations (10.4%); construction, extraction, and maintenance occupations (9.1%)
Most popular occupations of females: sales and office occupations (48.7%); service occupations (14.7%); business and financial operations occupations (11.6%); education, training, and library occupations (8.9%); transportation occupations (6.9%); healthcare practitioners and technical occupations (6.0%); community and social services occupations (5.4%)
Roads and streets: Devonshire Ave; Shirley St; Ellas Ct.
East Battenfield neighborhood detailed profile
Eastern neighborhood in Lansing statistics: (Find on map)
Area: 0.062 square miles
Population: 561
Population density:
Median household income in 2021:
Median rent in in 2021:
Male vs Females
Median age
Average estimated value of detached houses in 2021 (53.7% of all units):
Most popular occupations of males: farming, fishing, and forestry occupations (34.2%); sales and office occupations (18.6%); community and social services occupations (14.7%); education, training, and library occupations (10.2%); business and financial operations occupations (9.7%); production occupations (7.6%); management occupations (except farmers) (7.1%)
Most popular occupations of females: service occupations (32.5%); healthcare practitioners and technical occupations (24.8%); sales and office occupations (20.8%); education, training, and library occupations (9.1%); management occupations (except farmers) (8.6%); material moving occupations (4.9%); arts, design, entertainment, sports, and media occupations (4.0%)
Roads and streets: E Michigan Ave; Vine St; Jerome St; N 8th St; N Hosmer St; E Shiawassee St; Haag Ct.
Eastern neighborhood detailed profile
Area: 0.062 square miles
Population: 561
Population density:
| Eastern: | 9,054 people per square mile |
| Lansing: | 3,191 people per square mile |
Median household income in 2021:
| Eastern: | $44,562 |
| Lansing: | $48,818 |
Median rent in in 2021:
| Eastern: | $692 |
| Lansing: | $719 |
Male vs Females
| Males: | 332 |
| Females: | 229 |
Median age
| Males: | 39.6 years |
| Females: | 27.7 years |
Average estimated value of detached houses in 2021 (53.7% of all units):
| Eastern: | $82,856 |
| Lansing: | $98,556 |
Most popular occupations of males: farming, fishing, and forestry occupations (34.2%); sales and office occupations (18.6%); community and social services occupations (14.7%); education, training, and library occupations (10.2%); business and financial operations occupations (9.7%); production occupations (7.6%); management occupations (except farmers) (7.1%)
Most popular occupations of females: service occupations (32.5%); healthcare practitioners and technical occupations (24.8%); sales and office occupations (20.8%); education, training, and library occupations (9.1%); management occupations (except farmers) (8.6%); material moving occupations (4.9%); arts, design, entertainment, sports, and media occupations (4.0%)
Roads and streets: E Michigan Ave; Vine St; Jerome St; N 8th St; N Hosmer St; E Shiawassee St; Haag Ct.
Eastern neighborhood detailed profile
Eastfield neighborhood in Lansing statistics: (Find on map)
Area: 0.075 square miles
Population: 238
Population density:
Median household income in 2021:
Median rent in in 2021:
Male vs Females
Median age
Average estimated value of detached houses in 2021 (57.0% of all units):
Most popular occupations of males: sales and office occupations (21.6%); production occupations (21.0%); service occupations (20.7%); management occupations (except farmers) (13.4%); farming, fishing, and forestry occupations (9.7%); business and financial operations occupations (6.2%); life, physical, and social science occupations (3.6%)
Most popular occupations of females: management occupations (except farmers) (24.9%); material moving occupations (12.0%); sales and office occupations (11.2%); service occupations (10.7%); community and social services occupations (8.0%); education, training, and library occupations (7.6%); arts, design, entertainment, sports, and media occupations (6.8%)
Roads and streets: Jerome St; Vine St; E Michigan Ave; Rumsey Ave; Ferguson St; Custer Ave; Marshall St; N Holmes St.
Eastfield neighborhood detailed profile
Area: 0.075 square miles
Population: 238
Population density:
| Eastfield: | 3,179 people per square mile |
| Lansing: | 3,191 people per square mile |
Median household income in 2021:
| Eastfield: | $57,631 |
| Lansing: | $48,818 |
Median rent in in 2021:
| Eastfield: | $653 |
| Lansing: | $719 |
Male vs Females
| Males: | 125 |
| Females: | 112 |
Median age
| Males: | 32.2 years |
| Females: | 34.6 years |
Average estimated value of detached houses in 2021 (57.0% of all units):
| Eastfield: | $46,449 |
| Lansing: | $98,556 |
Most popular occupations of males: sales and office occupations (21.6%); production occupations (21.0%); service occupations (20.7%); management occupations (except farmers) (13.4%); farming, fishing, and forestry occupations (9.7%); business and financial operations occupations (6.2%); life, physical, and social science occupations (3.6%)
Most popular occupations of females: management occupations (except farmers) (24.9%); material moving occupations (12.0%); sales and office occupations (11.2%); service occupations (10.7%); community and social services occupations (8.0%); education, training, and library occupations (7.6%); arts, design, entertainment, sports, and media occupations (6.8%)
Roads and streets: Jerome St; Vine St; E Michigan Ave; Rumsey Ave; Ferguson St; Custer Ave; Marshall St; N Holmes St.
Eastfield neighborhood detailed profile
Eastside neighborhood in Lansing statistics: (Find on map)
Area: 2.951 square miles
Population: 12,784
Population density:
Median household income in 2021:
Median rent in in 2021:
Male vs Females
Median age
Average estimated value of detached houses in 2021 (74.7% of all units):
Most popular occupations of males: service occupations (16.0%); sales and office occupations (15.7%); production occupations (10.0%); management occupations (except farmers) (9.7%); business and financial operations occupations (6.6%); material moving occupations (6.3%); education, training, and library occupations (5.7%)
Most popular occupations of females: service occupations (25.5%); sales and office occupations (23.0%); management occupations (except farmers) (10.1%); business and financial operations occupations (8.9%); education, training, and library occupations (6.8%); healthcare practitioners and technical occupations (6.4%); arts, design, entertainment, sports, and media occupations (5.5%)
Limited-access highways (interstate or state) in this neighborhood: US Hwy 27 Bus (I- 496); US Hwy 127.
Highways in this neighborhood: State Hwy 43 (I- 69 Bus, E Saginaw St); US Hwy 27 Bus (S Cedar St, I- 96 Bus); State Hwy 143 (Michigan Ave).
Roads and streets: E Kalamazoo St; E Michigan Ave; Prospect St; E Main St; Jerome St; Vine St; May St; Walsh St; E Hazel St; Marcus St; S Pennsylvania Ave; S Holmes St; Shepard St; Leslie St; Eureka St; Regent St; Lathrop St; Elizabeth St; Fernwood Ave; Perkins St; S Clemens Ave; E Shiawassee St; S Hosmer St; N Pennsylvania Ave; N Francis Ave; N Foster Ave; N Hayford Ave; N Fairview Ave; N Magnolia Ave; Marshall St; Heald Pl; S Francis Ave; Allen St; S Hayford Ave; S Magnolia Ave; S Fairview Ave; Detroit St; Charles St; Mifflin Ave; Kipling Blvd; Hickory St; S Foster Ave; Lasalle Blvd; N Clemens Ave; Museum Dr; N Howard Ave; Bement St; Clifford St; Jones St; Dakin St; Aurelius Rd; Bensch St; Larned St; Mc Cullough St; Euclid Pl; S Howard Ave; Horton St; Climax St; Harton St; Beech St; Gray St; Sheridan St; E Elm St; Saginaw Access Rd; Haco Dr; la Salle Gdns; E St Joseph St; Parker St; River St; Bingham St; S 8th St; Pere Marquette Dr; Orchard St; Worthington Dr; Monroe St; Wickman Dr; Hill St; Prudden St; S East St; Rumsey Ave; Ferguson St; N Holmes St; Nantucket Dr; E Genesee St; Center St; Mechanic St; Downer Ave; Parkview St; Newton St; Merrill Ave (Merrill St); N 8th St; Custer Ave; N Hosmer St; Spring St; Access Rd; Midvale Ave; Lesher Pl; Raider St; Erie St; Fuller St; Elvin Ct; Dunston Drove; Lee Blvd; E Hillsdale St; Barnard St; Linden Grove Ave; Park Pl; Morgan St; Park Ter; Mahlon St; Clark St; Cleveland St; Maryland Ave; Johnson Ave; Haag Ct; Virginia St; Rosamond St; Stanley Ct; Truck Ct; Dorrance Pl; Quaker Ct; Wendover Dr; Manchester Ct; Sellers Ave; Helen St; Lasalle Ct; Whiteley Ct; Jay St; Mosher St.
Railroad features: Conrail RR; Csx RR; Grand Funk Western RR (Amtrak RR).
Eastside neighborhood detailed profile
Area: 2.951 square miles
Population: 12,784
Population density:
| Eastside: | 4,332 people per square mile |
| Lansing: | 3,191 people per square mile |
Median household income in 2021:
| Eastside: | $46,476 |
| Lansing: | $48,818 |
Median rent in in 2021:
| Eastside: | $786 |
| Lansing: | $719 |
Male vs Females
| Males: | 7,164 |
| Females: | 5,620 |
Median age
| Males: | 30.9 years |
| Females: | 33.0 years |
Average estimated value of detached houses in 2021 (74.7% of all units):
| Eastside: | $72,489 |
| Lansing: | $98,556 |
Most popular occupations of males: service occupations (16.0%); sales and office occupations (15.7%); production occupations (10.0%); management occupations (except farmers) (9.7%); business and financial operations occupations (6.6%); material moving occupations (6.3%); education, training, and library occupations (5.7%)
Most popular occupations of females: service occupations (25.5%); sales and office occupations (23.0%); management occupations (except farmers) (10.1%); business and financial operations occupations (8.9%); education, training, and library occupations (6.8%); healthcare practitioners and technical occupations (6.4%); arts, design, entertainment, sports, and media occupations (5.5%)
Limited-access highways (interstate or state) in this neighborhood: US Hwy 27 Bus (I- 496); US Hwy 127.
Highways in this neighborhood: State Hwy 43 (I- 69 Bus, E Saginaw St); US Hwy 27 Bus (S Cedar St, I- 96 Bus); State Hwy 143 (Michigan Ave).
Roads and streets: E Kalamazoo St; E Michigan Ave; Prospect St; E Main St; Jerome St; Vine St; May St; Walsh St; E Hazel St; Marcus St; S Pennsylvania Ave; S Holmes St; Shepard St; Leslie St; Eureka St; Regent St; Lathrop St; Elizabeth St; Fernwood Ave; Perkins St; S Clemens Ave; E Shiawassee St; S Hosmer St; N Pennsylvania Ave; N Francis Ave; N Foster Ave; N Hayford Ave; N Fairview Ave; N Magnolia Ave; Marshall St; Heald Pl; S Francis Ave; Allen St; S Hayford Ave; S Magnolia Ave; S Fairview Ave; Detroit St; Charles St; Mifflin Ave; Kipling Blvd; Hickory St; S Foster Ave; Lasalle Blvd; N Clemens Ave; Museum Dr; N Howard Ave; Bement St; Clifford St; Jones St; Dakin St; Aurelius Rd; Bensch St; Larned St; Mc Cullough St; Euclid Pl; S Howard Ave; Horton St; Climax St; Harton St; Beech St; Gray St; Sheridan St; E Elm St; Saginaw Access Rd; Haco Dr; la Salle Gdns; E St Joseph St; Parker St; River St; Bingham St; S 8th St; Pere Marquette Dr; Orchard St; Worthington Dr; Monroe St; Wickman Dr; Hill St; Prudden St; S East St; Rumsey Ave; Ferguson St; N Holmes St; Nantucket Dr; E Genesee St; Center St; Mechanic St; Downer Ave; Parkview St; Newton St; Merrill Ave (Merrill St); N 8th St; Custer Ave; N Hosmer St; Spring St; Access Rd; Midvale Ave; Lesher Pl; Raider St; Erie St; Fuller St; Elvin Ct; Dunston Drove; Lee Blvd; E Hillsdale St; Barnard St; Linden Grove Ave; Park Pl; Morgan St; Park Ter; Mahlon St; Clark St; Cleveland St; Maryland Ave; Johnson Ave; Haag Ct; Virginia St; Rosamond St; Stanley Ct; Truck Ct; Dorrance Pl; Quaker Ct; Wendover Dr; Manchester Ct; Sellers Ave; Helen St; Lasalle Ct; Whiteley Ct; Jay St; Mosher St.
Railroad features: Conrail RR; Csx RR; Grand Funk Western RR (Amtrak RR).
Eastside neighborhood detailed profile
Fabulous Acres neighborhood in Lansing statistics: (Find on map)
Area: 0.089 square miles
Population: 535
Population density:
Median household income in 2021:
Median rent in in 2021:
Male vs Females
Median age
Average estimated value of detached houses in 2021 (67.2% of all units):
Most popular occupations of males: sales and office occupations (42.2%); service occupations (20.3%); education, training, and library occupations (16.3%); production occupations (8.6%); material moving occupations (7.0%); transportation occupations (5.1%)
Most popular occupations of females: service occupations (62.6%); education, training, and library occupations (9.4%); management occupations (except farmers) (8.3%); production occupations (8.3%); healthcare practitioners and technical occupations (6.0%); transportation occupations (4.9%)
Highways in this neighborhood: S Cedar St (Martin Luther King Jr Blvd, Cedar St, I- 96 Bus).
Roads and streets: E Mount Hope Ave; Herbert St; Norman St; Isbell St; Maplewood Ave; Wilson St; Teel Ave; Martin St.
Railroad features: Conrail RR.
Fabulous Acres neighborhood detailed profile
Area: 0.089 square miles
Population: 535
Population density:
| Fabulous Acres: | 6,013 people per square mile |
| Lansing: | 3,191 people per square mile |
Median household income in 2021:
| Fabulous Acres: | $34,896 |
| Lansing: | $48,818 |
Median rent in in 2021:
| Fabulous Acres: | $691 |
| Lansing: | $719 |
Male vs Females
| Males: | 171 |
| Females: | 364 |
Median age
| Males: | 36.4 years |
| Females: | 36.3 years |
Average estimated value of detached houses in 2021 (67.2% of all units):
| Fabulous Acres: | $65,902 |
| Lansing: | $98,556 |
Most popular occupations of males: sales and office occupations (42.2%); service occupations (20.3%); education, training, and library occupations (16.3%); production occupations (8.6%); material moving occupations (7.0%); transportation occupations (5.1%)
Most popular occupations of females: service occupations (62.6%); education, training, and library occupations (9.4%); management occupations (except farmers) (8.3%); production occupations (8.3%); healthcare practitioners and technical occupations (6.0%); transportation occupations (4.9%)
Highways in this neighborhood: S Cedar St (Martin Luther King Jr Blvd, Cedar St, I- 96 Bus).
Roads and streets: E Mount Hope Ave; Herbert St; Norman St; Isbell St; Maplewood Ave; Wilson St; Teel Ave; Martin St.
Railroad features: Conrail RR.
Fabulous Acres neighborhood detailed profile
Fairview neighborhood in Lansing statistics: (Find on map)
Area: 0.230 square miles
Population: 1,317
Population density:
Median household income in 2021:
Median rent in in 2021:
Male vs Females
Median age
Average estimated value of detached houses in 2021 (85.5% of all units):
Most popular occupations of males: service occupations (22.4%); construction, extraction, and maintenance occupations (13.6%); sales and office occupations (13.2%); management occupations (except farmers) (10.4%); business and financial operations occupations (8.7%); production occupations (8.1%); education, training, and library occupations (4.7%)
Most popular occupations of females: sales and office occupations (33.2%); business and financial operations occupations (18.3%); service occupations (16.2%); arts, design, entertainment, sports, and media occupations (11.7%); education, training, and library occupations (6.2%); management occupations (except farmers) (2.9%); production occupations (2.9%)
Roads and streets: E Kalamazoo St; Leslie St; Prospect St; Marcus St; S Clemens Ave; S Fairview Ave; Elizabeth St; Regent St; S Francis Ave; S Magnolia Ave; S Hayford Ave; S Foster Ave.
Fairview neighborhood detailed profile
Area: 0.230 square miles
Population: 1,317
Population density:
| Fairview: | 5,721 people per square mile |
| Lansing: | 3,191 people per square mile |
Median household income in 2021:
| Fairview: | $46,349 |
| Lansing: | $48,818 |
Median rent in in 2021:
| Fairview: | $880 |
| Lansing: | $719 |
Male vs Females
| Males: | 727 |
| Females: | 590 |
Median age
| Males: | 30.8 years |
| Females: | 34.1 years |
Average estimated value of detached houses in 2021 (85.5% of all units):
| Fairview: | $77,515 |
| Lansing: | $98,556 |
Most popular occupations of males: service occupations (22.4%); construction, extraction, and maintenance occupations (13.6%); sales and office occupations (13.2%); management occupations (except farmers) (10.4%); business and financial operations occupations (8.7%); production occupations (8.1%); education, training, and library occupations (4.7%)
Most popular occupations of females: sales and office occupations (33.2%); business and financial operations occupations (18.3%); service occupations (16.2%); arts, design, entertainment, sports, and media occupations (11.7%); education, training, and library occupations (6.2%); management occupations (except farmers) (2.9%); production occupations (2.9%)
Roads and streets: E Kalamazoo St; Leslie St; Prospect St; Marcus St; S Clemens Ave; S Fairview Ave; Elizabeth St; Regent St; S Francis Ave; S Magnolia Ave; S Hayford Ave; S Foster Ave.
Fairview neighborhood detailed profile
Forest View neighborhood in Lansing statistics: (Find on map)
Area: 3.903 square miles
Population: 4,888
Population density:
Median household income in 2021:
Median rent in in 2021:
Male vs Females
Median age
Housing prices:
Average estimated value of detached houses in 2021 (52.1% of all units):
Average estimated value of townhouses or other attached units in 2021 (24.0% of all units):
Average estimated value of housing units in 2-unit structures in 2021 (5.5% of all units):
Average estimated '21 value of housing units in 3-to-4-unit structures (2.0% of all units):
Most popular occupations of males: service occupations (26.6%); sales and office occupations (16.0%); business and financial operations occupations (8.5%); production occupations (8.1%); education, training, and library occupations (8.0%); management occupations (except farmers) (6.9%); construction, extraction, and maintenance occupations (3.9%)
Most popular occupations of females: service occupations (24.9%); sales and office occupations (24.0%); education, training, and library occupations (20.2%); management occupations (except farmers) (8.1%); healthcare practitioners and technical occupations (5.9%); production occupations (5.6%); business and financial operations occupations (2.8%)
Limited-access highways (interstate or state) in this neighborhood: I- 496 (US Hwy 127).
Roads and streets: Forest Rd; Aurelius Rd; E Jolly Rd; Collins Rd; Dunckel Rd; E Cavanaugh Rd; Wabash Rd; E Mount Hope Ave; Stoneleigh Dr; Ruth Ave; Trappers Cove Trl; Beau Jardin Dr; Provincial House Dr; Robinson Rd; Staten Ave; Manley Dr; S Harrison Rd; Luwanna Dr; Eastlawn Dr; Hamelon St; Irvington Ave; Hoyt Ave; Rex St; Alliance Dr; Technology Blvd; Leawood Dr; E Willard Ave; Wayne St; Tammany Ave; Trudy Ln; Artisan Dr; Fireside Dr; Chickory Ln; Champion Way; Duvernay Dr; Fidelity Rd; Irene St; Dier St; E Holmes Rd; Windbreak Ln; Solomon Dr; Oakbrook Dr; Worden St; Scarborough Rd; Lourdes Ct; Narraganset Dr; Aurora Dr; Canarsie Dr; Arbor Forest Dr; Belle Chasse Blvd; Geert Ct; Aldrich Dr; Hazelwood Dr; Greenwich Ct; E Provincial House Dr; Callahan Ct; Truman Cir; Norfolk Ct; Trudy.
Railroad features: Csx RR; Grand Funk Western RR (Amtrak RR).
Forest View neighborhood detailed profile
Area: 3.903 square miles
Population: 4,888
Population density:
| Forest View: | 1,252 people per square mile |
| Lansing: | 3,191 people per square mile |
Median household income in 2021:
| Forest View: | $50,611 |
| Lansing: | $48,818 |
Median rent in in 2021:
| Forest View: | $886 |
| Lansing: | $719 |
Male vs Females
| Males: | 2,308 |
| Females: | 2,580 |
Median age
| Males: | 31.2 years |
| Females: | 32.0 years |
Housing prices:
Average estimated value of detached houses in 2021 (52.1% of all units):
| Forest View: | $93,634 |
| Lansing: | $98,556 |
Average estimated value of townhouses or other attached units in 2021 (24.0% of all units):
| This neighborhood: | $54,235 |
| city: | $168,956 |
Average estimated value of housing units in 2-unit structures in 2021 (5.5% of all units):
| This neighborhood: | $26,516 |
| Lansing: | $233,813 |
Average estimated '21 value of housing units in 3-to-4-unit structures (2.0% of all units):
| Forest View: | $32,776 |
| city: | $50,233 |
Most popular occupations of males: service occupations (26.6%); sales and office occupations (16.0%); business and financial operations occupations (8.5%); production occupations (8.1%); education, training, and library occupations (8.0%); management occupations (except farmers) (6.9%); construction, extraction, and maintenance occupations (3.9%)
Most popular occupations of females: service occupations (24.9%); sales and office occupations (24.0%); education, training, and library occupations (20.2%); management occupations (except farmers) (8.1%); healthcare practitioners and technical occupations (5.9%); production occupations (5.6%); business and financial operations occupations (2.8%)
Limited-access highways (interstate or state) in this neighborhood: I- 496 (US Hwy 127).
Roads and streets: Forest Rd; Aurelius Rd; E Jolly Rd; Collins Rd; Dunckel Rd; E Cavanaugh Rd; Wabash Rd; E Mount Hope Ave; Stoneleigh Dr; Ruth Ave; Trappers Cove Trl; Beau Jardin Dr; Provincial House Dr; Robinson Rd; Staten Ave; Manley Dr; S Harrison Rd; Luwanna Dr; Eastlawn Dr; Hamelon St; Irvington Ave; Hoyt Ave; Rex St; Alliance Dr; Technology Blvd; Leawood Dr; E Willard Ave; Wayne St; Tammany Ave; Trudy Ln; Artisan Dr; Fireside Dr; Chickory Ln; Champion Way; Duvernay Dr; Fidelity Rd; Irene St; Dier St; E Holmes Rd; Windbreak Ln; Solomon Dr; Oakbrook Dr; Worden St; Scarborough Rd; Lourdes Ct; Narraganset Dr; Aurora Dr; Canarsie Dr; Arbor Forest Dr; Belle Chasse Blvd; Geert Ct; Aldrich Dr; Hazelwood Dr; Greenwich Ct; E Provincial House Dr; Callahan Ct; Truman Cir; Norfolk Ct; Trudy.
Railroad features: Csx RR; Grand Funk Western RR (Amtrak RR).
Forest View neighborhood detailed profile
Genesee neighborhood in Lansing statistics: (Find on map)
Area: 0.168 square miles
Population: 1,278
Population density:
Median household income in 2021:
Median rent in in 2021:
Male vs Females
Median age
Average estimated value of detached houses in 2021 (32.4% of all units):
Most popular occupations of males: construction, extraction, and maintenance occupations (16.2%); service occupations (13.8%); computer and mathematical occupations (12.5%); sales and office occupations (12.1%); arts, design, entertainment, sports, and media occupations (10.2%); production occupations (7.3%); community and social services occupations (7.2%)
Most popular occupations of females: sales and office occupations (24.6%); service occupations (19.7%); computer and mathematical occupations (13.4%); education, training, and library occupations (9.9%); management occupations (except farmers) (9.6%); production occupations (7.8%); life, physical, and social science occupations (5.4%)
Highways in this neighborhood: I- 69 Bus (W Saginaw St, State Hwy 43).
Roads and streets: W Shiawassee St; W Genesee St; W Lapeer St; W Ottawa St; W Ionia St; N Sycamore St; N Pine St; N Butler Blvd; N Martin Luther King Jr Blvd (N Logan St); Bancroft Ct; Logan St (N Martin Luther King Jr Blvd); Leitram Ct; Inner Ct.
Genesee neighborhood detailed profile
Area: 0.168 square miles
Population: 1,278
Population density:
| Genesee: | 7,609 people per square mile |
| Lansing: | 3,191 people per square mile |
Median household income in 2021:
| Genesee: | $42,612 |
| Lansing: | $48,818 |
Median rent in in 2021:
| Genesee: | $597 |
| Lansing: | $719 |
Male vs Females
| Males: | 578 |
| Females: | 700 |
Median age
| Males: | 31.5 years |
| Females: | 36.8 years |
Average estimated value of detached houses in 2021 (32.4% of all units):
| Genesee: | $114,191 |
| Lansing: | $98,556 |
Most popular occupations of males: construction, extraction, and maintenance occupations (16.2%); service occupations (13.8%); computer and mathematical occupations (12.5%); sales and office occupations (12.1%); arts, design, entertainment, sports, and media occupations (10.2%); production occupations (7.3%); community and social services occupations (7.2%)
Most popular occupations of females: sales and office occupations (24.6%); service occupations (19.7%); computer and mathematical occupations (13.4%); education, training, and library occupations (9.9%); management occupations (except farmers) (9.6%); production occupations (7.8%); life, physical, and social science occupations (5.4%)
Highways in this neighborhood: I- 69 Bus (W Saginaw St, State Hwy 43).
Roads and streets: W Shiawassee St; W Genesee St; W Lapeer St; W Ottawa St; W Ionia St; N Sycamore St; N Pine St; N Butler Blvd; N Martin Luther King Jr Blvd (N Logan St); Bancroft Ct; Logan St (N Martin Luther King Jr Blvd); Leitram Ct; Inner Ct.
Genesee neighborhood detailed profile
Green Oaks neighborhood in Lansing statistics: (Find on map)
Area: 0.061 square miles
Population: 574
Population density:
Median household income in 2021:
Median rent in in 2021:
Male vs Females
Median age
Average estimated value of detached houses in 2021 (54.0% of all units):
Most popular occupations of males: farming, fishing, and forestry occupations (34.5%); sales and office occupations (18.6%); community and social services occupations (14.8%); service occupations (14.3%); production occupations (10.7%); education, training, and library occupations (10.3%); management occupations (except farmers) (9.9%)
Most popular occupations of females: service occupations (32.7%); healthcare practitioners and technical occupations (25.2%); sales and office occupations (20.4%); business and financial operations occupations (14.2%); management occupations (except farmers) (8.8%); education, training, and library occupations (8.8%); material moving occupations (7.0%)
Roads and streets: Prospect St; Eureka St; S 8th St; S Hosmer St; E Kalamazoo St; Hill St; Mosher St.
Railroad features: Csx RR.
Green Oaks neighborhood detailed profile
Area: 0.061 square miles
Population: 574
Population density:
| Green Oaks: | 9,413 people per square mile |
| Lansing: | 3,191 people per square mile |
Median household income in 2021:
| Green Oaks: | $35,909 |
| Lansing: | $48,818 |
Median rent in in 2021:
| Green Oaks: | $678 |
| Lansing: | $719 |
Male vs Females
| Males: | 339 |
| Females: | 234 |
Median age
| Males: | 48.4 years |
| Females: | 26.7 years |
Average estimated value of detached houses in 2021 (54.0% of all units):
| Green Oaks: | $83,470 |
| Lansing: | $98,556 |
Most popular occupations of males: farming, fishing, and forestry occupations (34.5%); sales and office occupations (18.6%); community and social services occupations (14.8%); service occupations (14.3%); production occupations (10.7%); education, training, and library occupations (10.3%); management occupations (except farmers) (9.9%)
Most popular occupations of females: service occupations (32.7%); healthcare practitioners and technical occupations (25.2%); sales and office occupations (20.4%); business and financial operations occupations (14.2%); management occupations (except farmers) (8.8%); education, training, and library occupations (8.8%); material moving occupations (7.0%)
Roads and streets: Prospect St; Eureka St; S 8th St; S Hosmer St; E Kalamazoo St; Hill St; Mosher St.
Railroad features: Csx RR.
Green Oaks neighborhood detailed profile
Groesbeck neighborhood in Lansing statistics: (Find on map)
Area: 0.940 square miles
Population: 2,551
Population density:
Median household income in 2021:
Median rent in in 2021:
Male vs Females
Median age
Most popular occupations of males: education, training, and library occupations (43.1%); production occupations (19.0%); business and financial operations occupations (11.2%); management occupations (except farmers) (10.1%); sales and office occupations (9.7%); service occupations (7.3%); healthcare practitioners and technical occupations (4.5%)
Most popular occupations of females: production occupations (22.3%); management occupations (except farmers) (20.9%); education, training, and library occupations (18.3%); healthcare practitioners and technical occupations (15.2%); sales and office occupations (12.0%); legal occupations (9.4%); community and social services occupations (8.4%)
Limited-access highways (interstate or state) in this neighborhood: US Hwy 127.
Highways in this neighborhood: State Hwy 43 (I- 69 Bus, Grand River Ave).
Roads and streets: N Fairview Ave; Tulane Dr; Chester Rd; Woodruff Ave; N Hayford Ave; Hopkins Ave; Montego Dr; Groesbeck Ave; Heights Ave; N Foster Ave; Vassar Dr; N Homer St; N Magnolia Ave; Mark Ave; Weber Dr; Gay Ln; Lyman Dr; Ridgeline Dr; Kingswood Dr; Greenbriar Ave; Downer Ave; Northampton Way; Autumn Ln; Darien Dr; Lake Lansing Rd; Kimberly Dr; Blake Ave; Marguerite Ave; Shoppers Alley St; Springfield Ln; Covington Ct; Post Oak Ln; Bolley Dr; Senate Dr; N Howard Ave; Mayfair Dr; Kerry St; Kirkwood Rd; Barritt St; Little St; Belmar Cir; Meadowcroft Dr; Somercroft Dr; Majestic Ct; Bryon Cir; Bascom Cir; Imperial Cir; Emerald Ct; Kenwick Cir.
Groesbeck neighborhood detailed profile
Area: 0.940 square miles
Population: 2,551
Population density:
| Groesbeck: | 2,713 people per square mile |
| Lansing: | 3,191 people per square mile |
Median household income in 2021:
| Groesbeck: | $115,735 |
| Lansing: | $48,818 |
Median rent in in 2021:
| Groesbeck: | $951 |
| Lansing: | $719 |
Male vs Females
| Males: | 1,241 |
| Females: | 1,310 |
Median age
| Males: | 67.1 years |
| Females: | 58.9 years |
Most popular occupations of males: education, training, and library occupations (43.1%); production occupations (19.0%); business and financial operations occupations (11.2%); management occupations (except farmers) (10.1%); sales and office occupations (9.7%); service occupations (7.3%); healthcare practitioners and technical occupations (4.5%)
Most popular occupations of females: production occupations (22.3%); management occupations (except farmers) (20.9%); education, training, and library occupations (18.3%); healthcare practitioners and technical occupations (15.2%); sales and office occupations (12.0%); legal occupations (9.4%); community and social services occupations (8.4%)
Limited-access highways (interstate or state) in this neighborhood: US Hwy 127.
Highways in this neighborhood: State Hwy 43 (I- 69 Bus, Grand River Ave).
Roads and streets: N Fairview Ave; Tulane Dr; Chester Rd; Woodruff Ave; N Hayford Ave; Hopkins Ave; Montego Dr; Groesbeck Ave; Heights Ave; N Foster Ave; Vassar Dr; N Homer St; N Magnolia Ave; Mark Ave; Weber Dr; Gay Ln; Lyman Dr; Ridgeline Dr; Kingswood Dr; Greenbriar Ave; Downer Ave; Northampton Way; Autumn Ln; Darien Dr; Lake Lansing Rd; Kimberly Dr; Blake Ave; Marguerite Ave; Shoppers Alley St; Springfield Ln; Covington Ct; Post Oak Ln; Bolley Dr; Senate Dr; N Howard Ave; Mayfair Dr; Kerry St; Kirkwood Rd; Barritt St; Little St; Belmar Cir; Meadowcroft Dr; Somercroft Dr; Majestic Ct; Bryon Cir; Bascom Cir; Imperial Cir; Emerald Ct; Kenwick Cir.
Groesbeck neighborhood detailed profile
Hull Court Park neighborhood in Lansing statistics: (Find on map)
Area: 0.037 square miles
Population: 612
Population density:
Median household income in 2021:
Median rent in in 2021:
Male vs Females
Median age
Average estimated value of detached houses in 2021 (100.0% of all units):
Most popular occupations of males: service occupations (29.0%); sales and office occupations (19.8%); construction, extraction, and maintenance occupations (8.9%); education, training, and library occupations (7.8%); business and financial operations occupations (6.1%); computer and mathematical occupations (5.1%); material moving occupations (5.1%)
Most popular occupations of females: sales and office occupations (45.4%); management occupations (except farmers) (17.5%); service occupations (13.1%); healthcare practitioners and technical occupations (10.5%); business and financial operations occupations (5.7%); community and social services occupations (5.3%); arts, design, entertainment, sports, and media occupations (4.8%)
Roads and streets: N Jenison Ave; Hapeman St; W Willow St; Theodore St; Hyland St; W Maple St; Hull Ct; Comfort St.
Hull Court Park neighborhood detailed profile
Area: 0.037 square miles
Population: 612
Population density:
| Hull Court Park: | 16,419 people per square mile |
| Lansing: | 3,191 people per square mile |
Median household income in 2021:
| Hull Court Park: | $60,610 |
| Lansing: | $48,818 |
Median rent in in 2021:
| Hull Court Park: | $835 |
| Lansing: | $719 |
Male vs Females
| Males: | 279 |
| Females: | 333 |
Median age
| Males: | 31.2 years |
| Females: | 29.2 years |
Average estimated value of detached houses in 2021 (100.0% of all units):
| Hull Court Park: | $82,385 |
| Lansing: | $98,556 |
Most popular occupations of males: service occupations (29.0%); sales and office occupations (19.8%); construction, extraction, and maintenance occupations (8.9%); education, training, and library occupations (7.8%); business and financial operations occupations (6.1%); computer and mathematical occupations (5.1%); material moving occupations (5.1%)
Most popular occupations of females: sales and office occupations (45.4%); management occupations (except farmers) (17.5%); service occupations (13.1%); healthcare practitioners and technical occupations (10.5%); business and financial operations occupations (5.7%); community and social services occupations (5.3%); arts, design, entertainment, sports, and media occupations (4.8%)
Roads and streets: N Jenison Ave; Hapeman St; W Willow St; Theodore St; Hyland St; W Maple St; Hull Ct; Comfort St.
Hull Court Park neighborhood detailed profile
Hunter Park neighborhood in Lansing statistics: (Find on map)
Area: 0.147 square miles
Population: 1,009
Population density:
Median household income in 2021:
Median rent in in 2021:
Male vs Females
Median age
Average estimated value of detached houses in 2021 (86.2% of all units):
Most popular occupations of males: service occupations (18.6%); sales and office occupations (15.2%); transportation occupations (13.6%); education, training, and library occupations (12.3%); construction, extraction, and maintenance occupations (10.2%); production occupations (8.0%); healthcare practitioners and technical occupations (7.0%)
Most popular occupations of females: service occupations (52.1%); sales and office occupations (30.0%); production occupations (6.0%); business and financial operations occupations (4.8%); management occupations (except farmers) (2.4%); community and social services occupations (2.4%); education, training, and library occupations (2.1%)
Limited-access highways (interstate or state) in this neighborhood: I- 496.
Roads and streets: Hickory St; Elizabeth St; Marcus St; Lathrop St; S Holmes St; Larned St; Shepard St; Jones St; Allen St; Clifford St; E Kalamazoo St; Bement St; Fuller St; Heald Pl.
Hunter Park neighborhood detailed profile
Area: 0.147 square miles
Population: 1,009
Population density:
| Hunter Park: | 6,855 people per square mile |
| Lansing: | 3,191 people per square mile |
Median household income in 2021:
| Hunter Park: | $35,265 |
| Lansing: | $48,818 |
Median rent in in 2021:
| Hunter Park: | $758 |
| Lansing: | $719 |
Male vs Females
| Males: | 532 |
| Females: | 476 |
Median age
| Males: | 30.2 years |
| Females: | 28.7 years |
Average estimated value of detached houses in 2021 (86.2% of all units):
| Hunter Park: | $81,767 |
| Lansing: | $98,556 |
Most popular occupations of males: service occupations (18.6%); sales and office occupations (15.2%); transportation occupations (13.6%); education, training, and library occupations (12.3%); construction, extraction, and maintenance occupations (10.2%); production occupations (8.0%); healthcare practitioners and technical occupations (7.0%)
Most popular occupations of females: service occupations (52.1%); sales and office occupations (30.0%); production occupations (6.0%); business and financial operations occupations (4.8%); management occupations (except farmers) (2.4%); community and social services occupations (2.4%); education, training, and library occupations (2.1%)
Limited-access highways (interstate or state) in this neighborhood: I- 496.
Roads and streets: Hickory St; Elizabeth St; Marcus St; Lathrop St; S Holmes St; Larned St; Shepard St; Jones St; Allen St; Clifford St; E Kalamazoo St; Bement St; Fuller St; Heald Pl.
Hunter Park neighborhood detailed profile
Hunter Park East neighborhood in Lansing statistics: (Find on map)
Area: 0.051 square miles
Population: 342
Population density:
Median household income in 2021:
Median rent in in 2021:
Male vs Females
Median age
Average estimated value of detached houses in 2021 (91.8% of all units):
Most popular occupations of males: service occupations (21.5%); sales and office occupations (13.3%); education, training, and library occupations (10.5%); transportation occupations (10.0%); business and financial operations occupations (9.5%); construction, extraction, and maintenance occupations (9.1%); production occupations (7.1%)
Most popular occupations of females: sales and office occupations (41.7%); service occupations (33.6%); production occupations (7.3%); community and social services occupations (6.2%); management occupations (except farmers) (5.7%); business and financial operations occupations (4.3%)
Roads and streets: Lathrop St; Shepard St; Allen St; E Kalamazoo St; Marcus St; Elizabeth St; Clifford St.
Hunter Park East neighborhood detailed profile
Area: 0.051 square miles
Population: 342
Population density:
| Hunter Park East: | 6,648 people per square mile |
| Lansing: | 3,191 people per square mile |
Median household income in 2021:
| Hunter Park East: | $35,063 |
| Lansing: | $48,818 |
Median rent in in 2021:
| Hunter Park East: | $782 |
| Lansing: | $719 |
Male vs Females
| Males: | 175 |
| Females: | 167 |
Median age
| Males: | 24.5 years |
| Females: | 29.3 years |
Average estimated value of detached houses in 2021 (91.8% of all units):
| Hunter Park East: | $78,010 |
| Lansing: | $98,556 |
Most popular occupations of males: service occupations (21.5%); sales and office occupations (13.3%); education, training, and library occupations (10.5%); transportation occupations (10.0%); business and financial operations occupations (9.5%); construction, extraction, and maintenance occupations (9.1%); production occupations (7.1%)
Most popular occupations of females: sales and office occupations (41.7%); service occupations (33.6%); production occupations (7.3%); community and social services occupations (6.2%); management occupations (except farmers) (5.7%); business and financial operations occupations (4.3%)
Roads and streets: Lathrop St; Shepard St; Allen St; E Kalamazoo St; Marcus St; Elizabeth St; Clifford St.
Hunter Park East neighborhood detailed profile
Hunter Park West neighborhood in Lansing statistics: (Find on map)
Area: 0.061 square miles
Population: 426
Population density:
Median household income in 2021:
Median rent in in 2021:
Male vs Females
Median age
Average estimated value of detached houses in 2021 (80.3% of all units):
Most popular occupations of males: sales and office occupations (16.9%); service occupations (16.3%); transportation occupations (15.4%); education, training, and library occupations (13.4%); construction, extraction, and maintenance occupations (10.5%); healthcare practitioners and technical occupations (9.8%); production occupations (8.7%)
Most popular occupations of females: service occupations (62.4%); sales and office occupations (22.2%); production occupations (5.2%); business and financial operations occupations (4.9%); education, training, and library occupations (3.0%)
Roads and streets: E Kalamazoo St; S Holmes St; Larned St; Jones St; Bement St; Hickory St; Heald Pl.
Hunter Park West neighborhood detailed profile
Area: 0.061 square miles
Population: 426
Population density:
| Hunter Park West: | 6,953 people per square mile |
| Lansing: | 3,191 people per square mile |
Median household income in 2021:
| Hunter Park West: | $38,215 |
| Lansing: | $48,818 |
Median rent in in 2021:
| Hunter Park West: | $739 |
| Lansing: | $719 |
Male vs Females
| Males: | 228 |
| Females: | 197 |
Median age
| Males: | 30.1 years |
| Females: | 26.5 years |
Average estimated value of detached houses in 2021 (80.3% of all units):
| Hunter Park West: | $83,833 |
| Lansing: | $98,556 |
Most popular occupations of males: sales and office occupations (16.9%); service occupations (16.3%); transportation occupations (15.4%); education, training, and library occupations (13.4%); construction, extraction, and maintenance occupations (10.5%); healthcare practitioners and technical occupations (9.8%); production occupations (8.7%)
Most popular occupations of females: service occupations (62.4%); sales and office occupations (22.2%); production occupations (5.2%); business and financial operations occupations (4.9%); education, training, and library occupations (3.0%)
Roads and streets: E Kalamazoo St; S Holmes St; Larned St; Jones St; Bement St; Hickory St; Heald Pl.
Hunter Park West neighborhood detailed profile
Knollwood-Willow neighborhood in Lansing statistics: (Find on map)
Area: 0.221 square miles
Population: 1,036
Population density:
Median household income in 2021:
Median rent in in 2021:
Male vs Females
Median age
Most popular occupations of males: computer and mathematical occupations (29.9%); arts, design, entertainment, sports, and media occupations (20.6%); material moving occupations (15.2%); construction, extraction, and maintenance occupations (11.8%); service occupations (10.8%); transportation occupations (10.3%); sales and office occupations (9.8%)
Most popular occupations of females: sales and office occupations (36.3%); service occupations (14.0%); management occupations (except farmers) (11.7%); community and social services occupations (9.9%); education, training, and library occupations (7.8%); production occupations (6.5%); healthcare practitioners and technical occupations (5.6%)
Roads and streets: Lansing Ave; Roosevelt Ave; Cross St; Knollwood Ave; Roseneath Ave; Cypress St; Christopher St; W Willow St; Muskegon Ave; Emerson St; N Chestnut St; Pleasant St; Edmore St; Ontario St; Queen St; Greenwood St; N Walnut St.
Knollwood-Willow neighborhood detailed profile
Area: 0.221 square miles
Population: 1,036
Population density:
| Knollwood-Willow (Knollwood Willow): | 4,682 people per square mile |
| Lansing: | 3,191 people per square mile |
Median household income in 2021:
| Knollwood-Willow (Knollwood Willow): | $43,023 |
| Lansing: | $48,818 |
Median rent in in 2021:
| Knollwood-Willow (Knollwood Willow): | $673 |
| Lansing: | $719 |
Male vs Females
| Males: | 448 |
| Females: | 588 |
Median age
| Males: | 35.2 years |
| Females: | 30.0 years |
Most popular occupations of males: computer and mathematical occupations (29.9%); arts, design, entertainment, sports, and media occupations (20.6%); material moving occupations (15.2%); construction, extraction, and maintenance occupations (11.8%); service occupations (10.8%); transportation occupations (10.3%); sales and office occupations (9.8%)
Most popular occupations of females: sales and office occupations (36.3%); service occupations (14.0%); management occupations (except farmers) (11.7%); community and social services occupations (9.9%); education, training, and library occupations (7.8%); production occupations (6.5%); healthcare practitioners and technical occupations (5.6%)
Roads and streets: Lansing Ave; Roosevelt Ave; Cross St; Knollwood Ave; Roseneath Ave; Cypress St; Christopher St; W Willow St; Muskegon Ave; Emerson St; N Chestnut St; Pleasant St; Edmore St; Ontario St; Queen St; Greenwood St; N Walnut St.
Knollwood-Willow neighborhood detailed profile
Lady Hill neighborhood in Lansing statistics: (Find on map)
Area: 0.051 square miles
Limited-access highways (interstate or state) in this neighborhood: N Grand River Ave (I- 96 Bus).
Roads and streets: Coolidge Ave (Coolidge St); Riverside Ct; Sadie Ct.
Lady Hill neighborhood detailed profile
Area: 0.051 square miles
Limited-access highways (interstate or state) in this neighborhood: N Grand River Ave (I- 96 Bus).
Roads and streets: Coolidge Ave (Coolidge St); Riverside Ct; Sadie Ct.
Lady Hill neighborhood detailed profile
Lansing Eaton neighborhood in Lansing statistics: (Find on map)
Area: 0.921 square miles
Population: 891
Population density:
Median household income in 2021:
Median rent in in 2021:
Male vs Females
Median age
Housing prices:
Average estimated value of detached houses in 2021 (51.4% of all units):
Average estimated value of townhouses or other attached units in 2021 (25.3% of all units):
Most popular occupations of males: material moving occupations (22.7%); education, training, and library occupations (18.3%); service occupations (10.7%); transportation occupations (8.9%); production occupations (8.4%); business and financial operations occupations (7.5%); farming, fishing, and forestry occupations (7.0%)
Most popular occupations of females: service occupations (42.5%); sales and office occupations (23.3%); material moving occupations (20.5%); management occupations (except farmers) (8.0%); business and financial operations occupations (5.1%)
Roads and streets: Glenburne Blvd; W Jolly Rd; Seaway Dr; S Waverly Rd; Sheffield Blvd; Windward Dr; Rivershell Ln; Balmoral Dr; Heathgate Dr; Bayview Dr; Blue River Dr; Woodcreek Ln; Hunters Ridge Dr; Chadburne Dr; Thackin Dr; Roscommon Dr; Courtland Dr; Burneway Dr; Woodbridge Dr; Windemere Dr; Limerick Cir; Lauderhill Cir; Macdougal Cir; Teller Trl; Old Castle Cir; Killarney Ct; Silverbay Ln; Dumfries Cir; Lochinvar Cir.
Roads and streets: S Waverly Rd.
Lansing Eaton neighborhood detailed profile
Area: 0.921 square miles
Population: 891
Population density:
| Lansing Eaton (Lansing-Eaton): | 967 people per square mile |
| Lansing: | 3,191 people per square mile |
Median household income in 2021:
| Lansing Eaton (Lansing-Eaton): | $48,744 |
| Lansing: | $48,818 |
Median rent in in 2021:
| Lansing Eaton (Lansing-Eaton): | $737 |
| Lansing: | $719 |
Male vs Females
| Males: | 351 |
| Females: | 539 |
Median age
| Males: | 33.3 years |
| Females: | 42.3 years |
Housing prices:
Average estimated value of detached houses in 2021 (51.4% of all units):
| Lansing Eaton (Lansing-Eaton): | $260,976 |
| Lansing: | $98,556 |
Average estimated value of townhouses or other attached units in 2021 (25.3% of all units):
| This neighborhood: | $54,533 |
| city: | $168,956 |
Most popular occupations of males: material moving occupations (22.7%); education, training, and library occupations (18.3%); service occupations (10.7%); transportation occupations (8.9%); production occupations (8.4%); business and financial operations occupations (7.5%); farming, fishing, and forestry occupations (7.0%)
Most popular occupations of females: service occupations (42.5%); sales and office occupations (23.3%); material moving occupations (20.5%); management occupations (except farmers) (8.0%); business and financial operations occupations (5.1%)
Roads and streets: Glenburne Blvd; W Jolly Rd; Seaway Dr; S Waverly Rd; Sheffield Blvd; Windward Dr; Rivershell Ln; Balmoral Dr; Heathgate Dr; Bayview Dr; Blue River Dr; Woodcreek Ln; Hunters Ridge Dr; Chadburne Dr; Thackin Dr; Roscommon Dr; Courtland Dr; Burneway Dr; Woodbridge Dr; Windemere Dr; Limerick Cir; Lauderhill Cir; Macdougal Cir; Teller Trl; Old Castle Cir; Killarney Ct; Silverbay Ln; Dumfries Cir; Lochinvar Cir.
Roads and streets: S Waverly Rd.
Lansing Eaton neighborhood detailed profile
Moores Park neighborhood in Lansing statistics: (Find on map)
Area: 0.348 square miles
Population: 1,216
Population density:
Median household income in 2021:
Median rent in in 2021:
Male vs Females
Median age
Average estimated value of detached houses in 2021 (44.7% of all units):
Most popular occupations of males: sales and office occupations (34.8%); service occupations (14.7%); material moving occupations (13.4%); education, training, and library occupations (11.9%); management occupations (except farmers) (7.3%); production occupations (4.9%); computer and mathematical occupations (4.3%)
Most popular occupations of females: service occupations (39.9%); sales and office occupations (15.7%); education, training, and library occupations (14.6%); construction, extraction, and maintenance occupations (11.1%); management occupations (except farmers) (11.0%); production occupations (4.9%); healthcare practitioners and technical occupations (3.6%)
Highways in this neighborhood: S Martin Luther King Jr Blvd (S Logan St, State Hwy 99).
Roads and streets: W Barnes Ave; Moores River Dr; Smith Ave; W Mount Hope Ave; S Washington Ave; Sparrow Ave; Britten Ave; Fletcher St; Beal Ave; Todd Ave; Osband Ave; Davis Ave; Bradley Ave; Stirling Ave; Delevan Ave; Coleman Ave; Woodlawn Ave; Ally Way; S Rundle Ave; Braman St; Pico Ave; Bank St; Reo Ave; Hess Ave; Island Ave; Moores Park School; Alsdorf St; McIntyre Ct.
Railroad features: Conrail RR.
Moores Park neighborhood detailed profile
Area: 0.348 square miles
Population: 1,216
Population density:
| Moores Park: | 3,497 people per square mile |
| Lansing: | 3,191 people per square mile |
Median household income in 2021:
| Moores Park: | $33,813 |
| Lansing: | $48,818 |
Median rent in in 2021:
| Moores Park: | $720 |
| Lansing: | $719 |
Male vs Females
| Males: | 459 |
| Females: | 757 |
Median age
| Males: | 34.9 years |
| Females: | 31.4 years |
Average estimated value of detached houses in 2021 (44.7% of all units):
| Moores Park: | $85,065 |
| Lansing: | $98,556 |
Most popular occupations of males: sales and office occupations (34.8%); service occupations (14.7%); material moving occupations (13.4%); education, training, and library occupations (11.9%); management occupations (except farmers) (7.3%); production occupations (4.9%); computer and mathematical occupations (4.3%)
Most popular occupations of females: service occupations (39.9%); sales and office occupations (15.7%); education, training, and library occupations (14.6%); construction, extraction, and maintenance occupations (11.1%); management occupations (except farmers) (11.0%); production occupations (4.9%); healthcare practitioners and technical occupations (3.6%)
Highways in this neighborhood: S Martin Luther King Jr Blvd (S Logan St, State Hwy 99).
Roads and streets: W Barnes Ave; Moores River Dr; Smith Ave; W Mount Hope Ave; S Washington Ave; Sparrow Ave; Britten Ave; Fletcher St; Beal Ave; Todd Ave; Osband Ave; Davis Ave; Bradley Ave; Stirling Ave; Delevan Ave; Coleman Ave; Woodlawn Ave; Ally Way; S Rundle Ave; Braman St; Pico Ave; Bank St; Reo Ave; Hess Ave; Island Ave; Moores Park School; Alsdorf St; McIntyre Ct.
Railroad features: Conrail RR.
Moores Park neighborhood detailed profile
North Lansing neighborhood in Lansing statistics: (Find on map)
Area: 4.542 square miles
Population: 16,202
Population density:
Median household income in 2021:
Median rent in in 2021:
Male vs Females
Median age
Housing prices:
Average estimated value of detached houses in 2021 (73.5% of all units):
Average estimated value of mobile home in 2021 (2.0% of all units):
Most popular occupations of males: service occupations (13.1%); construction, extraction, and maintenance occupations (11.5%); production occupations (11.5%); material moving occupations (10.6%); transportation occupations (8.1%); computer and mathematical occupations (7.1%); sales and office occupations (6.8%)
Most popular occupations of females: service occupations (33.7%); sales and office occupations (21.6%); education, training, and library occupations (7.1%); healthcare practitioners and technical occupations (6.8%); production occupations (6.8%); management occupations (except farmers) (5.4%); business and financial operations occupations (3.3%)
Roads and streets: E Sheridan Rd (W Sheridan Rd); W Sheridan Rd.
Limited-access highways (interstate or state) in this neighborhood: I- 96 Bus (N Grand River Ave).
Highways in this neighborhood: W Oakland Rd (I- 69 Bus, State Hwy 43); US Hwy 27 Bus (N Larch St).
Roads and streets: Wood St; E Grand River Ave; Turner St; Lake Lansing Rd; N Logan St (N Martin Luther King Jr Blvd); N East St; E Sheridan Rd (W Sheridan Rd); May St; E Paulson St; W Willow St; N High St; Filley St; Creston Ave; E Howe Ave; W Sheridan Rd; N Washington Ave; E Gier St; N Cedar St; N Capitol Ave; E Frederick Ave; E North St; W Maple St; Chilson Ave; E Thomas St; N Chestnut St; Lake Lansing Rd (David St); Massachusetts Ave; W Madison St; Community St; N Walnut St; Porter St; Center St; Vermont Ave; New York Ave; E Harris St; W Fairfield Ave; Whyte St; Ballard St; 7th Ave; Cleveland St; N Pine St; W Kilborn St; W Grand River Ave; Clark St; Douglas Ave; Lansing Ave; Princeton Ave; W Howe Ave; Maryland Ave; Carrier St; Oak St; Seymour Ave; N Grand River Ave; Indiana Ave; W Gier St; W Randolph St; Banghart St; E Maple St; Roosevelt Ave; Gary Ave; Cross St; W Paulson St; Knollwood Ave; Illinois Ave; N Pennsylvania Ave; Terminal Rd; W Frederick Ave; Englewood Ct; Bates St; Mahlon St; Roseneath Ave; Johnson Ave; Call St; Thompson St; Sheridan St; Ohio Ave; Walker St; N Sycamore St; Peppertree Ln; Taft St; Mosley Ave; Hylewood Ave; Barritt St; Schultz St; Benjamin Dr; Farrand Ave; Orchard Glen Ave; Cypress St; W Thomas St; Sadie Ct; Chicago Ave; Wisconsin Ave; Liberty St; Daleford Ave; Ash St; Taylor St; Monroe St; E Randolph St; Christopher St; Seagar St; Felt St; Beaver St; E Jackson St; Edgewood Ct; Summerville Ave; Sheldon St; E Dwight St; W Jackson St; Coolidge Ave (Coolidge St); Russell St; Spikes St; James St; Vance St; Otto St; Prudden St; N Grand Ave; Randall St; Rheamount Ave; E Reasoner St; Ormond St; Sanford Ave; Brook St; Drury Ln; Chamberlain Dr; Riverside Ct; Case St; Marshall St; Garland St; Logan Access Rd; Saginaw Access Rd; Greenwood St; Clinton St; Polly Ave; Daleford St; Grand River Access Rd; Dodge River Dr; Winston Ave; Willis Ct; Cady Ct; Raymond Dr; Josephine Dr; Congress St; Camp St; Mc Kinley St; Culver Ave; Northdale Rd; Hunt Ave; Bluff St; Muskegon Ave; 8th Ave; Pearl St; Persons Ct; Bell St; W Dwight St; Woodbury Ave; N Center St; State St; John St; Adams St; Emerson St; Commonwealth Ave; Leonard Ct; Factory St; Park Ter; E Madison St; E Kilborn St; S Carrier St; Green St; Pleasant St; Edmore St; W Reasoner St; 9th Ave; E Fairfield Ave; Ontario St; Queen St; Wieland St; June St; Lawler Ct; Manchester Ct; Lemrock Ct; Race St; Curtis Ave; Lynwood Cir; Hi Mount Cir; Fernhill Ct; Vine St; Ohio Ave Exn; E Willow St; Hall St; Black Ct; Grand Ct.
Railroad features: Conrail RR; Abandoned RR; Csx RR.
North Lansing neighborhood detailed profile
Area: 4.542 square miles
Population: 16,202
Population density:
| North Lansing (North): | 3,567 people per square mile |
| Lansing: | 3,191 people per square mile |
Median household income in 2021:
| North Lansing (North): | $54,412 |
| Lansing: | $48,818 |
Median rent in in 2021:
| North Lansing (North): | $740 |
| Lansing: | $719 |
Male vs Females
| Males: | 8,154 |
| Females: | 8,047 |
Median age
| Males: | 34.2 years |
| Females: | 34.3 years |
Housing prices:
Average estimated value of detached houses in 2021 (73.5% of all units):
| North Lansing (North): | $76,453 |
| Lansing: | $98,556 |
Average estimated value of mobile home in 2021 (2.0% of all units):
| North Lansing (North): | $22,469 |
| Lansing: | $104,592 |
Most popular occupations of males: service occupations (13.1%); construction, extraction, and maintenance occupations (11.5%); production occupations (11.5%); material moving occupations (10.6%); transportation occupations (8.1%); computer and mathematical occupations (7.1%); sales and office occupations (6.8%)
Most popular occupations of females: service occupations (33.7%); sales and office occupations (21.6%); education, training, and library occupations (7.1%); healthcare practitioners and technical occupations (6.8%); production occupations (6.8%); management occupations (except farmers) (5.4%); business and financial operations occupations (3.3%)
Roads and streets: E Sheridan Rd (W Sheridan Rd); W Sheridan Rd.
Limited-access highways (interstate or state) in this neighborhood: I- 96 Bus (N Grand River Ave).
Highways in this neighborhood: W Oakland Rd (I- 69 Bus, State Hwy 43); US Hwy 27 Bus (N Larch St).
Roads and streets: Wood St; E Grand River Ave; Turner St; Lake Lansing Rd; N Logan St (N Martin Luther King Jr Blvd); N East St; E Sheridan Rd (W Sheridan Rd); May St; E Paulson St; W Willow St; N High St; Filley St; Creston Ave; E Howe Ave; W Sheridan Rd; N Washington Ave; E Gier St; N Cedar St; N Capitol Ave; E Frederick Ave; E North St; W Maple St; Chilson Ave; E Thomas St; N Chestnut St; Lake Lansing Rd (David St); Massachusetts Ave; W Madison St; Community St; N Walnut St; Porter St; Center St; Vermont Ave; New York Ave; E Harris St; W Fairfield Ave; Whyte St; Ballard St; 7th Ave; Cleveland St; N Pine St; W Kilborn St; W Grand River Ave; Clark St; Douglas Ave; Lansing Ave; Princeton Ave; W Howe Ave; Maryland Ave; Carrier St; Oak St; Seymour Ave; N Grand River Ave; Indiana Ave; W Gier St; W Randolph St; Banghart St; E Maple St; Roosevelt Ave; Gary Ave; Cross St; W Paulson St; Knollwood Ave; Illinois Ave; N Pennsylvania Ave; Terminal Rd; W Frederick Ave; Englewood Ct; Bates St; Mahlon St; Roseneath Ave; Johnson Ave; Call St; Thompson St; Sheridan St; Ohio Ave; Walker St; N Sycamore St; Peppertree Ln; Taft St; Mosley Ave; Hylewood Ave; Barritt St; Schultz St; Benjamin Dr; Farrand Ave; Orchard Glen Ave; Cypress St; W Thomas St; Sadie Ct; Chicago Ave; Wisconsin Ave; Liberty St; Daleford Ave; Ash St; Taylor St; Monroe St; E Randolph St; Christopher St; Seagar St; Felt St; Beaver St; E Jackson St; Edgewood Ct; Summerville Ave; Sheldon St; E Dwight St; W Jackson St; Coolidge Ave (Coolidge St); Russell St; Spikes St; James St; Vance St; Otto St; Prudden St; N Grand Ave; Randall St; Rheamount Ave; E Reasoner St; Ormond St; Sanford Ave; Brook St; Drury Ln; Chamberlain Dr; Riverside Ct; Case St; Marshall St; Garland St; Logan Access Rd; Saginaw Access Rd; Greenwood St; Clinton St; Polly Ave; Daleford St; Grand River Access Rd; Dodge River Dr; Winston Ave; Willis Ct; Cady Ct; Raymond Dr; Josephine Dr; Congress St; Camp St; Mc Kinley St; Culver Ave; Northdale Rd; Hunt Ave; Bluff St; Muskegon Ave; 8th Ave; Pearl St; Persons Ct; Bell St; W Dwight St; Woodbury Ave; N Center St; State St; John St; Adams St; Emerson St; Commonwealth Ave; Leonard Ct; Factory St; Park Ter; E Madison St; E Kilborn St; S Carrier St; Green St; Pleasant St; Edmore St; W Reasoner St; 9th Ave; E Fairfield Ave; Ontario St; Queen St; Wieland St; June St; Lawler Ct; Manchester Ct; Lemrock Ct; Race St; Curtis Ave; Lynwood Cir; Hi Mount Cir; Fernhill Ct; Vine St; Ohio Ave Exn; E Willow St; Hall St; Black Ct; Grand Ct.
Railroad features: Conrail RR; Abandoned RR; Csx RR.
North Lansing neighborhood detailed profile
Northtown neighborhood in Lansing statistics: (Find on map)
Area: 1.064 square miles
Population: 6,087
Population density:
Median household income in 2021:
Median rent in in 2021:
Male vs Females
Median age
Average estimated value of detached houses in 2021 (81.8% of all units):
Most popular occupations of males: construction, extraction, and maintenance occupations (22.5%); material moving occupations (14.8%); service occupations (13.9%); production occupations (8.2%); transportation occupations (8.0%); education, training, and library occupations (7.5%); sales and office occupations (6.3%)
Most popular occupations of females: service occupations (49.8%); sales and office occupations (16.6%); healthcare practitioners and technical occupations (10.5%); business and financial operations occupations (6.1%); transportation occupations (4.8%); education, training, and library occupations (3.4%); production occupations (2.4%)
Highways in this neighborhood: E Oakland Ave (I- 69 Bus, State Hwy 43).
Roads and streets: E Grand River Ave; May St; E North St; Massachusetts Ave; Vermont Ave; David St; Whyte St; N High St; Ballard St; New York Ave; Cleveland St; Clark St; Porter St; Maryland Ave; Oak St; N Pennsylvania Ave; Indiana Ave; Illinois Ave; Mahlon St; Johnson Ave; Ohio Ave; Taft St; Farrand Ave; Sheldon St; Prudden St; Otto St; Ormond St; Drury Ln; Case St; Wood St; Marshall St; Cady Ct; Congress St; Saginaw Access Rd; Camp St; Mc Kinley St; Persons Ct; Park Ter; Green St; Wieland St; June St; Quaker Ct; Fernhill Ct; Ohio Ave Exn; Walker St; Sheridan St.
Northtown neighborhood detailed profile
Area: 1.064 square miles
Population: 6,087
Population density:
| Northtown: | 5,719 people per square mile |
| Lansing: | 3,191 people per square mile |
Median household income in 2021:
| Northtown: | $54,272 |
| Lansing: | $48,818 |
Median rent in in 2021:
| Northtown: | $803 |
| Lansing: | $719 |
Male vs Females
| Males: | 2,855 |
| Females: | 3,232 |
Median age
| Males: | 34.8 years |
| Females: | 31.0 years |
Average estimated value of detached houses in 2021 (81.8% of all units):
| Northtown: | $74,045 |
| Lansing: | $98,556 |
Most popular occupations of males: construction, extraction, and maintenance occupations (22.5%); material moving occupations (14.8%); service occupations (13.9%); production occupations (8.2%); transportation occupations (8.0%); education, training, and library occupations (7.5%); sales and office occupations (6.3%)
Most popular occupations of females: service occupations (49.8%); sales and office occupations (16.6%); healthcare practitioners and technical occupations (10.5%); business and financial operations occupations (6.1%); transportation occupations (4.8%); education, training, and library occupations (3.4%); production occupations (2.4%)
Highways in this neighborhood: E Oakland Ave (I- 69 Bus, State Hwy 43).
Roads and streets: E Grand River Ave; May St; E North St; Massachusetts Ave; Vermont Ave; David St; Whyte St; N High St; Ballard St; New York Ave; Cleveland St; Clark St; Porter St; Maryland Ave; Oak St; N Pennsylvania Ave; Indiana Ave; Illinois Ave; Mahlon St; Johnson Ave; Ohio Ave; Taft St; Farrand Ave; Sheldon St; Prudden St; Otto St; Ormond St; Drury Ln; Case St; Wood St; Marshall St; Cady Ct; Congress St; Saginaw Access Rd; Camp St; Mc Kinley St; Persons Ct; Park Ter; Green St; Wieland St; June St; Quaker Ct; Fernhill Ct; Ohio Ave Exn; Walker St; Sheridan St.
Northtown neighborhood detailed profile
Northwest neighborhood in Lansing statistics: (Find on map)
Area: 0.043 square miles
Population: 716
Population density:
Median household income in 2021:
Median rent in in 2021:
Male vs Females
Median age
Average estimated value of detached houses in 2021 (100.0% of all units):
Most popular occupations of males: service occupations (29.0%); sales and office occupations (19.8%); construction, extraction, and maintenance occupations (8.9%); education, training, and library occupations (7.8%); business and financial operations occupations (6.1%); computer and mathematical occupations (5.1%); material moving occupations (5.1%)
Most popular occupations of females: sales and office occupations (45.4%); management occupations (except farmers) (17.5%); service occupations (13.1%); healthcare practitioners and technical occupations (10.5%); business and financial operations occupations (5.7%); education, training, and library occupations (4.4%); life, physical, and social science occupations (3.5%)
Roads and streets: Glenn St; W Willow St; Theodore St; Linwood St; Westmoreland Ave; N Jenison Ave.
Northwest neighborhood detailed profile
Area: 0.043 square miles
Population: 716
Population density:
| Northwest (North West): | 16,499 people per square mile |
| Lansing: | 3,191 people per square mile |
Median household income in 2021:
| Northwest (North West): | $60,610 |
| Lansing: | $48,818 |
Median rent in in 2021:
| Northwest (North West): | $835 |
| Lansing: | $719 |
Male vs Females
| Males: | 326 |
| Females: | 389 |
Median age
| Males: | 31.2 years |
| Females: | 29.2 years |
Average estimated value of detached houses in 2021 (100.0% of all units):
| Northwest (North West): | $82,385 |
| Lansing: | $98,556 |
Most popular occupations of males: service occupations (29.0%); sales and office occupations (19.8%); construction, extraction, and maintenance occupations (8.9%); education, training, and library occupations (7.8%); business and financial operations occupations (6.1%); computer and mathematical occupations (5.1%); material moving occupations (5.1%)
Most popular occupations of females: sales and office occupations (45.4%); management occupations (except farmers) (17.5%); service occupations (13.1%); healthcare practitioners and technical occupations (10.5%); business and financial operations occupations (5.7%); education, training, and library occupations (4.4%); life, physical, and social science occupations (3.5%)
Roads and streets: Glenn St; W Willow St; Theodore St; Linwood St; Westmoreland Ave; N Jenison Ave.
Northwest neighborhood detailed profile
Old Forest neighborhood in Lansing statistics: (Find on map)
Area: 0.325 square miles
Population: 3,251
Population density:
Median household income in 2021:
Median rent in in 2021:
Male vs Females
Median age
Average estimated value of detached houses in 2021 (45.4% of all units):
Most popular occupations of males: computer and mathematical occupations (29.4%); material moving occupations (14.1%); service occupations (11.7%); transportation occupations (10.5%); education, training, and library occupations (9.9%); sales and office occupations (8.8%); production occupations (6.0%)
Most popular occupations of females: service occupations (31.3%); education, training, and library occupations (15.8%); sales and office occupations (14.8%); management occupations (except farmers) (14.6%); transportation occupations (7.2%); production occupations (5.3%); community and social services occupations (3.5%)
Highways in this neighborhood: W Oakland Rd (I- 69 Bus, State Hwy 43).
Roads and streets: W Willow St; N Pine St; N Chestnut St; N Walnut St; W Maple St; Princeton Ave; W Madison St; W Grand River Ave; W Kilborn St; Seymour Ave; Daleford Ave; Englewood Ct; Edgewood Ct; Wisconsin Ave; Chicago Ave; Summerville Ave; N Sycamore St; Brook St; Bluff St; State St; Leonard Ct; N Grand River Ave; Lawler Ct; Daleford St.
Old Forest neighborhood detailed profile
Area: 0.325 square miles
Population: 3,251
Population density:
| Old Forest: | 10,007 people per square mile |
| Lansing: | 3,191 people per square mile |
Median household income in 2021:
| Old Forest: | $39,366 |
| Lansing: | $48,818 |
Median rent in in 2021:
| Old Forest: | $760 |
| Lansing: | $719 |
Male vs Females
| Males: | 1,508 |
| Females: | 1,743 |
Median age
| Males: | 29.4 years |
| Females: | 26.8 years |
Average estimated value of detached houses in 2021 (45.4% of all units):
| Old Forest: | $85,634 |
| Lansing: | $98,556 |
Most popular occupations of males: computer and mathematical occupations (29.4%); material moving occupations (14.1%); service occupations (11.7%); transportation occupations (10.5%); education, training, and library occupations (9.9%); sales and office occupations (8.8%); production occupations (6.0%)
Most popular occupations of females: service occupations (31.3%); education, training, and library occupations (15.8%); sales and office occupations (14.8%); management occupations (except farmers) (14.6%); transportation occupations (7.2%); production occupations (5.3%); community and social services occupations (3.5%)
Highways in this neighborhood: W Oakland Rd (I- 69 Bus, State Hwy 43).
Roads and streets: W Willow St; N Pine St; N Chestnut St; N Walnut St; W Maple St; Princeton Ave; W Madison St; W Grand River Ave; W Kilborn St; Seymour Ave; Daleford Ave; Englewood Ct; Edgewood Ct; Wisconsin Ave; Chicago Ave; Summerville Ave; N Sycamore St; Brook St; Bluff St; State St; Leonard Ct; N Grand River Ave; Lawler Ct; Daleford St.
Old Forest neighborhood detailed profile
Old Oakland neighborhood in Lansing statistics: (Find on map)
Area: 0.067 square miles
Population: 1,109
Population density:
Median household income in 2021:
Median rent in in 2021:
Male vs Females
Median age
Average estimated value of detached houses in 2021 (100.0% of all units):
Most popular occupations of males: service occupations (29.0%); sales and office occupations (19.8%); construction, extraction, and maintenance occupations (8.9%); education, training, and library occupations (7.8%); business and financial operations occupations (6.1%); computer and mathematical occupations (5.1%); material moving occupations (5.1%)
Most popular occupations of females: sales and office occupations (45.4%); management occupations (except farmers) (17.5%); service occupations (13.1%); healthcare practitioners and technical occupations (10.5%); community and social services occupations (7.3%); arts, design, entertainment, sports, and media occupations (6.6%); business and financial operations occupations (5.7%)
Roads and streets: Cleo St; Cawood St; W Maple St; Hyland St; Theodore St; W Willow St; N Verlinden Ave; Durant St.
Old Oakland neighborhood detailed profile
Area: 0.067 square miles
Population: 1,109
Population density:
| Old Oakland: | 16,462 people per square mile |
| Lansing: | 3,191 people per square mile |
Median household income in 2021:
| Old Oakland: | $60,610 |
| Lansing: | $48,818 |
Median rent in in 2021:
| Old Oakland: | $835 |
| Lansing: | $719 |
Male vs Females
| Males: | 505 |
| Females: | 603 |
Median age
| Males: | 31.2 years |
| Females: | 29.2 years |
Average estimated value of detached houses in 2021 (100.0% of all units):
| Old Oakland: | $82,385 |
| Lansing: | $98,556 |
Most popular occupations of males: service occupations (29.0%); sales and office occupations (19.8%); construction, extraction, and maintenance occupations (8.9%); education, training, and library occupations (7.8%); business and financial operations occupations (6.1%); computer and mathematical occupations (5.1%); material moving occupations (5.1%)
Most popular occupations of females: sales and office occupations (45.4%); management occupations (except farmers) (17.5%); service occupations (13.1%); healthcare practitioners and technical occupations (10.5%); community and social services occupations (7.3%); arts, design, entertainment, sports, and media occupations (6.6%); business and financial operations occupations (5.7%)
Roads and streets: Cleo St; Cawood St; W Maple St; Hyland St; Theodore St; W Willow St; N Verlinden Ave; Durant St.
Old Oakland neighborhood detailed profile
PLACE neighborhood in Lansing statistics: (Find on map)
Area: 0.029 square miles
Population: 118
Population density:
Median household income in 2021:
Median rent in in 2021:
Male vs Females
Median age
Average estimated value of detached houses in 2021 (41.8% of all units):
Most popular occupations of males: service occupations (29.2%); sales and office occupations (28.9%); production occupations (24.6%); management occupations (except farmers) (14.3%); farming, fishing, and forestry occupations (10.9%); community and social services occupations (8.0%); construction, extraction, and maintenance occupations (6.2%)
Most popular occupations of females: management occupations (except farmers) (34.8%); material moving occupations (23.7%); business and financial operations occupations (14.9%); arts, design, entertainment, sports, and media occupations (13.5%); service occupations (13.1%); production occupations (13.1%); education, training, and library occupations (11.3%)
Roads and streets: Prospect St; Lathrop St.
PLACE neighborhood detailed profile
Area: 0.029 square miles
Population: 118
Population density:
| PLACE (P.L.A.C.E.): | 4,107 people per square mile |
| Lansing: | 3,191 people per square mile |
Median household income in 2021:
| PLACE (P.L.A.C.E.): | $46,307 |
| Lansing: | $48,818 |
Median rent in in 2021:
| PLACE (P.L.A.C.E.): | $625 |
| Lansing: | $719 |
Male vs Females
| Males: | 64 |
| Females: | 53 |
Median age
| Males: | 28.6 years |
| Females: | 30.0 years |
Average estimated value of detached houses in 2021 (41.8% of all units):
| PLACE (P.L.A.C.E.): | $46,449 |
| Lansing: | $98,556 |
Most popular occupations of males: service occupations (29.2%); sales and office occupations (28.9%); production occupations (24.6%); management occupations (except farmers) (14.3%); farming, fishing, and forestry occupations (10.9%); community and social services occupations (8.0%); construction, extraction, and maintenance occupations (6.2%)
Most popular occupations of females: management occupations (except farmers) (34.8%); material moving occupations (23.7%); business and financial operations occupations (14.9%); arts, design, entertainment, sports, and media occupations (13.5%); service occupations (13.1%); production occupations (13.1%); education, training, and library occupations (11.3%)
Roads and streets: Prospect St; Lathrop St.
PLACE neighborhood detailed profile
Potter-Walsh neighborhood in Lansing statistics: (Find on map)
Area: 0.416 square miles
Roads and streets: Walsh St; Perkins St; E Main St; E Hazel St; S Holmes St; Regent St; Dakin St; Bensch St; Mc Cullough St; S Pennsylvania Ave; Climax St; Leslie St; Gray St; Lathrop St; Haco Dr; Parker St; S Clemens Ave; Shepard St; Mechanic St; Parkview St; Raider St; Allen St; Morgan St; Aurelius Rd.
Railroad features: Amtrak RR (Grand Funk Western RR).
Potter-Walsh neighborhood detailed profile
Quentin Park neighborhood in Lansing statistics: (Find on map)
Area: 0.056 square miles
Roads and streets: Pattengill Ave; Quentin Ave; Berkley Dr; W Barnes Ave.
Quentin Park neighborhood detailed profile
Area: 0.056 square miles
Roads and streets: Pattengill Ave; Quentin Ave; Berkley Dr; W Barnes Ave.
Quentin Park neighborhood detailed profile
REO Town neighborhood in Lansing statistics: (Find on map)
Area: 0.461 square miles
Population: 970
Population density:
Median household income in 2021:
Median rent in in 2021:
Male vs Females
Median age
Average estimated value of detached houses in 2021 (12.0% of all units):
Most popular occupations of males: sales and office occupations (24.3%); material moving occupations (21.0%); management occupations (except farmers) (16.4%); computer and mathematical occupations (9.6%); service occupations (9.5%); education, training, and library occupations (5.8%); arts, design, entertainment, sports, and media occupations (4.9%)
Most popular occupations of females: sales and office occupations (38.6%); education, training, and library occupations (21.8%); management occupations (except farmers) (14.8%); computer and mathematical occupations (8.4%); service occupations (6.4%); arts, design, entertainment, sports, and media occupations (4.9%); material moving occupations (4.2%)
Highways in this neighborhood: S Cedar St (Martin Luther King Jr Blvd, Cedar St, I- 96 Bus).
Roads and streets: S Washington Ave; E Elm St; E South St; W Barnes Ave; Baker St; E Hazel St; Isbell St; Herbert St; E Mount Hope Ave; Todd Ave; River St; Coleman Ave; Norman St; Townsend St; S Grand Ave; Ally Way; W Main St; W Elm St; Platt St; Moores River Dr; Smith Ave; W Mount Hope Ave; Island Ave; Maplewood Ave; Spring St; Bank St; E Barnes Ave; Garden St; Woodlawn Ave; Reo Ave; Wilson St; Nellers Ct; E Main St; Diamond Reo Way; Teel Ave; Clear St; Martin St; Cottage Ave; Gross Ct; W South St; W Hazel St; McIntyre Ct.
Railroad features: Conrail RR; Grand Funk Western RR (Amtrak RR).
REO Town neighborhood detailed profile
Area: 0.461 square miles
Population: 970
Population density:
| REO Town: | 2,105 people per square mile |
| Lansing: | 3,191 people per square mile |
Median household income in 2021:
| REO Town: | $53,954 |
| Lansing: | $48,818 |
Median rent in in 2021:
| REO Town: | $1,001 |
| Lansing: | $719 |
Male vs Females
| Males: | 461 |
| Females: | 509 |
Median age
| Males: | 45.5 years |
| Females: | 49.3 years |
Average estimated value of detached houses in 2021 (12.0% of all units):
| REO Town: | $67,835 |
| Lansing: | $98,556 |
Most popular occupations of males: sales and office occupations (24.3%); material moving occupations (21.0%); management occupations (except farmers) (16.4%); computer and mathematical occupations (9.6%); service occupations (9.5%); education, training, and library occupations (5.8%); arts, design, entertainment, sports, and media occupations (4.9%)
Most popular occupations of females: sales and office occupations (38.6%); education, training, and library occupations (21.8%); management occupations (except farmers) (14.8%); computer and mathematical occupations (8.4%); service occupations (6.4%); arts, design, entertainment, sports, and media occupations (4.9%); material moving occupations (4.2%)
Highways in this neighborhood: S Cedar St (Martin Luther King Jr Blvd, Cedar St, I- 96 Bus).
Roads and streets: S Washington Ave; E Elm St; E South St; W Barnes Ave; Baker St; E Hazel St; Isbell St; Herbert St; E Mount Hope Ave; Todd Ave; River St; Coleman Ave; Norman St; Townsend St; S Grand Ave; Ally Way; W Main St; W Elm St; Platt St; Moores River Dr; Smith Ave; W Mount Hope Ave; Island Ave; Maplewood Ave; Spring St; Bank St; E Barnes Ave; Garden St; Woodlawn Ave; Reo Ave; Wilson St; Nellers Ct; E Main St; Diamond Reo Way; Teel Ave; Clear St; Martin St; Cottage Ave; Gross Ct; W South St; W Hazel St; McIntyre Ct.
Railroad features: Conrail RR; Grand Funk Western RR (Amtrak RR).
REO Town neighborhood detailed profile
Renaissance neighborhood in Lansing statistics: (Find on map)
Area: 0.062 square miles
Roads and streets: S Butler Blvd; S Martin Luther King Jr Blvd (Logan St); W Lenawee St; W Kalamazoo St; W Washtenaw St; W Allegan St; W St Joseph St.
Renaissance neighborhood detailed profile
Area: 0.062 square miles
Roads and streets: S Butler Blvd; S Martin Luther King Jr Blvd (Logan St); W Lenawee St; W Kalamazoo St; W Washtenaw St; W Allegan St; W St Joseph St.
Renaissance neighborhood detailed profile
Riverforest neighborhood in Lansing statistics: (Find on map)
Area: 0.274 square miles
Population: 1,019
Population density:
Median household income in 2021:
Median rent in in 2021:
Male vs Females
Median age
Average estimated value of detached houses in 2021 (98.9% of all units):
Most popular occupations of males: sales and office occupations (23.8%); computer and mathematical occupations (9.4%); construction, extraction, and maintenance occupations (9.4%); management occupations (except farmers) (7.3%); material moving occupations (6.6%); legal occupations (5.8%); architecture and engineering occupations (5.4%)
Most popular occupations of females: sales and office occupations (27.6%); business and financial operations occupations (16.5%); service occupations (14.4%); education, training, and library occupations (11.3%); healthcare practitioners and technical occupations (8.3%); computer and mathematical occupations (8.2%); management occupations (except farmers) (7.9%)
Roads and streets: Cumberland Rd; Arlington Rd; Dillingham Ave; Cogswell Dr; Delta River Dr; Barstow Rd; Westbury Rd; Colchester Rd; Leon Ave; Pembroke Rd; Darby Dr; Tecumseh River Rd; Trent St; Forest Glen Ave; Afton Pl; Northwest Ave; Edgebrook Dr.
Riverforest neighborhood detailed profile
Area: 0.274 square miles
Population: 1,019
Population density:
| Riverforest: | 3,723 people per square mile |
| Lansing: | 3,191 people per square mile |
Median household income in 2021:
| Riverforest: | $69,576 |
| Lansing: | $48,818 |
Median rent in in 2021:
| Riverforest: | $957 |
| Lansing: | $719 |
Male vs Females
| Males: | 491 |
| Females: | 527 |
Median age
| Males: | 33.8 years |
| Females: | 31.2 years |
Average estimated value of detached houses in 2021 (98.9% of all units):
| Riverforest: | $134,620 |
| Lansing: | $98,556 |
Most popular occupations of males: sales and office occupations (23.8%); computer and mathematical occupations (9.4%); construction, extraction, and maintenance occupations (9.4%); management occupations (except farmers) (7.3%); material moving occupations (6.6%); legal occupations (5.8%); architecture and engineering occupations (5.4%)
Most popular occupations of females: sales and office occupations (27.6%); business and financial operations occupations (16.5%); service occupations (14.4%); education, training, and library occupations (11.3%); healthcare practitioners and technical occupations (8.3%); computer and mathematical occupations (8.2%); management occupations (except farmers) (7.9%)
Roads and streets: Cumberland Rd; Arlington Rd; Dillingham Ave; Cogswell Dr; Delta River Dr; Barstow Rd; Westbury Rd; Colchester Rd; Leon Ave; Pembroke Rd; Darby Dr; Tecumseh River Rd; Trent St; Forest Glen Ave; Afton Pl; Northwest Ave; Edgebrook Dr.
Riverforest neighborhood detailed profile
Riverpoint neighborhood in Lansing statistics: (Find on map)
Area: 0.101 square miles
Population: 210
Population density:
Median household income in 2021:
Median rent in in 2021:
Male vs Females
Median age
Most popular occupations of males: sales and office occupations (24.7%); material moving occupations (21.7%); management occupations (except farmers) (16.8%); computer and mathematical occupations (9.9%); service occupations (8.1%); education, training, and library occupations (5.9%); arts, design, entertainment, sports, and media occupations (4.9%)
Most popular occupations of females: sales and office occupations (38.8%); education, training, and library occupations (22.2%); management occupations (except farmers) (15.0%); construction, extraction, and maintenance occupations (11.8%); computer and mathematical occupations (8.6%); production occupations (6.4%); service occupations (5.9%)
Highways in this neighborhood: Martin Luther King Jr Blvd (Cedar St, I- 96 Bus, S Cedar St).
Roads and streets: E South St; S Washington Ave; S Grand Ave; E Elm St; E Hazel St; Platt St; Clear St; Cottage Ave; Gross Ct; W South St; W Hazel St.
Railroad features: Grand Funk Western RR (Amtrak RR); Conrail RR.
Riverpoint neighborhood detailed profile
Area: 0.101 square miles
Population: 210
Population density:
| Riverpoint (River Point): | 2,075 people per square mile |
| Lansing: | 3,191 people per square mile |
Median household income in 2021:
| Riverpoint (River Point): | $32,134 |
| Lansing: | $48,818 |
Median rent in in 2021:
| Riverpoint (River Point): | $743 |
| Lansing: | $719 |
Male vs Females
| Males: | 99 |
| Females: | 110 |
Median age
| Males: | 18.8 years |
| Females: | 30.7 years |
Most popular occupations of males: sales and office occupations (24.7%); material moving occupations (21.7%); management occupations (except farmers) (16.8%); computer and mathematical occupations (9.9%); service occupations (8.1%); education, training, and library occupations (5.9%); arts, design, entertainment, sports, and media occupations (4.9%)
Most popular occupations of females: sales and office occupations (38.8%); education, training, and library occupations (22.2%); management occupations (except farmers) (15.0%); construction, extraction, and maintenance occupations (11.8%); computer and mathematical occupations (8.6%); production occupations (6.4%); service occupations (5.9%)
Highways in this neighborhood: Martin Luther King Jr Blvd (Cedar St, I- 96 Bus, S Cedar St).
Roads and streets: E South St; S Washington Ave; S Grand Ave; E Elm St; E Hazel St; Platt St; Clear St; Cottage Ave; Gross Ct; W South St; W Hazel St.
Railroad features: Grand Funk Western RR (Amtrak RR); Conrail RR.
Riverpoint neighborhood detailed profile
Sagamore Hills neighborhood in Lansing statistics: (Find on map)
Area: 0.032 square miles
Roads and streets: Blair St; Boston Blvd; Pettis St; Abington Pl.
Sagamore Hills neighborhood detailed profile
Area: 0.032 square miles
Roads and streets: Blair St; Boston Blvd; Pettis St; Abington Pl.
Sagamore Hills neighborhood detailed profile
Scottsdale neighborhood in Lansing statistics: (Find on map)
Area: 0.364 square miles
Population: 1,070
Population density:
Median household income in 2021:
Median rent in in 2021:
Male vs Females
Median age
Housing prices:
Average estimated value of detached houses in 2021 (90.0% of all units):
Average estimated value of townhouses or other attached units in 2021 (10.5% of all units):
Most popular occupations of males: transportation occupations (17.3%); material moving occupations (14.2%); production occupations (14.1%); service occupations (13.3%); construction, extraction, and maintenance occupations (11.7%); sales and office occupations (7.4%); education, training, and library occupations (5.2%)
Most popular occupations of females: service occupations (33.9%); sales and office occupations (29.1%); healthcare practitioners and technical occupations (11.0%); business and financial operations occupations (9.9%); material moving occupations (7.0%); production occupations (4.5%); education, training, and library occupations (3.8%)
Roads and streets: S Waverly Rd.
Roads and streets: W Holmes Rd; S Waverly Rd; Inverary Dr; Brisbane Dr; Christine Dr; Norwich Rd; S Deerfield Ave; Ginger Snap Ln; Averill Dr; Sunderland Rd; Sandhurst Dr; Continental Dr; Kilberry Rd; Starlight Ln; Glasgow Dr; Argyll Rd; Lawdor Rd; Malibu Dr; Cardiff Ct; Rice Ct; Rayborn Dr; Shetland Rd; Mersey Ln; Dunlap St.
Scottsdale neighborhood detailed profile
Area: 0.364 square miles
Population: 1,070
Population density:
| Scottsdale: | 2,936 people per square mile |
| Lansing: | 3,191 people per square mile |
Median household income in 2021:
| Scottsdale: | $46,725 |
| Lansing: | $48,818 |
Median rent in in 2021:
| Scottsdale: | $594 |
| Lansing: | $719 |
Male vs Females
| Males: | 443 |
| Females: | 627 |
Median age
| Males: | 29.8 years |
| Females: | 39.5 years |
Housing prices:
Average estimated value of detached houses in 2021 (90.0% of all units):
| Scottsdale: | $117,489 |
| Lansing: | $98,556 |
Average estimated value of townhouses or other attached units in 2021 (10.5% of all units):
| This neighborhood: | $54,533 |
| city: | $168,956 |
Most popular occupations of males: transportation occupations (17.3%); material moving occupations (14.2%); production occupations (14.1%); service occupations (13.3%); construction, extraction, and maintenance occupations (11.7%); sales and office occupations (7.4%); education, training, and library occupations (5.2%)
Most popular occupations of females: service occupations (33.9%); sales and office occupations (29.1%); healthcare practitioners and technical occupations (11.0%); business and financial operations occupations (9.9%); material moving occupations (7.0%); production occupations (4.5%); education, training, and library occupations (3.8%)
Roads and streets: S Waverly Rd.
Roads and streets: W Holmes Rd; S Waverly Rd; Inverary Dr; Brisbane Dr; Christine Dr; Norwich Rd; S Deerfield Ave; Ginger Snap Ln; Averill Dr; Sunderland Rd; Sandhurst Dr; Continental Dr; Kilberry Rd; Starlight Ln; Glasgow Dr; Argyll Rd; Lawdor Rd; Malibu Dr; Cardiff Ct; Rice Ct; Rayborn Dr; Shetland Rd; Mersey Ln; Dunlap St.
Scottsdale neighborhood detailed profile
Shady Oak neighborhood in Lansing statistics: (Find on map)
Area: 0.173 square miles
Population: 495
Population density:
Median household income in 2021:
Median rent in in 2021:
Male vs Females
Median age
Average estimated value of detached houses in 2021 (75.4% of all units):
Most popular occupations of males: service occupations (26.5%); material moving occupations (24.5%); management occupations (except farmers) (16.1%); education, training, and library occupations (6.3%); farming, fishing, and forestry occupations (5.2%); construction, extraction, and maintenance occupations (4.7%); production occupations (4.6%)
Most popular occupations of females: sales and office occupations (25.6%); production occupations (20.8%); business and financial operations occupations (13.3%); material moving occupations (9.5%); management occupations (except farmers) (7.1%); community and social services occupations (6.0%); healthcare practitioners and technical occupations (6.0%)
Limited-access highways (interstate or state) in this neighborhood: N Grand River Ave (I- 96 Bus).
Roads and streets: Downey St; Marquette St; Tecumseh Ave; Greenoak Ave; Westwood Ave; Biltmore Blvd; Windsor St; Mildred St; N Logan St (N Martin Luther King Jr Blvd); Cynwood St; Shady Oak Ln; Hollywood St; Diehm Rd; Stockman Ct.
Railroad features: Csx RR.
Shady Oak neighborhood detailed profile
Area: 0.173 square miles
Population: 495
Population density:
| Shady Oak: | 2,861 people per square mile |
| Lansing: | 3,191 people per square mile |
Median household income in 2021:
| Shady Oak: | $52,195 |
| Lansing: | $48,818 |
Median rent in in 2021:
| Shady Oak: | $649 |
| Lansing: | $719 |
Male vs Females
| Males: | 209 |
| Females: | 285 |
Median age
| Males: | 30.8 years |
| Females: | 32.9 years |
Average estimated value of detached houses in 2021 (75.4% of all units):
| Shady Oak: | $78,990 |
| Lansing: | $98,556 |
Most popular occupations of males: service occupations (26.5%); material moving occupations (24.5%); management occupations (except farmers) (16.1%); education, training, and library occupations (6.3%); farming, fishing, and forestry occupations (5.2%); construction, extraction, and maintenance occupations (4.7%); production occupations (4.6%)
Most popular occupations of females: sales and office occupations (25.6%); production occupations (20.8%); business and financial operations occupations (13.3%); material moving occupations (9.5%); management occupations (except farmers) (7.1%); community and social services occupations (6.0%); healthcare practitioners and technical occupations (6.0%)
Limited-access highways (interstate or state) in this neighborhood: N Grand River Ave (I- 96 Bus).
Roads and streets: Downey St; Marquette St; Tecumseh Ave; Greenoak Ave; Westwood Ave; Biltmore Blvd; Windsor St; Mildred St; N Logan St (N Martin Luther King Jr Blvd); Cynwood St; Shady Oak Ln; Hollywood St; Diehm Rd; Stockman Ct.
Railroad features: Csx RR.
Shady Oak neighborhood detailed profile
Shepard Street neighborhood in Lansing statistics: (Find on map)
Area: 0.030 square miles
Population: 197
Population density:
Median household income in 2021:
Median rent in in 2021:
Male vs Females
Median age
Average estimated value of detached houses in 2021 (64.9% of all units):
Most popular occupations of males: service occupations (26.3%); sales and office occupations (20.0%); production occupations (13.4%); construction, extraction, and maintenance occupations (9.8%); management occupations (except farmers) (9.7%); farming, fishing, and forestry occupations (8.0%); business and financial operations occupations (6.3%)
Most popular occupations of females: sales and office occupations (22.8%); business and financial operations occupations (17.7%); arts, design, entertainment, sports, and media occupations (12.4%); management occupations (except farmers) (11.0%); service occupations (10.0%); material moving occupations (7.4%); healthcare practitioners and technical occupations (6.4%)
Roads and streets: Shepard St.
Shepard Street neighborhood detailed profile
Area: 0.030 square miles
Population: 197
Population density:
| Shepard Street (Shepard St.): | 6,654 people per square mile |
| Lansing: | 3,191 people per square mile |
Median household income in 2021:
| Shepard Street (Shepard St.): | $45,221 |
| Lansing: | $48,818 |
Median rent in in 2021:
| Shepard Street (Shepard St.): | $802 |
| Lansing: | $719 |
Male vs Females
| Males: | 113 |
| Females: | 83 |
Median age
| Males: | 30.5 years |
| Females: | 33.4 years |
Average estimated value of detached houses in 2021 (64.9% of all units):
| Shepard Street (Shepard St.): | $47,707 |
| Lansing: | $98,556 |
Most popular occupations of males: service occupations (26.3%); sales and office occupations (20.0%); production occupations (13.4%); construction, extraction, and maintenance occupations (9.8%); management occupations (except farmers) (9.7%); farming, fishing, and forestry occupations (8.0%); business and financial operations occupations (6.3%)
Most popular occupations of females: sales and office occupations (22.8%); business and financial operations occupations (17.7%); arts, design, entertainment, sports, and media occupations (12.4%); management occupations (except farmers) (11.0%); service occupations (10.0%); material moving occupations (7.4%); healthcare practitioners and technical occupations (6.4%)
Roads and streets: Shepard St.
Shepard Street neighborhood detailed profile
Square One neighborhood in Lansing statistics: (Find on map)
Area: 0.076 square miles
Population: 126
Population density:
Median household income in 2021:
Median rent in in 2021:
Male vs Females
Median age
Average estimated value of detached houses in 2021 (100.0% of all units):
Most popular occupations of males: construction, extraction, and maintenance occupations (34.5%); material moving occupations (29.8%); service occupations (13.9%); life, physical, and social science occupations (7.1%); management occupations (except farmers) (7.0%); sales and office occupations (6.1%); healthcare practitioners and technical occupations (5.6%)
Most popular occupations of females: sales and office occupations (41.5%); service occupations (32.9%); business and financial operations occupations (15.2%); management occupations (except farmers) (9.6%)
Roads and streets: S Hayford Ave; S Magnolia Ave; S Francis Ave; S Foster Ave; Marcus St; E Kalamazoo St; Elizabeth St; Harton St.
Square One neighborhood detailed profile
Area: 0.076 square miles
Population: 126
Population density:
| Square One: | 1,660 people per square mile |
| Lansing: | 3,191 people per square mile |
Median household income in 2021:
| Square One: | $47,967 |
| Lansing: | $48,818 |
Median rent in in 2021:
| Square One: | $718 |
| Lansing: | $719 |
Male vs Females
| Males: | 57 |
| Females: | 68 |
Median age
| Males: | 30.2 years |
| Females: | 34.1 years |
Average estimated value of detached houses in 2021 (100.0% of all units):
| Square One: | $62,097 |
| Lansing: | $98,556 |
Most popular occupations of males: construction, extraction, and maintenance occupations (34.5%); material moving occupations (29.8%); service occupations (13.9%); life, physical, and social science occupations (7.1%); management occupations (except farmers) (7.0%); sales and office occupations (6.1%); healthcare practitioners and technical occupations (5.6%)
Most popular occupations of females: sales and office occupations (41.5%); service occupations (32.9%); business and financial operations occupations (15.2%); management occupations (except farmers) (9.6%)
Roads and streets: S Hayford Ave; S Magnolia Ave; S Francis Ave; S Foster Ave; Marcus St; E Kalamazoo St; Elizabeth St; Harton St.
Square One neighborhood detailed profile
Stadium District neighborhood in Lansing statistics: (Find on map)
Area: 0.342 square miles
Population: 938
Population density:
Median household income in 2021:
Median rent in in 2021:
Male vs Females
Median age
Average estimated value of detached houses in 2021 (30.1% of all units):
Most popular occupations of males: construction, extraction, and maintenance occupations (55.7%); material moving occupations (37.0%); healthcare practitioners and technical occupations (24.3%); service occupations (20.6%); education, training, and library occupations (18.7%); transportation occupations (18.3%); production occupations (16.0%)
Most popular occupations of females: sales and office occupations (36.4%); service occupations (27.3%); education, training, and library occupations (16.9%); healthcare practitioners and technical occupations (11.7%); business and financial operations occupations (7.8%); transportation occupations (6.3%); production occupations (2.5%)
Highways in this neighborhood: US Hwy 27 Bus (S Cedar St, I- 96 Bus); State Hwy 43 (I- 69 Bus, E Saginaw St).
Roads and streets: Museum Dr; E Michigan Ave; E Shiawassee St; Pere Marquette Dr; E Kalamazoo St; Monroe St; Center St; May St; Erie St; Sheridan St; Barnard St; Park Pl; Truck Ct; Manchester Ct; Jay St.
Railroad features: Conrail RR.
Stadium District neighborhood detailed profile
Area: 0.342 square miles
Population: 938
Population density:
| Stadium District: | 2,742 people per square mile |
| Lansing: | 3,191 people per square mile |
Median household income in 2021:
| Stadium District: | $52,708 |
| Lansing: | $48,818 |
Median rent in in 2021:
| Stadium District: | $1,313 |
| Lansing: | $719 |
Male vs Females
| Males: | 560 |
| Females: | 377 |
Median age
| Males: | 31.4 years |
| Females: | 28.7 years |
Average estimated value of detached houses in 2021 (30.1% of all units):
| Stadium District: | $30,294 |
| Lansing: | $98,556 |
Most popular occupations of males: construction, extraction, and maintenance occupations (55.7%); material moving occupations (37.0%); healthcare practitioners and technical occupations (24.3%); service occupations (20.6%); education, training, and library occupations (18.7%); transportation occupations (18.3%); production occupations (16.0%)
Most popular occupations of females: sales and office occupations (36.4%); service occupations (27.3%); education, training, and library occupations (16.9%); healthcare practitioners and technical occupations (11.7%); business and financial operations occupations (7.8%); transportation occupations (6.3%); production occupations (2.5%)
Highways in this neighborhood: US Hwy 27 Bus (S Cedar St, I- 96 Bus); State Hwy 43 (I- 69 Bus, E Saginaw St).
Roads and streets: Museum Dr; E Michigan Ave; E Shiawassee St; Pere Marquette Dr; E Kalamazoo St; Monroe St; Center St; May St; Erie St; Sheridan St; Barnard St; Park Pl; Truck Ct; Manchester Ct; Jay St.
Railroad features: Conrail RR.
Stadium District neighborhood detailed profile
Turner Dodge neighborhood in Lansing statistics: (Find on map)
Area: 0.117 square miles
Population: 312
Population density:
Median household income in 2021:
Median rent in in 2021:
Male vs Females
Median age
Most popular occupations of males: production occupations (32.6%); service occupations (13.1%); sales and office occupations (11.3%); computer and mathematical occupations (6.1%); healthcare practitioners and technical occupations (5.8%); management occupations (except farmers) (4.9%); construction, extraction, and maintenance occupations (3.5%)
Most popular occupations of females: service occupations (23.6%); production occupations (20.5%); sales and office occupations (20.2%); education, training, and library occupations (11.2%); healthcare practitioners and technical occupations (8.9%); farming, fishing, and forestry occupations (5.4%); material moving occupations (3.9%)
Limited-access highways (interstate or state) in this neighborhood: W North St (I- 96 Bus).
Roads and streets: Turner St; N Washington Ave; N Grand River Ave; N Capitol Ave; E Dwight St; James St; E Reasoner St; Dodge River Dr; Josephine Dr; W Dwight St; W Reasoner St; Russell St; Clinton St; Black Ct.
Railroad features: Conrail RR.
Turner Dodge neighborhood detailed profile
Area: 0.117 square miles
Population: 312
Population density:
| Turner Dodge (Turner): | 2,662 people per square mile |
| Lansing: | 3,191 people per square mile |
Median household income in 2021:
| Turner Dodge (Turner): | $42,338 |
| Lansing: | $48,818 |
Median rent in in 2021:
| Turner Dodge (Turner): | $625 |
| Lansing: | $719 |
Male vs Females
| Males: | 171 |
| Females: | 141 |
Median age
| Males: | 39.8 years |
| Females: | 45.3 years |
Most popular occupations of males: production occupations (32.6%); service occupations (13.1%); sales and office occupations (11.3%); computer and mathematical occupations (6.1%); healthcare practitioners and technical occupations (5.8%); management occupations (except farmers) (4.9%); construction, extraction, and maintenance occupations (3.5%)
Most popular occupations of females: service occupations (23.6%); production occupations (20.5%); sales and office occupations (20.2%); education, training, and library occupations (11.2%); healthcare practitioners and technical occupations (8.9%); farming, fishing, and forestry occupations (5.4%); material moving occupations (3.9%)
Limited-access highways (interstate or state) in this neighborhood: W North St (I- 96 Bus).
Roads and streets: Turner St; N Washington Ave; N Grand River Ave; N Capitol Ave; E Dwight St; James St; E Reasoner St; Dodge River Dr; Josephine Dr; W Dwight St; W Reasoner St; Russell St; Clinton St; Black Ct.
Railroad features: Conrail RR.
Turner Dodge neighborhood detailed profile
Walnut neighborhood in Lansing statistics: (Find on map)
Area: 0.325 square miles
Population: 2,202
Population density:
Median household income in 2021:
Median rent in in 2021:
Male vs Females
Median age
Average estimated value of detached houses in 2021 (45.4% of all units):
Most popular occupations of males: computer and mathematical occupations (18.9%); material moving occupations (14.3%); transportation occupations (10.9%); arts, design, entertainment, sports, and media occupations (10.7%); service occupations (10.7%); education, training, and library occupations (8.6%); construction, extraction, and maintenance occupations (5.3%)
Most popular occupations of females: sales and office occupations (26.2%); service occupations (21.4%); education, training, and library occupations (10.7%); management occupations (except farmers) (7.2%); community and social services occupations (6.8%); production occupations (6.5%); transportation occupations (5.2%)
Highways in this neighborhood: State Hwy 43 (W Oakland Rd, I- 69 Bus).
Roads and streets: N Chestnut St; N Walnut St; N Washington Ave; N Capitol Ave; W Kilborn St; W Madison St; W Maple St; W Willow St; W Grand River Ave; Seymour Ave; N Grand River Ave; N Grand Ave; E Grand River Ave; E Madison St; E Kilborn St; Pleasant St; Edmore St; Lawler Ct; E Maple St; E Willow St; Grand Ct.
Walnut neighborhood detailed profile
Area: 0.325 square miles
Population: 2,202
Population density:
| Walnut: | 6,772 people per square mile |
| Lansing: | 3,191 people per square mile |
Median household income in 2021:
| Walnut: | $40,901 |
| Lansing: | $48,818 |
Median rent in in 2021:
| Walnut: | $718 |
| Lansing: | $719 |
Male vs Females
| Males: | 1,008 |
| Females: | 1,194 |
Median age
| Males: | 29.7 years |
| Females: | 30.5 years |
Average estimated value of detached houses in 2021 (45.4% of all units):
| Walnut: | $85,634 |
| Lansing: | $98,556 |
Most popular occupations of males: computer and mathematical occupations (18.9%); material moving occupations (14.3%); transportation occupations (10.9%); arts, design, entertainment, sports, and media occupations (10.7%); service occupations (10.7%); education, training, and library occupations (8.6%); construction, extraction, and maintenance occupations (5.3%)
Most popular occupations of females: sales and office occupations (26.2%); service occupations (21.4%); education, training, and library occupations (10.7%); management occupations (except farmers) (7.2%); community and social services occupations (6.8%); production occupations (6.5%); transportation occupations (5.2%)
Highways in this neighborhood: State Hwy 43 (W Oakland Rd, I- 69 Bus).
Roads and streets: N Chestnut St; N Walnut St; N Washington Ave; N Capitol Ave; W Kilborn St; W Madison St; W Maple St; W Willow St; W Grand River Ave; Seymour Ave; N Grand River Ave; N Grand Ave; E Grand River Ave; E Madison St; E Kilborn St; Pleasant St; Edmore St; Lawler Ct; E Maple St; E Willow St; Grand Ct.
Walnut neighborhood detailed profile
Westside neighborhood in Lansing statistics: (Find on map)
Area: 0.971 square miles
Population: 6,847
Population density:
Median household income in 2021:
Median rent in in 2021:
Male vs Females
Median age
Average estimated value of detached houses in 2021 (91.1% of all units):
Most popular occupations of males: service occupations (20.9%); management occupations (except farmers) (15.2%); computer and mathematical occupations (12.9%); sales and office occupations (9.6%); material moving occupations (9.5%); community and social services occupations (6.9%); arts, design, entertainment, sports, and media occupations (5.7%)
Most popular occupations of females: management occupations (except farmers) (20.9%); service occupations (17.0%); sales and office occupations (15.5%); education, training, and library occupations (11.4%); community and social services occupations (8.4%); arts, design, entertainment, sports, and media occupations (7.5%); healthcare practitioners and technical occupations (6.8%)
Limited-access highways (interstate or state) in this neighborhood: US Hwy 27 Bus (I- 496).
Highways in this neighborhood: S Martin Luther King Jr Blvd (State Hwy 99, S Logan St); State Hwy 43 (I- 69 Bus, W Saginaw St).
Roads and streets: N Genesee Dr; W Kalamazoo St; W Hillsdale St; W St Joseph St; William St; Olds Ave; W Main St; W Lenawee St; W Shiawassee St; W Ottawa St; W Michigan Ave; W Washtenaw St; West St; N Verlinden Ave; S Genesee Dr; Everett Dr; W Allegan St; W Ionia St; Mc Pherson Ave; N Jenison Ave; Osborn Rd; S Jenison Ave; Drexel Rd; Westmoreland Ave; Huron St; Chelsea Ave; Inverness Ave; Carey St; Bartlett St; Forbes St; S Verlinden Ave; N Martin Luther King Jr Blvd (N Logan St); Heather Ln; Spencer St; Riddle St; Bruce Ave; Buffalo St; Lahoma St; Nipp Ave; Durant St; Stanley St; Max Ave; Riverview Ave; Middle St; Kingsley Ct; Memphis St; Howe St; Rulison St; Dinsmore Dr; Church Ct; Fulton Pl; Cawood St; Verlinda Ave; Cleo St; S Martin Luther King Jr Blvd.
Westside neighborhood detailed profile
Area: 0.971 square miles
Population: 6,847
Population density:
| Westside: | 7,053 people per square mile |
| Lansing: | 3,191 people per square mile |
Median household income in 2021:
| Westside: | $51,922 |
| Lansing: | $48,818 |
Median rent in in 2021:
| Westside: | $829 |
| Lansing: | $719 |
Male vs Females
| Males: | 3,582 |
| Females: | 3,264 |
Median age
| Males: | 33.7 years |
| Females: | 38.8 years |
Average estimated value of detached houses in 2021 (91.1% of all units):
| Westside: | $114,884 |
| Lansing: | $98,556 |
Most popular occupations of males: service occupations (20.9%); management occupations (except farmers) (15.2%); computer and mathematical occupations (12.9%); sales and office occupations (9.6%); material moving occupations (9.5%); community and social services occupations (6.9%); arts, design, entertainment, sports, and media occupations (5.7%)
Most popular occupations of females: management occupations (except farmers) (20.9%); service occupations (17.0%); sales and office occupations (15.5%); education, training, and library occupations (11.4%); community and social services occupations (8.4%); arts, design, entertainment, sports, and media occupations (7.5%); healthcare practitioners and technical occupations (6.8%)
Limited-access highways (interstate or state) in this neighborhood: US Hwy 27 Bus (I- 496).
Highways in this neighborhood: S Martin Luther King Jr Blvd (State Hwy 99, S Logan St); State Hwy 43 (I- 69 Bus, W Saginaw St).
Roads and streets: N Genesee Dr; W Kalamazoo St; W Hillsdale St; W St Joseph St; William St; Olds Ave; W Main St; W Lenawee St; W Shiawassee St; W Ottawa St; W Michigan Ave; W Washtenaw St; West St; N Verlinden Ave; S Genesee Dr; Everett Dr; W Allegan St; W Ionia St; Mc Pherson Ave; N Jenison Ave; Osborn Rd; S Jenison Ave; Drexel Rd; Westmoreland Ave; Huron St; Chelsea Ave; Inverness Ave; Carey St; Bartlett St; Forbes St; S Verlinden Ave; N Martin Luther King Jr Blvd (N Logan St); Heather Ln; Spencer St; Riddle St; Bruce Ave; Buffalo St; Lahoma St; Nipp Ave; Durant St; Stanley St; Max Ave; Riverview Ave; Middle St; Kingsley Ct; Memphis St; Howe St; Rulison St; Dinsmore Dr; Church Ct; Fulton Pl; Cawood St; Verlinda Ave; Cleo St; S Martin Luther King Jr Blvd.
Westside neighborhood detailed profile
Wexford Heights neighborhood in Lansing statistics: (Find on map)
Area: 0.235 square miles
Population: 295
Population density:
Median household income in 2021:
Median rent in in 2021:
Male vs Females
Median age
Average estimated value of detached houses in 2021 (58.9% of all units):
Most popular occupations of males: service occupations (27.7%); material moving occupations (22.9%); sales and office occupations (17.4%); construction, extraction, and maintenance occupations (11.7%); education, training, and library occupations (5.2%); transportation occupations (4.4%); computer and mathematical occupations (3.3%)
Most popular occupations of females: service occupations (38.4%); sales and office occupations (32.7%); business and financial operations occupations (12.2%); management occupations (except farmers) (9.8%); education, training, and library occupations (3.8%); community and social services occupations (2.4%)
Roads and streets: S Waverly Rd.
Roads and streets: Nonette Dr; Wise Rd; Swanee Dr; Viola Dr; Penrose Dr; S Waverly Rd; Wexford Rd; Catalpa Dr.
Wexford Heights neighborhood detailed profile
Area: 0.235 square miles
Population: 295
Population density:
| Wexford Heights: | 1,254 people per square mile |
| Lansing: | 3,191 people per square mile |
Median household income in 2021:
| Wexford Heights: | $44,019 |
| Lansing: | $48,818 |
Median rent in in 2021:
| Wexford Heights: | $690 |
| Lansing: | $719 |
Male vs Females
| Males: | 133 |
| Females: | 161 |
Median age
| Males: | 24.9 years |
| Females: | 28.9 years |
Average estimated value of detached houses in 2021 (58.9% of all units):
| Wexford Heights: | $81,096 |
| Lansing: | $98,556 |
Most popular occupations of males: service occupations (27.7%); material moving occupations (22.9%); sales and office occupations (17.4%); construction, extraction, and maintenance occupations (11.7%); education, training, and library occupations (5.2%); transportation occupations (4.4%); computer and mathematical occupations (3.3%)
Most popular occupations of females: service occupations (38.4%); sales and office occupations (32.7%); business and financial operations occupations (12.2%); management occupations (except farmers) (9.8%); education, training, and library occupations (3.8%); community and social services occupations (2.4%)
Roads and streets: S Waverly Rd.
Roads and streets: Nonette Dr; Wise Rd; Swanee Dr; Viola Dr; Penrose Dr; S Waverly Rd; Wexford Rd; Catalpa Dr.
Wexford Heights neighborhood detailed profile
Wood Mere neighborhood in Lansing statistics: (Find on map)
Area: 0.014 square miles
Population: 19
Population density:
Median household income in 2021:
Median rent in in 2021:
Male vs Females
Median age
Housing prices:
Average estimated value of detached houses in 2021 (60.0% of all units):
Average estimated value of townhouses or other attached units in 2021 (10.0% of all units):
Most popular occupations of males: material moving occupations (19.6%); transportation occupations (14.5%); education, training, and library occupations (12.0%); production occupations (11.5%); service occupations (10.5%); construction, extraction, and maintenance occupations (6.9%); sales and office occupations (3.9%)
Most popular occupations of females: service occupations (38.7%); sales and office occupations (25.8%); material moving occupations (14.9%); business and financial operations occupations (7.0%); management occupations (except farmers) (5.3%); healthcare practitioners and technical occupations (4.9%); production occupations (2.2%)
Wood Mere neighborhood detailed profile
Area: 0.014 square miles
Population: 19
Population density:
| Wood Mere: | 1,405 people per square mile |
| Lansing: | 3,191 people per square mile |
Median household income in 2021:
| Wood Mere: | $48,698 |
| Lansing: | $48,818 |
Median rent in in 2021:
| Wood Mere: | $658 |
| Lansing: | $719 |
Male vs Females
| Males: | 7 |
| Females: | 12 |
Median age
| Males: | 28.2 years |
| Females: | 43.6 years |
Housing prices:
Average estimated value of detached houses in 2021 (60.0% of all units):
| Wood Mere: | $168,129 |
| Lansing: | $98,556 |
Average estimated value of townhouses or other attached units in 2021 (10.0% of all units):
| This neighborhood: | $54,533 |
| city: | $168,956 |
Most popular occupations of males: material moving occupations (19.6%); transportation occupations (14.5%); education, training, and library occupations (12.0%); production occupations (11.5%); service occupations (10.5%); construction, extraction, and maintenance occupations (6.9%); sales and office occupations (3.9%)
Most popular occupations of females: service occupations (38.7%); sales and office occupations (25.8%); material moving occupations (14.9%); business and financial operations occupations (7.0%); management occupations (except farmers) (5.3%); healthcare practitioners and technical occupations (4.9%); production occupations (2.2%)
Wood Mere neighborhood detailed profile