Acoma Neighborhood neighborhood in Glendale, Arizona (AZ), 85306 detailed profile
Settings
X


Business Search - 14 Million verified businesses
Area: 0.040 square miles
Population: 317
Population density:
| Acoma Neighborhood: | 7,976 people per square mile |
| Glendale: | 4,528 people per square mile |

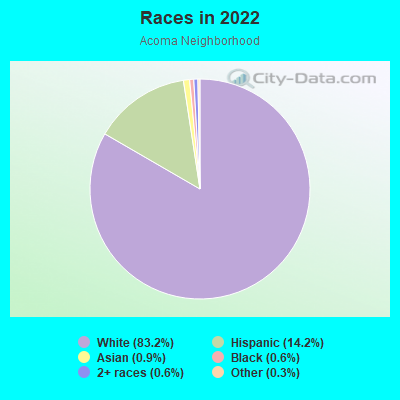
- 26383.2%White
- 4514.2%Hispanic or Latino
- 30.9%Asian
- 20.6%Black
- 20.6%Two or more races
- 10.3%Some other race
Median household income in 2022:
| Acoma Neighborhood: | $42,857 |
| Glendale: | $72,411 |
Distribution of median household income
![Distribution of median household income]()
- 15Less than $10,000
- 14$10,000 to $19,999
- 16$20,000 to $29,999
- 21$30,000 to $39,999
- 42$40,000 to $49,999
- 17$50,000 to $59,999
- 9$60,000 to $74,999
- 5$75,000 to $99,999
- 8$100,000 to $124,999
- 3$125,000 to $149,999
- 7$150,000 to $199,999
- 6$200,000 or more

Distribution of owner-occupied house/condo value
![Distribution of owner-occupied house/condo value]()
- 3Less than $50,000
- 1$50,000 to $99,999
- 9$100,000 to $149,999
- 14$150,000 to $199,999
- 20$200,000 to $249,999
- 19$250,000 to $299,999
- 16$300,000 to $399,999
- 5$400,000 to $499,999
- 2$500,000 to $749,999
- 1$1,000,000 or more

Distribution of rent paid by renters
![Distribution of rent paid by renters]()
- 6$400 to $499
- 5$800 to $899
- 7$900 to $999
- 6$1,000 to $1,249
- 9$1,250 to $1,499
- 3$1,500 to $1,999
- 59$2,000 or more

Median rent in 2022:
| Acoma Neighborhood: | $2,508 |
| Glendale: | $1,244 |
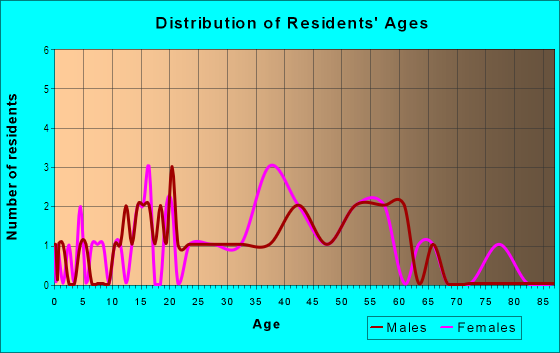
| Males: | 124 |
| Females: | 193 |
Males:
| This neighborhood: | 55.4 years |
| Whole city: | 32.1 years |
| This neighborhood: | 50.6 years |
| Whole city: | 35.7 years |
Average household size:
| Acoma Neighborhood: | 1.9 people |
| Glendale: | 2.8 people |
Percentage of family households:
| Acoma Neighborhood: | 18.2% |
| Glendale: | 49.0% |
| Here: | 14.3% |
| Glendale: | 47.7% |
Percentage of married-couple families with children (among all households):
| Acoma Neighborhood: | 10.0% |
| Glendale: | 24.1% |
Percentage of single-mother households (among all households):
| Acoma Neighborhood: | 17.4% |
| Glendale: | 8.0% |
Percentage of never married males 15 years old and over:
Percentage of never married females 15 years old and over:
| Acoma Neighborhood: | 14.0% |
| Glendale: | 20.8% |
Percentage of never married females 15 years old and over:
| Acoma Neighborhood: | 19.2% |
| city: | 17.2% |
Percentage of people that speak English not well or not at all:
| Acoma Neighborhood: | 4.4% |
| Glendale: | 8.0% |
Percentage of people born in this state:
Percentage of people born in another U.S. state:
Percentage of native residents but born outside the U.S.:
Percentage of foreign born residents:
| Here: | 47.0% |
| Glendale: | 42.8% |
Percentage of people born in another U.S. state:
| Acoma Neighborhood: | 42.6% |
| Glendale: | 38.1% |
Percentage of native residents but born outside the U.S.:
| Here: | 0.2% |
| city: | 0.7% |
Percentage of foreign born residents:
| Here: | 10.2% |
| Glendale: | 18.5% |
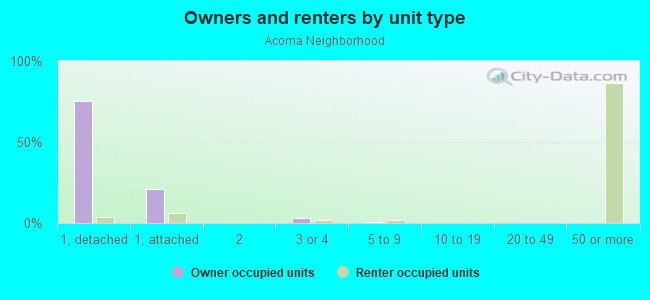
Owner-occupied
Renter-occupied

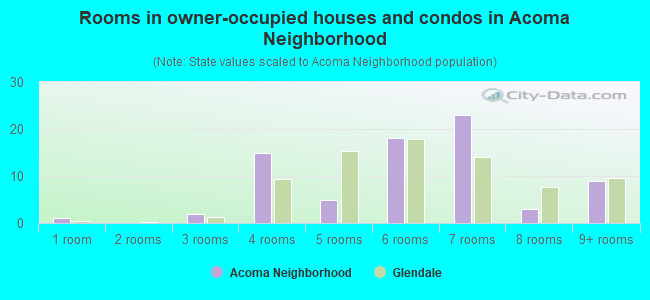
- Rooms in owner-occupied houses and condos in Acoma Neighborhood
- 11 room
- 02 rooms
- 23 rooms
- 154 rooms
- 55 rooms
- 186 rooms
- 237 rooms
- 38 rooms
- 99+ rooms
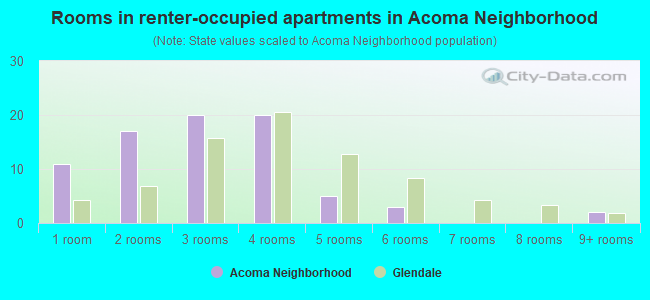
- Rooms in renter-occupied apartments in Acoma Neighborhood
- 111 room
- 172 rooms
- 203 rooms
- 204 rooms
- 55 rooms
- 36 rooms
- 07 rooms
- 08 rooms
- 29+ rooms
Owner-occupied
Renter-occupied
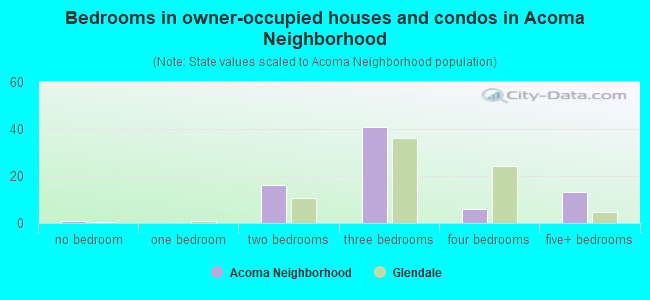
- Bedrooms in owner-occupied houses and condos in Acoma Neighborhood
- 1no bedroom
- 01 bedroom
- 162 bedrooms
- 413 bedrooms
- 64 bedrooms
- 135+ bedrooms
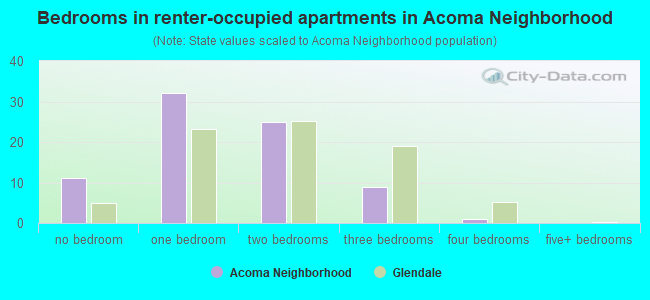
- Bedrooms in renter-occupied apartments in Acoma Neighborhood
- 11no bedroom
- 321 bedroom
- 252 bedrooms
- 93 bedrooms
- 14 bedrooms
- 05+ bedrooms
Average number of cars or other vehicles available in houses/condos:
Average number of cars or other vehicles available in apartments:
| This neighborhood: | 2.1 |
| Glendale: | 2.3 |
Average number of cars or other vehicles available in apartments:
| Here: | 0.6 |
| city: | 1.6 |
Percentage of units with a mortgage:
| Acoma Neighborhood: | 78.8% |
| Glendale: | 65.9% |
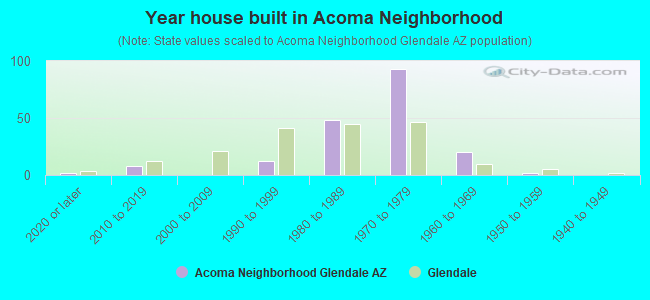
- Year house built in Acoma Neighborhood
- 22020 or later
- 82010 to 2019
- 02000 to 2009
- 121990 to 1999
- 481980 to 1989
- 931970 to 1979
- 201960 to 1969
- 21950 to 1959
- 01940 to 1949
- 01939 or earlier
City-data.com crime index for city in 2020 (higher means more crime):
| City: | 268.2 |
| U.S. average: | 219.5 |
Travel time to work (commute)
![Travel time to work (commute)]()
- 1Less than 5 minutes
- 185 to 9 minutes
- 410 to 14 minutes
- 2415 to 19 minutes
- 2520 to 24 minutes
- 1025 to 29 minutes
- 2530 to 34 minutes
- 935 to 39 minutes
- 640 to 44 minutes
- 1745 to 59 minutes
- 660 to 89 minutes
- 290 or more minutes

Means of transportation to work
![Means of transportation to work]()
- 92.2%106Drove a car alone
- 21.7%25Carpooled
- 3.5%4Bus
- 0.9%1Motorcycle
- 3.5%4Walked
- 7.0%8Worked at home

Time leaving home to go to work
![Time leaving home to go to work]()
- 1112:00 a.m. to 4:59 a.m.
- 135:00 a.m. to 5:29 a.m.
- 75:30 a.m. to 5:59 a.m.
- 96:00 a.m. to 6:29 a.m.
- 136:30 a.m. to 6:59 a.m.
- 167:00 a.m. to 7:29 a.m.
- 127:30 a.m. to 7:59 a.m.
- 108:00 a.m. to 8:29 a.m.
- 168:30 a.m. to 8:59 a.m.
- 129:00 a.m. to 9:59 a.m.
- 210:00 a.m. to 10:59 a.m.
- 1812:00 p.m. to 3:59 p.m.
- 114:00 p.m. to 11:59 p.m.

Occupations of males:
- Percentage of males in management occupations (except farmers):
Here: 19.0% city: 8.8%
- Percentage of males in business and financial operations occupations:
Here: 5.5% city: 3.3%
- Percentage of males in computer and mathematical occupations:
Here: 4.0% city: 3.7%
- Percentage of males in architecture and engineering occupations:
Here: 4.3% city: 2.2%
- Percentage of males in community and social services occupations:
Here: 2.0% city: 1.2%
- Percentage of males in education, training, and library occupations:
Here: 1.5% city: 2.5%
- Percentage of males in healthcare practitioners and technical occupations:
Here: 1.4% city: 3.6%
- Percentage of males in service occupations:
Here: 14.2% city: 15.4%
- Percentage of males in sales and office occupations:
Here: 20.9% city: 17.3%
- Percentage of males in construction, extraction, and maintenance occupations:
Here: 7.1% city: 11.6%
- Percentage of males in production occupations:
Here: 2.0% city: 6.8%
- Percentage of males in transportation occupations:
Here: 4.0% city: 7.3%
- Percentage of males in material moving occupations:
Here: 5.9% city: 6.7%
Occupations of females:
- Percentage of females in management occupations (except farmers):
Here: 15.9% city: 8.1%
- Percentage of females in business and financial operations occupations:
Here: 2.1% city: 6.3%
- Percentage of females in community and social services occupations:
Here: 3.9% city: 2.1%
- Percentage of females in legal occupations:
Here: 1.3% city: 0.8%
- Percentage of females in education, training, and library occupations:
Here: 11.0% city: 7.8%
- Percentage of females in arts, design, entertainment, sports, and media occupations:
Here: 1.8% city: 1.2%
- Percentage of females in healthcare practitioners and technical occupations:
Here: 11.9% city: 7.6%
- Percentage of females in service occupations:
Here: 35.8% city: 22.9%
- Percentage of females in sales and office occupations:
Here: 17.1% city: 31.4%
- Percentage of females in production occupations:
Here: 2.4% city: 3.8%
- Percentage of females in transportation occupations:
Here: 1.8% city: 1.5%
- Percentage of females in material moving occupations:
Here: 1.8% city: 3.5%
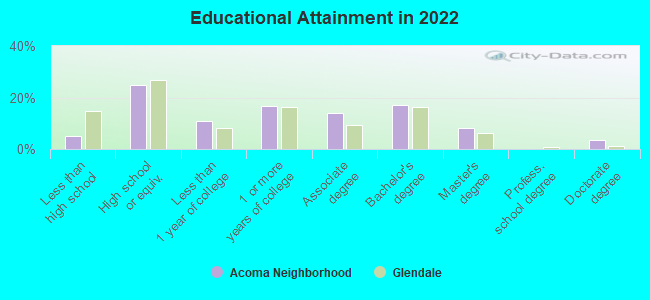
Education in this neighborhood (subdivision or community):
- Percentage of people 3 years and older in K-12 schools:
Acoma Neighborhood: 13.2% Glendale: 17.4%
- Percentage of people 3 years and older in undergraduate colleges:
Acoma Neighborhood: 4.1% Glendale: 5.4%
- Percentage of people 3 years and older in grad. or professional schools:
Acoma Neighborhood: 0.3% Glendale: 1.5%
- Percentage of students K-12 enrolled in private schools:
Acoma Neighborhood: 2.4% Glendale: 8.6%
Percentage of population below poverty level:
| Acoma Neighborhood: | 11.5% |
| Glendale: | 15.0% |
Median year owner moved in (as recorded in 2022):
Median year renter moved in (as recorded in 2022):
| Acoma Neighborhood: | 2012 |
| Glendale: | 2012 |
Median year renter moved in (as recorded in 2022):
| Acoma Neighborhood: | 2018 |
| Glendale: | 2020 |
Percentage of married-couple families with both working:
| Acoma Neighborhood: | 158.5% |
| Glendale: | 55.7% |
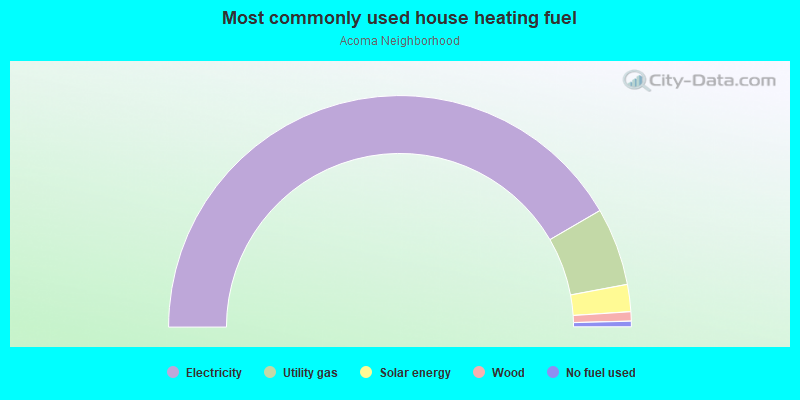
- 83.3%Electricity
- 10.9%Utility gas
- 3.8%Solar energy
- 1.3%Wood
- 0.8%No fuel used
Roads and streets:
W Crocus Dr
Length: 0.27 miles
Direction: E-W
Address range: 5100 to 5266
Direction: E-W
Address range: 5100 to 5266
W Evans Dr
Length: 0.19 miles
Directions: E-W, SE-NW
Address range: 5100 to 5299
Directions: E-W, SE-NW
Address range: 5100 to 5299
N 52nd Ln
Length: 0.12 miles
Direction: N-S
Address range: 14300 to 14499
Direction: N-S
Address range: 14300 to 14499
N 52nd Ave
Length: 0.11 miles
Directions: N-S, SE-NW
Address range: 14300 to 14499
Directions: N-S, SE-NW
Address range: 14300 to 14499
N 51st Ln
Length: 0.11 miles
Direction: N-S
Address range: 14300 to 14499
Direction: N-S
Address range: 14300 to 14499
W Gelding Dr
Length: 0.07 miles
Direction: E-W
Address range: 5100 to 5199
Direction: E-W
Address range: 5100 to 5199
N 52nd Dr
Length: 0.07 miles
Direction: N-S
Address range: 14200 to 14499
Direction: N-S
Address range: 14200 to 14499