Alameda Avenue neighborhood in Denver, Colorado (CO), 80225, 80226 detailed profile
Settings
X


Business Search - 14 Million verified businesses
Area: 0.356 square miles
Population: 1,491
Population density:
| Alameda Avenue: | 4,189 people per square mile |
| Denver: | 4,651 people per square mile |

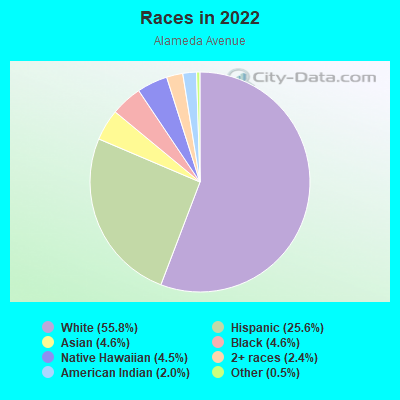
- 94055.8%White
- 43125.6%Hispanic or Latino
- 774.6%Black
- 784.6%Asian
- 754.5%Native Hawaiian and Other
Pacific Islander - 412.4%Two or more races
- 342.0%American Indian
- 90.5%Some other race
Distribution of median household income
![Distribution of median household income]()
- 19Less than $10,000
- 29$10,000 to $19,999
- 85$20,000 to $29,999
- 48$30,000 to $39,999
- 49$40,000 to $49,999
- 46$50,000 to $59,999
- 59$60,000 to $74,999
- 90$75,000 to $99,999
- 84$100,000 to $124,999
- 56$125,000 to $149,999
- 51$150,000 to $199,999
- 60$200,000 or more

Distribution of owner-occupied house/condo value
![Distribution of owner-occupied house/condo value]()
- 22Less than $50,000
- 11$50,000 to $99,999
- 7$100,000 to $149,999
- 15$150,000 to $199,999
- 21$200,000 to $249,999
- 16$250,000 to $299,999
- 76$300,000 to $399,999
- 147$400,000 to $499,999
- 138$500,000 to $749,999
- 26$750,000 to $999,999
- 48$1,000,000 or more

Distribution of rent paid by renters
![Distribution of rent paid by renters]()
- 16$100 to $199
- 13$200 to $299
- 39$300 to $399
- 26$400 to $499
- 97$500 to $599
- 19$600 to $699
- 19$700 to $799
- 17$800 to $899
- 7$900 to $999
- 44$1,000 to $1,249
- 61$1,250 to $1,499
- 42$1,500 to $1,999
- 77$2,000 or more

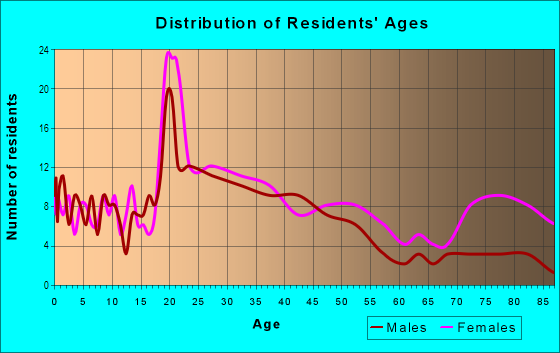
| Males: | 775 |
| Females: | 716 |
Males:
| This neighborhood: | 36.9 years |
| Whole city: | 35.2 years |
| This neighborhood: | 42.4 years |
| Whole city: | 35.1 years |
Average household size:
| Alameda Avenue: | 2.3 people |
| Denver: | 28.0 people |
Percentage of family households:
| Alameda Avenue: | 44.3% |
| Denver: | 35.1% |
| Here: | 45.1% |
| Denver: | 32.5% |
Percentage of married-couple families with children (among all households):
| Alameda Avenue: | 27.3% |
| Denver: | 32.4% |
Percentage of single-mother households (among all households):
| Alameda Avenue: | 12.7% |
| Denver: | 10.3% |
Percentage of never married males 15 years old and over:
Percentage of never married females 15 years old and over:
| Alameda Avenue: | 22.0% |
| Denver: | 25.0% |
Percentage of never married females 15 years old and over:
| Alameda Avenue: | 14.3% |
| city: | 20.8% |
Percentage of people that speak English not well or not at all:
| Alameda Avenue: | 1.7% |
| Denver: | 3.9% |
Percentage of people born in this state:
Percentage of people born in another U.S. state:
Percentage of native residents but born outside the U.S.:
Percentage of foreign born residents:
| Here: | 49.7% |
| Denver: | 38.5% |
Percentage of people born in another U.S. state:
| Alameda Avenue: | 38.1% |
| Denver: | 46.1% |
Percentage of native residents but born outside the U.S.:
| Here: | 1.1% |
| city: | 1.7% |
Percentage of foreign born residents:
| Here: | 11.0% |
| Denver: | 13.8% |
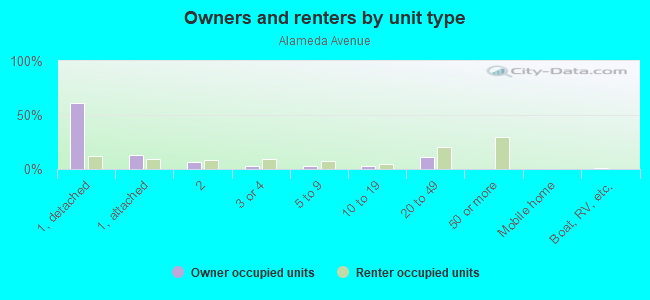
Owner-occupied
Renter-occupied

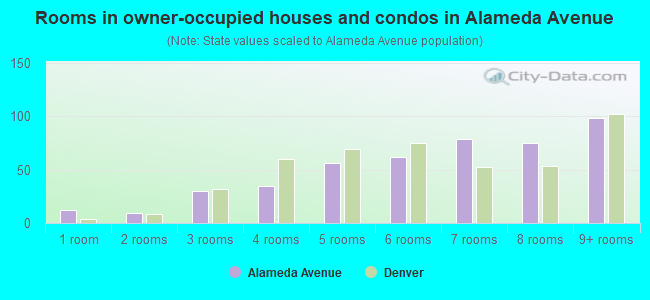
- Rooms in owner-occupied houses and condos in Alameda Avenue
- 121 room
- 92 rooms
- 303 rooms
- 354 rooms
- 565 rooms
- 626 rooms
- 797 rooms
- 758 rooms
- 989+ rooms
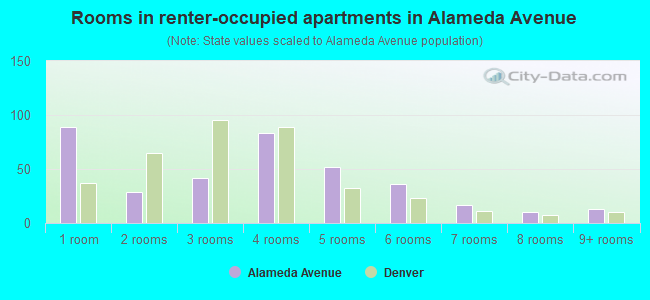
- Rooms in renter-occupied apartments in Alameda Avenue
- 891 room
- 292 rooms
- 423 rooms
- 834 rooms
- 525 rooms
- 366 rooms
- 177 rooms
- 108 rooms
- 139+ rooms
Owner-occupied
Renter-occupied
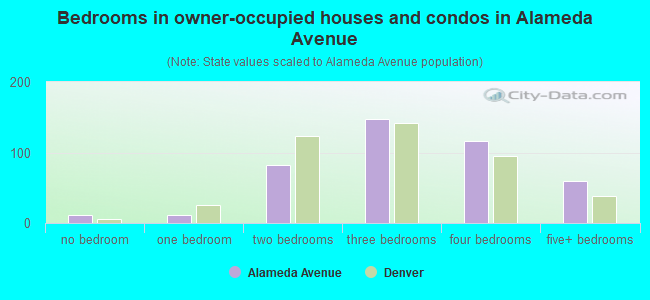
- Bedrooms in owner-occupied houses and condos in Alameda Avenue
- 12no bedroom
- 111 bedroom
- 822 bedrooms
- 1483 bedrooms
- 1164 bedrooms
- 595+ bedrooms
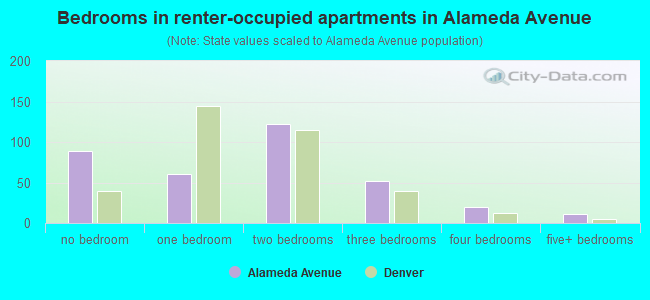
- Bedrooms in renter-occupied apartments in Alameda Avenue
- 89no bedroom
- 611 bedroom
- 1222 bedrooms
- 523 bedrooms
- 204 bedrooms
- 115+ bedrooms
Average number of cars or other vehicles available in houses/condos:
Average number of cars or other vehicles available in apartments:
| This neighborhood: | 2.2 |
| Denver: | 1.9 |
Average number of cars or other vehicles available in apartments:
| Here: | 1.8 |
| city: | 1.3 |
Percentage of units with a mortgage:
| Alameda Avenue: | 70.5% |
| Denver: | 75.6% |
Average estimated value of detached houses in 2022 (63.6% of all units):
| Alameda Avenue: | $514,292 |
| Colorado: | $676,667 |
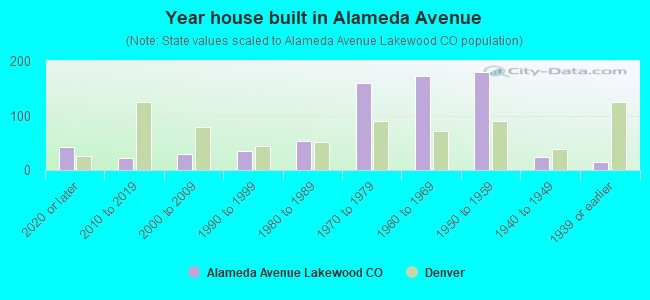
- Year house built in Alameda Avenue
- 432020 or later
- 222010 to 2019
- 302000 to 2009
- 341990 to 1999
- 541980 to 1989
- 1601970 to 1979
- 1731960 to 1969
- 1801950 to 1959
- 241940 to 1949
- 141939 or earlier
City-data.com crime index for city in 2020 (higher means more crime):
| City: | 519.0 |
| U.S. average: | 219.5 |
Travel time to work (commute)
![Travel time to work (commute)]()
- 20Less than 5 minutes
- 495 to 9 minutes
- 6310 to 14 minutes
- 10215 to 19 minutes
- 9820 to 24 minutes
- 4025 to 29 minutes
- 13330 to 34 minutes
- 1635 to 39 minutes
- 1540 to 44 minutes
- 7745 to 59 minutes
- 2260 to 89 minutes
- 990 or more minutes

Means of transportation to work
![Means of transportation to work]()
- 72.2%555Drove a car alone
- 6.6%51Carpooled
- 2.7%21Bus
- 1.4%11Subway or elevated rail
- 1.8%14Long-distance train or commuter rail
- 4.9%38Light rail, streetcar or trolley
- 1.4%11Motorcycle
- 3.4%26Bicycle
- 3.9%30Walked
- 1.6%12Other means
- 16.1%124Worked at home

Time leaving home to go to work
![Time leaving home to go to work]()
- 1712:00 a.m. to 4:59 a.m.
- 295:00 a.m. to 5:29 a.m.
- 435:30 a.m. to 5:59 a.m.
- 526:00 a.m. to 6:29 a.m.
- 516:30 a.m. to 6:59 a.m.
- 1217:00 a.m. to 7:29 a.m.
- 627:30 a.m. to 7:59 a.m.
- 878:00 a.m. to 8:29 a.m.
- 288:30 a.m. to 8:59 a.m.
- 489:00 a.m. to 9:59 a.m.
- 1910:00 a.m. to 10:59 a.m.
- 511:00 a.m. to 11:59 a.m.
- 4912:00 p.m. to 3:59 p.m.
- 404:00 p.m. to 11:59 p.m.

Occupations of males:
- Percentage of males in management occupations (except farmers):
Here: 14.7% city: 15.4%
- Percentage of males in business and financial operations occupations:
Here: 3.8% city: 8.3%
- Percentage of males in computer and mathematical occupations:
Here: 3.2% city: 7.4%
- Percentage of males in architecture and engineering occupations:
Here: 4.4% city: 4.5%
- Percentage of males in life, physical, and social science occupations:
Here: 1.9% city: 1.4%
- Percentage of males in community and social services occupations:
Here: 1.5% city: 0.9%
- Percentage of males in education, training, and library occupations:
Here: 1.9% city: 3.1%
- Percentage of males in arts, design, entertainment, sports, and media occupations:
Here: 1.5% city: 3.1%
- Percentage of males in healthcare practitioners and technical occupations:
Here: 1.8% city: 3.5%
- Percentage of males in service occupations:
Here: 15.1% city: 11.9%
- Percentage of males in sales and office occupations:
Here: 14.6% city: 15.4%
- Percentage of males in farming, fishing, and forestry occupations:
Here: 1.1% city: 0.3%
- Percentage of males in construction, extraction, and maintenance occupations:
Here: 10.8% city: 8.0%
- Percentage of males in production occupations:
Here: 5.7% city: 3.2%
- Percentage of males in transportation occupations:
Here: 7.6% city: 4.2%
- Percentage of males in material moving occupations:
Here: 4.7% city: 3.5%
Occupations of females:
- Percentage of females in management occupations (except farmers):
Here: 9.5% city: 14.0%
- Percentage of females in business and financial operations occupations:
Here: 10.7% city: 10.0%
- Percentage of females in computer and mathematical occupations:
Here: 3.1% city: 2.9%
- Percentage of females in architecture and engineering occupations:
Here: 2.1% city: 1.5%
- Percentage of females in community and social services occupations:
Here: 4.9% city: 3.0%
- Percentage of females in legal occupations:
Here: 1.9% city: 2.4%
- Percentage of females in education, training, and library occupations:
Here: 9.7% city: 7.9%
- Percentage of females in arts, design, entertainment, sports, and media occupations:
Here: 1.4% city: 3.8%
- Percentage of females in healthcare practitioners and technical occupations:
Here: 6.6% city: 10.2%
- Percentage of females in service occupations:
Here: 19.8% city: 16.2%
- Percentage of females in sales and office occupations:
Here: 23.7% city: 21.4%
- Percentage of females in production occupations:
Here: 2.1% city: 1.7%
- Percentage of females in transportation occupations:
Here: 1.7% city: 1.2%
- Percentage of females in material moving occupations:
Here: 1.2% city: 1.4%
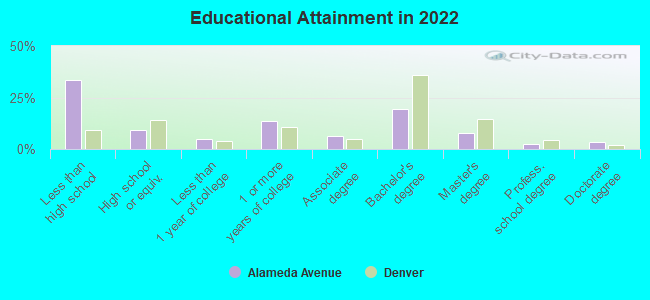
Education in this neighborhood (subdivision or community):
- Percentage of people 3 years and older in K-12 schools:
Alameda Avenue: 19.7% Denver: 12.7%
- Percentage of people 3 years and older in undergraduate colleges:
Alameda Avenue: 9.6% Denver: 4.1%
- Percentage of people 3 years and older in grad. or professional schools:
Alameda Avenue: 5.1% Denver: 2.2%
- Percentage of students K-12 enrolled in private schools:
Alameda Avenue: 2.1% Denver: 11.0%
Percentage of population below poverty level:
| Alameda Avenue: | 6.5% |
| Denver: | 11.8% |
Median year owner moved in (as recorded in 2022):
| Alameda Avenue: | 2009 |
| Denver: | 2014 |
Percentage of married-couple families with both working:
| Alameda Avenue: | 95.9% |
| Denver: | 74.1% |
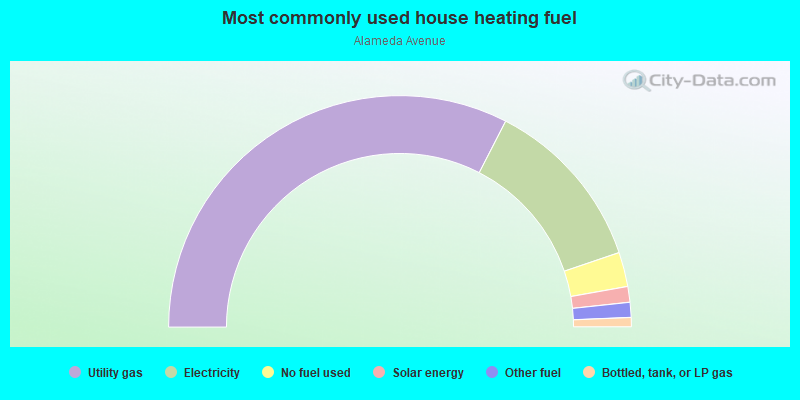
- 65.1%Utility gas
- 24.5%Electricity
- 4.8%No fuel used
- 2.2%Solar energy
- 2.1%Other fuel
- 1.3%Bottled, tank, or LP gas
Highways in this neighborhood:
State Hwy 26 (W Alameda Pkwy)
Length: 1.44 miles
Direction: E-W
Address range: 10000 to 11799
Direction: E-W
Address range: 10000 to 11799
Roads and streets:
W Alameda Ave (W Alameda Frontage Rd)
Length: 4.85 miles
Direction: E-W
Address range: 5200 to 11298
Direction: E-W
Address range: 5200 to 11298
W Alameda Svc Rd
Length: 0.68 miles
Direction: E-W
Address range: 6502 to 9549
Direction: E-W
Address range: 6502 to 9549
W Byers Pl
Length: 0.52 miles
Direction: E-W
Address range: 5400 to 5799
Direction: E-W
Address range: 5400 to 5799
S Garrison St (Co Rd 29)
Length: 0.03 miles
Direction: N-S
Address range: 250 to 299
Direction: N-S
Address range: 250 to 299
S Fenton St
Length: 0.03 miles
Direction: N-S
Address range: 284 to 299
Direction: N-S
Address range: 284 to 299
S Lamar St
Length: 0.03 miles
Direction: N-S
Address range: 300 to 324
Direction: N-S
Address range: 300 to 324
S Pierce St
Length: 0.02 miles
Direction: N-S
Direction: N-S
S Eaton St
Length: 0.02 miles
Direction: N-S
Address range: 277 to 299
Direction: N-S
Address range: 277 to 299
S Benton St
Length: 0.02 miles
Direction: N-S
Address range: 250 to 299
Direction: N-S
Address range: 250 to 299
S Vance St
Length: 0.02 miles
Direction: N-S
Address range: 250 to 299
Direction: N-S
Address range: 250 to 299
S Depew St
Length: 0.02 miles
Direction: N-S
Address range: 280 to 299
Direction: N-S
Address range: 280 to 299
Other features:
Rocky Mountain Ditch
Length: 0.07 miles
Directions: E-W, N-S, SE-NW
Directions: E-W, N-S, SE-NW