Alvin (Burdette) neighborhood in San Jose, California (CA), 95121 detailed profile
Settings
X

Business Search - 14 Million verified businesses
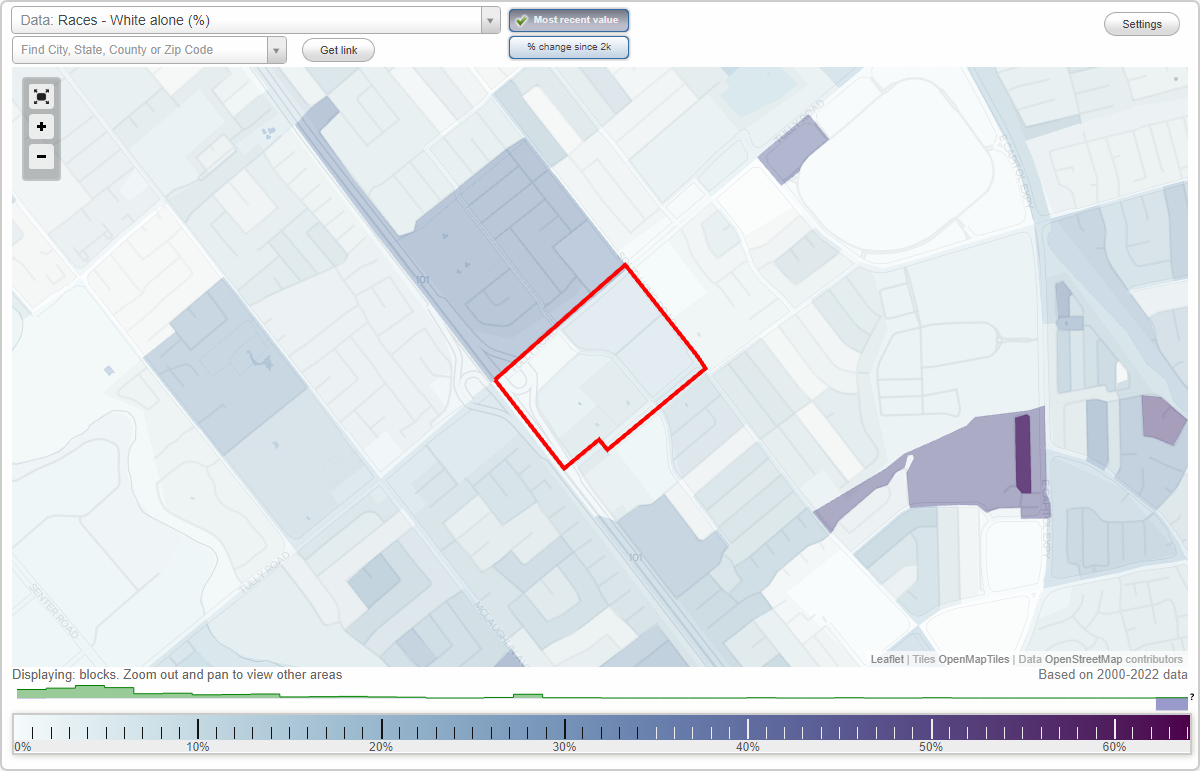
Area: 0.121 square miles
Population: 1,393
Population density:
| Alvin (Burdette): | 11,545 people per square mile |
| San Jose: | 5,554 people per square mile |

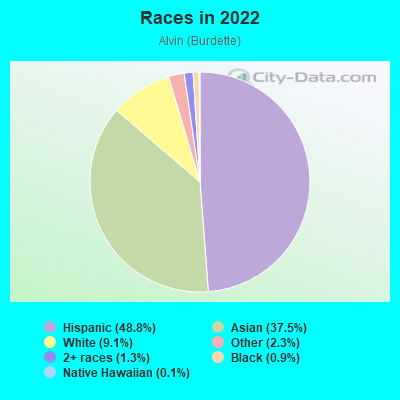
- 67948.8%Hispanic or Latino
- 52137.5%Asian
- 1279.1%White
- 322.3%Some other race
- 181.3%Two or more races
- 120.9%Black
- 20.1%Native Hawaiian and Other
Pacific Islander
Distribution of median household income
![Distribution of median household income]()
- 13Less than $10,000
- 63$10,000 to $19,999
- 45$20,000 to $29,999
- 27$30,000 to $39,999
- 31$40,000 to $49,999
- 35$50,000 to $59,999
- 29$60,000 to $74,999
- 44$75,000 to $99,999
- 14$100,000 to $124,999
- 59$125,000 to $149,999
- 29$150,000 to $199,999
- 24$200,000 or more

Distribution of owner-occupied house/condo value
![Distribution of owner-occupied house/condo value]()
- 27Less than $50,000
- 30$50,000 to $99,999
- 8$100,000 to $149,999
- 3$150,000 to $199,999
- 6$200,000 to $249,999
- 3$250,000 to $299,999
- 8$300,000 to $399,999
- 2$400,000 to $499,999
- 14$500,000 to $749,999
- 24$750,000 to $999,999
- 30$1,000,000 or more

Distribution of rent paid by renters
![Distribution of rent paid by renters]()
- 6$100 to $199
- 30$200 to $299
- 24$300 to $399
- 3$400 to $499
- 33$500 to $599
- 2$600 to $699
- 17$700 to $799
- 7$800 to $899
- 5$900 to $999
- 5$1,000 to $1,249
- 26$1,250 to $1,499
- 81$1,500 to $1,999
- 148$2,000 or more

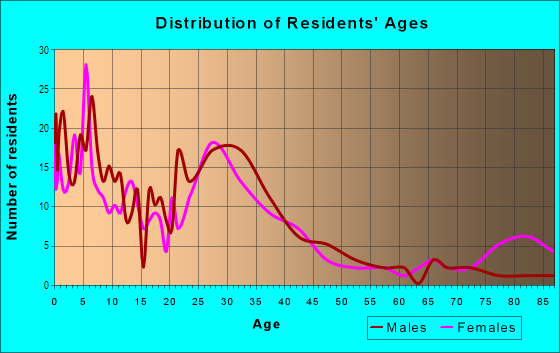
| Males: | 640 |
| Females: | 752 |
Males:
| This neighborhood: | 45.0 years |
| Whole city: | 37.6 years |
| This neighborhood: | 46.0 years |
| Whole city: | 39.1 years |
Average household size:
| Alvin (Burdette): | 3.4 people |
| San Jose: | 2.9 people |
Percentage of family households:
| Alvin (Burdette): | 53.0% |
| San Jose: | 49.9% |
| Here: | 35.7% |
| San Jose: | 53.0% |
Percentage of married-couple families with children (among all households):
| Alvin (Burdette): | 16.9% |
| San Jose: | 25.8% |
Percentage of single-mother households (among all households):
| Alvin (Burdette): | 11.6% |
| San Jose: | 5.2% |
Percentage of never married males 15 years old and over:
Percentage of never married females 15 years old and over:
| Alvin (Burdette): | 15.6% |
| San Jose: | 20.9% |
Percentage of never married females 15 years old and over:
| Alvin (Burdette): | 28.5% |
| city: | 16.7% |
Percentage of people that speak English not well or not at all:
| Alvin (Burdette): | 23.9% |
| San Jose: | 11.4% |
Percentage of people born in this state:
Percentage of people born in another U.S. state:
Percentage of native residents but born outside the U.S.:
Percentage of foreign born residents:
| Here: | 35.6% |
| San Jose: | 46.1% |
Percentage of people born in another U.S. state:
| Alvin (Burdette): | 4.8% |
| San Jose: | 10.4% |
Percentage of native residents but born outside the U.S.:
| Here: | 1.4% |
| city: | 1.7% |
Percentage of foreign born residents:
| Here: | 58.2% |
| San Jose: | 41.8% |
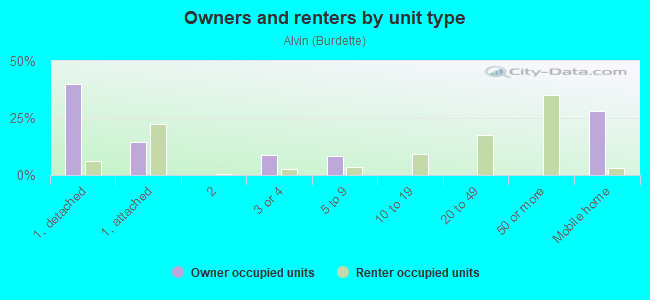
Owner-occupied
Renter-occupied

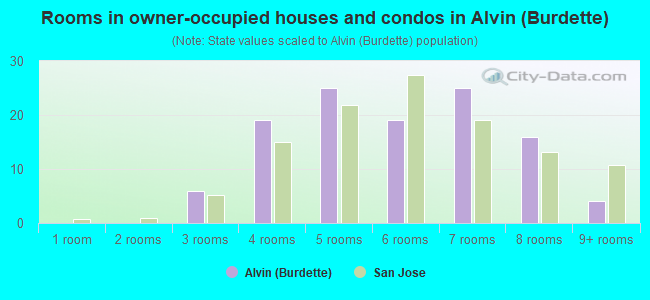
- Rooms in owner-occupied houses and condos in Alvin <
> - 01 room
- 02 rooms
- 63 rooms
- 194 rooms
- 255 rooms
- 196 rooms
- 257 rooms
- 168 rooms
- 49+ rooms
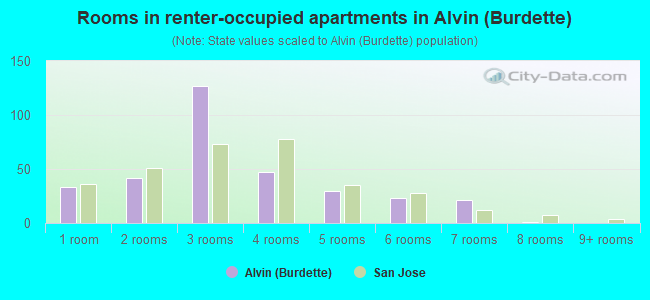
- Rooms in renter-occupied apartments in Alvin <
> - 331 room
- 422 rooms
- 1273 rooms
- 474 rooms
- 305 rooms
- 236 rooms
- 217 rooms
- 18 rooms
- 09+ rooms
Owner-occupied
Renter-occupied

- Bedrooms in owner-occupied houses and condos in Alvin <
> - 0no bedroom
- 01 bedroom
- 142 bedrooms
- 433 bedrooms
- 224 bedrooms
- 55+ bedrooms
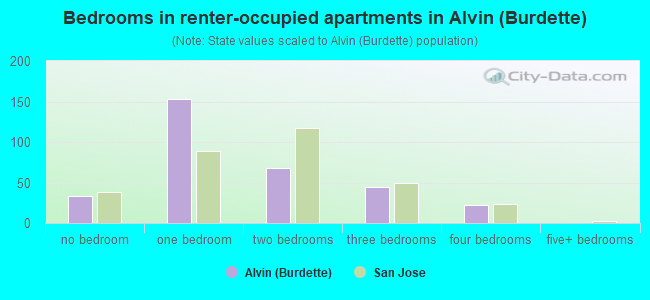
- Bedrooms in renter-occupied apartments in Alvin <
> - 33no bedroom
- 1531 bedroom
- 682 bedrooms
- 443 bedrooms
- 224 bedrooms
- 05+ bedrooms
Average number of cars or other vehicles available in houses/condos:
Average number of cars or other vehicles available in apartments:
| This neighborhood: | 2.1 |
| San Jose: | 2.3 |
Average number of cars or other vehicles available in apartments:
| Here: | 1.4 |
| city: | 1.6 |
Percentage of units with a mortgage:
| Alvin (Burdette): | 49.1% |
| San Jose: | 66.9% |
Average estimated value of detached houses in 2022 (15.6% of all units):
| Alvin (Burdette): | $1,001,221 |
| San Jose: | $1,532,815 |
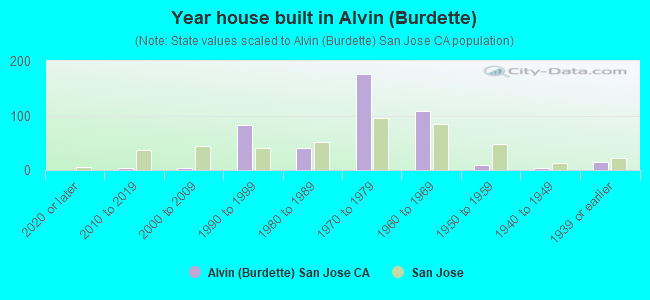
- Year house built in Alvin <
> - 02020 or later
- 32010 to 2019
- 32000 to 2009
- 821990 to 1999
- 401980 to 1989
- 1761970 to 1979
- 1081960 to 1969
- 101950 to 1959
- 41940 to 1949
- 141939 or earlier
City-data.com crime index for city in 2020 (higher means more crime):
| City: | 268.4 |
| U.S. average: | 219.5 |
Travel time to work (commute)
![Travel time to work (commute)]()
- 235 to 9 minutes
- 5110 to 14 minutes
- 12615 to 19 minutes
- 11420 to 24 minutes
- 2325 to 29 minutes
- 9330 to 34 minutes
- 1635 to 39 minutes
- 2040 to 44 minutes
- 3145 to 59 minutes
- 4860 to 89 minutes
- 1190 or more minutes

Means of transportation to work
![Means of transportation to work]()
- 59.6%401Drove a car alone
- 25.1%169Carpooled
- 2.4%16Bus
- 1.0%7Subway or elevated rail
- 0.4%3Light rail, streetcar or trolley
- 0.6%4Taxi
- 1.3%9Walked
- 3.1%21Other means
- 8.0%54Worked at home

Time leaving home to go to work
![Time leaving home to go to work]()
- 2612:00 a.m. to 4:59 a.m.
- 105:00 a.m. to 5:29 a.m.
- 575:30 a.m. to 5:59 a.m.
- 596:00 a.m. to 6:29 a.m.
- 246:30 a.m. to 6:59 a.m.
- 947:00 a.m. to 7:29 a.m.
- 647:30 a.m. to 7:59 a.m.
- 358:00 a.m. to 8:29 a.m.
- 298:30 a.m. to 8:59 a.m.
- 409:00 a.m. to 9:59 a.m.
- 2210:00 a.m. to 10:59 a.m.
- 811:00 a.m. to 11:59 a.m.
- 4512:00 p.m. to 3:59 p.m.
- 834:00 p.m. to 11:59 p.m.

Occupations of males:
- Percentage of males in management occupations (except farmers):
Here: 2.1% city: 13.0%
- Percentage of males in business and financial operations occupations:
Here: 2.0% city: 4.6%
- Percentage of males in computer and mathematical occupations:
Here: 3.0% city: 13.6%
- Percentage of males in architecture and engineering occupations:
Here: 2.9% city: 10.2%
- Percentage of males in community and social services occupations:
Here: 1.3% city: 0.8%
- Percentage of males in arts, design, entertainment, sports, and media occupations:
Here: 1.7% city: 1.8%
- Percentage of males in healthcare practitioners and technical occupations:
Here: 1.7% city: 2.0%
- Percentage of males in service occupations:
Here: 25.9% city: 12.7%
- Percentage of males in sales and office occupations:
Here: 5.8% city: 12.8%
- Percentage of males in farming, fishing, and forestry occupations:
Here: 2.6% city: 0.4%
- Percentage of males in construction, extraction, and maintenance occupations:
Here: 3.6% city: 7.8%
- Percentage of males in production occupations:
Here: 24.8% city: 5.5%
- Percentage of males in transportation occupations:
Here: 6.5% city: 3.6%
- Percentage of males in material moving occupations:
Here: 10.6% city: 3.1%
Occupations of females:
- Percentage of females in management occupations (except farmers):
Here: 3.3% city: 11.0%
- Percentage of females in legal occupations:
Here: 2.1% city: 1.3%
- Percentage of females in education, training, and library occupations:
Here: 1.6% city: 8.1%
- Percentage of females in service occupations:
Here: 62.9% city: 21.7%
- Percentage of females in sales and office occupations:
Here: 24.5% city: 22.0%
- Percentage of females in farming, fishing, and forestry occupations:
Here: 1.5% city: 0.2%
- Percentage of females in production occupations:
Here: 3.7% city: 4.0%
- Percentage of females in transportation occupations:
Here: 1.6% city: 0.7%
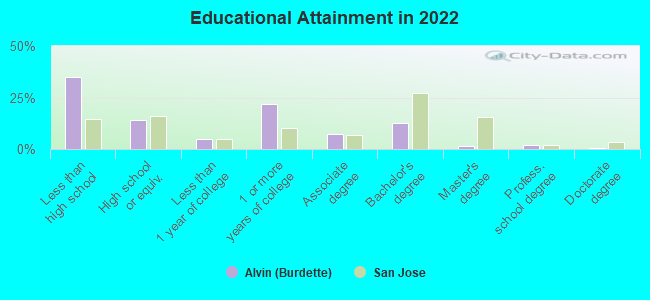
Education in this neighborhood (subdivision or community):
- Percentage of people 3 years and older in K-12 schools:
Alvin (Burdette): 15.9% San Jose: 16.1%
- Percentage of people 3 years and older in undergraduate colleges:
Alvin (Burdette): 9.3% San Jose: 6.5%
- Percentage of people 3 years and older in grad. or professional schools:
Alvin (Burdette): 2.0% San Jose: 2.0%
- Percentage of students K-12 enrolled in private schools:
Alvin (Burdette): 11.9% San Jose: 14.9%
Percentage of population below poverty level:
| Alvin (Burdette): | 12.7% |
| San Jose: | 9.0% |
Median year owner moved in (as recorded in 2022):
Median year renter moved in (as recorded in 2022):
| Alvin (Burdette): | 2005 |
| San Jose: | 2008 |
Median year renter moved in (as recorded in 2022):
| Alvin (Burdette): | 2014 |
| San Jose: | 2020 |
Percentage of married-couple families with both working:
| Alvin (Burdette): | 62.6% |
| San Jose: | 72.5% |
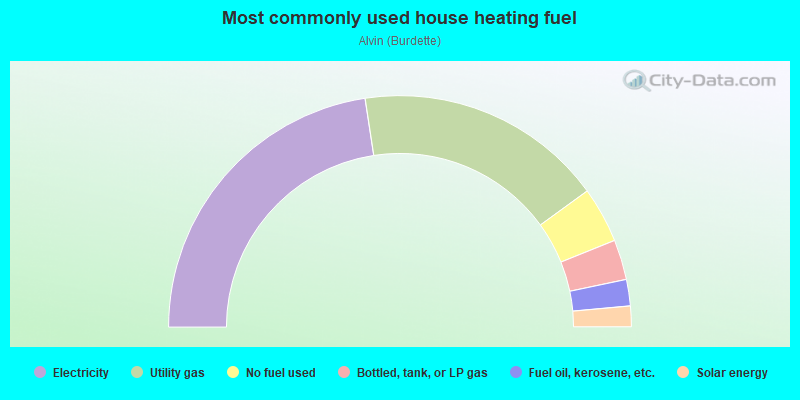
- 45.2%Electricity
- 34.8%Utility gas
- 7.8%No fuel used
- 5.6%Bottled, tank, or LP gas
- 3.7%Fuel oil, kerosene, etc.
- 2.9%Solar energy
Roads and streets:
Alvin Ave
Length: 0.34 miles
Directions: E-W, SE-NW
Address range: 2400 to 2599
Directions: E-W, SE-NW
Address range: 2400 to 2599
S King Rd
Length: 0.31 miles
Direction: SE-NW
Address range: 2400 to 2544
Direction: SE-NW
Address range: 2400 to 2544
Tully Rd
Length: 0.28 miles
Direction: SW-NE
Address range: 1532 to 1699
Direction: SW-NE
Address range: 1532 to 1699
Burdette Dr
Length: 0.18 miles
Direction: SW-NE
Address range: 1600 to 1799
Direction: SW-NE
Address range: 1600 to 1799
Flanigan Dr
Length: 0.17 miles
Direction: SW-NE
Address range: 1592 to 1699
Direction: SW-NE
Address range: 1592 to 1699