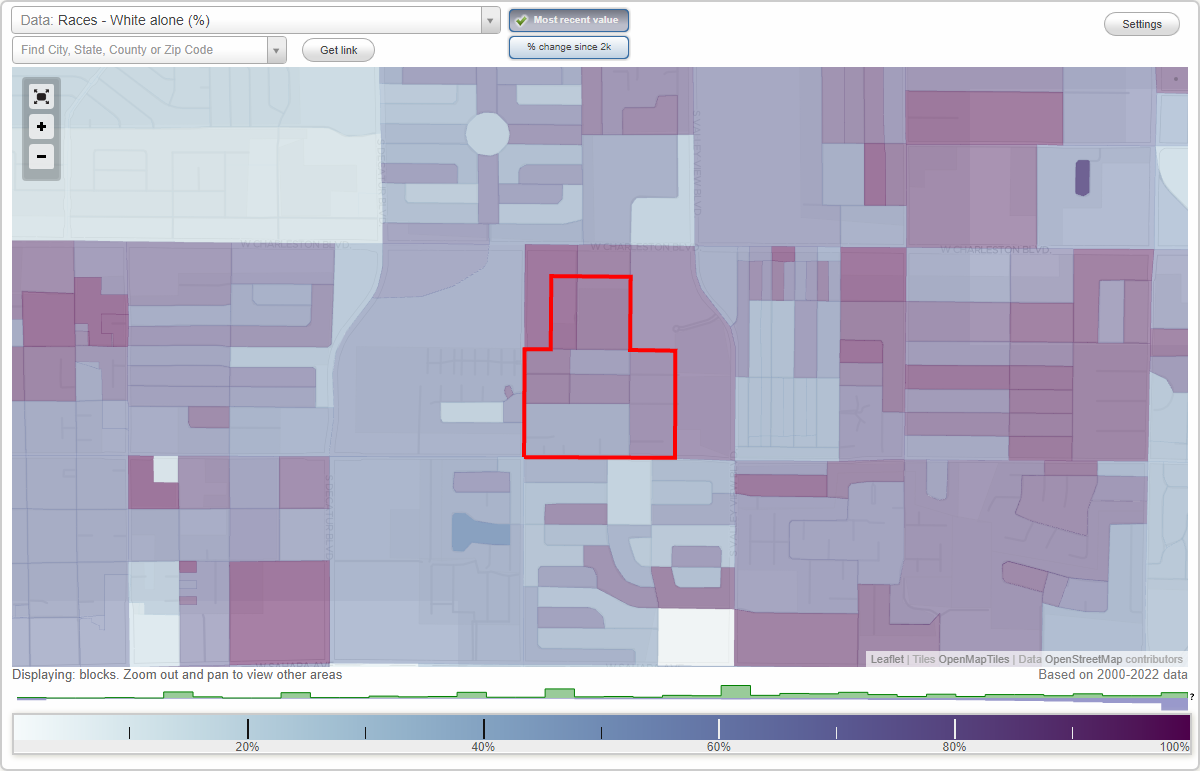
Artesian Heights neighborhood in Las Vegas, Nevada (NV), 89102 detailed profile
Settings
X

Business Search - 14 Million verified businesses
Area: 0.126 square miles
Population: 598
Population density:
| Artesian Heights: | 4,731 people per square mile |
| Las Vegas: | 5,792 people per square mile |

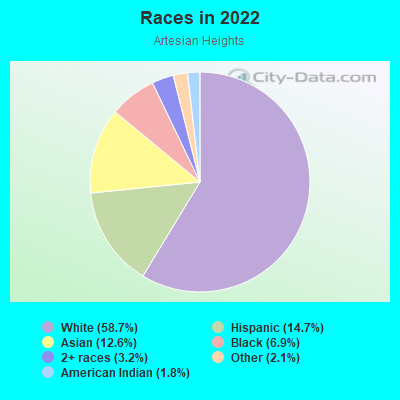
- 36458.7%White
- 9114.7%Hispanic or Latino
- 7812.6%Asian
- 436.9%Black
- 203.2%Two or more races
- 132.1%Some other race
- 111.8%American Indian
Median household income in 2022:
| Artesian Heights: | $62,206 |
| Las Vegas: | $68,905 |
Distribution of median household income
![Distribution of median household income]()
- 16Less than $10,000
- 39$10,000 to $19,999
- 55$20,000 to $29,999
- 59$30,000 to $39,999
- 94$40,000 to $49,999
- 31$50,000 to $59,999
- 35$60,000 to $74,999
- 8$75,000 to $99,999
- 45$100,000 to $124,999
- 37$125,000 to $149,999
- 16$150,000 to $199,999
- 72$200,000 or more

Distribution of owner-occupied house/condo value
![Distribution of owner-occupied house/condo value]()
- 2Less than $50,000
- 10$150,000 to $199,999
- 72$200,000 to $249,999
- 72$250,000 to $299,999
- 102$300,000 to $399,999
- 5$400,000 to $499,999
- 7$500,000 to $749,999
- 13$1,000,000 or more

Distribution of rent paid by renters
![Distribution of rent paid by renters]()
- 2$300 to $399
- 2$500 to $599
- 2$600 to $699
- 10$700 to $799
- 14$800 to $899
- 95$900 to $999
- 155$1,000 to $1,249
- 33$1,250 to $1,499
- 18$2,000 or more

Median rent in 2022:
| Artesian Heights: | $1,078 |
| Las Vegas: | $1,277 |
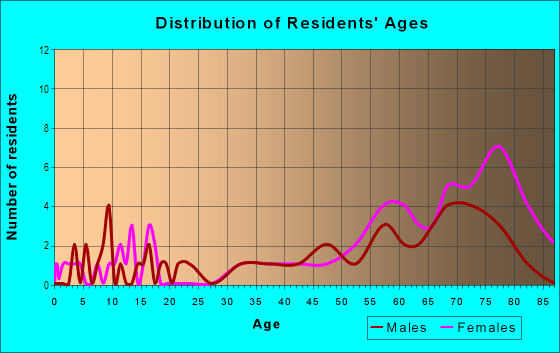
| Males: | 261 |
| Females: | 337 |
Males:
| This neighborhood: | 37.1 years |
| Whole city: | 38.4 years |
| This neighborhood: | 44.4 years |
| Whole city: | 38.9 years |
Average household size:
| Artesian Heights: | 2.2 people |
| Las Vegas: | 2.7 people |
Percentage of family households:
| Artesian Heights: | 9.4% |
| Las Vegas: | 45.8% |
| Here: | 18.3% |
| Las Vegas: | 40.9% |
Percentage of married-couple families with children (among all households):
| Artesian Heights: | 71.1% |
| Las Vegas: | 23.4% |
Percentage of single-mother households (among all households):
| Artesian Heights: | 432.4% |
| Las Vegas: | 10.1% |
Percentage of never married males 15 years old and over:
Percentage of never married females 15 years old and over:
| Artesian Heights: | 9.1% |
| Las Vegas: | 19.7% |
Percentage of never married females 15 years old and over:
| Artesian Heights: | 15.0% |
| city: | 17.0% |
Percentage of people that speak English not well or not at all:
| Artesian Heights: | 1.1% |
| Las Vegas: | 7.0% |
Percentage of people born in this state:
Percentage of people born in another U.S. state:
Percentage of native residents but born outside the U.S.:
Percentage of foreign born residents:
| Here: | 15.9% |
| Las Vegas: | 27.3% |
Percentage of people born in another U.S. state:
| Artesian Heights: | 53.2% |
| Las Vegas: | 49.8% |
Percentage of native residents but born outside the U.S.:
| Here: | 4.6% |
| city: | 1.9% |
Percentage of foreign born residents:
| Here: | 26.3% |
| Las Vegas: | 21.0% |
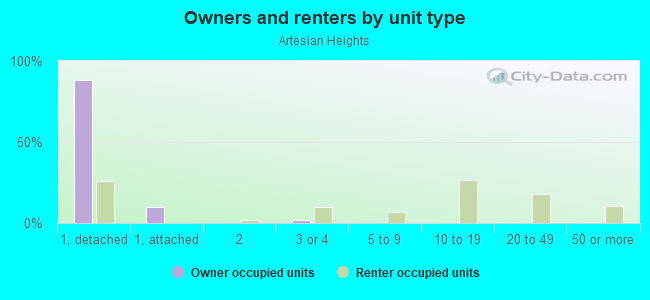
Owner-occupied
Renter-occupied

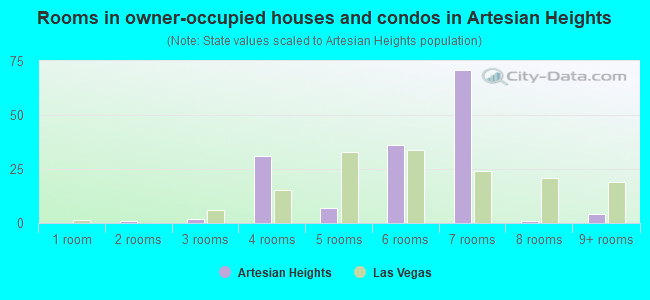
- Rooms in owner-occupied houses and condos in Artesian Heights
- 01 room
- 12 rooms
- 23 rooms
- 314 rooms
- 75 rooms
- 366 rooms
- 717 rooms
- 18 rooms
- 49+ rooms
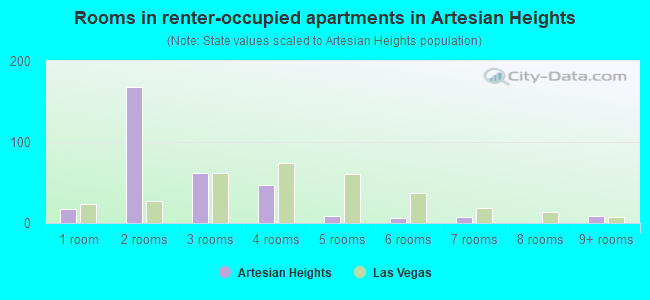
- Rooms in renter-occupied apartments in Artesian Heights
- 171 room
- 1682 rooms
- 623 rooms
- 474 rooms
- 95 rooms
- 66 rooms
- 77 rooms
- 08 rooms
- 99+ rooms
Owner-occupied
Renter-occupied
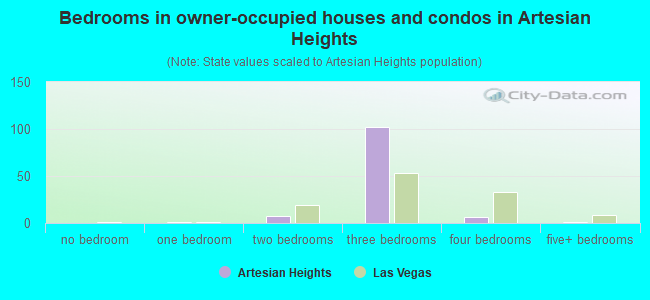
- Bedrooms in owner-occupied houses and condos in Artesian Heights
- 0no bedroom
- 11 bedroom
- 72 bedrooms
- 1023 bedrooms
- 64 bedrooms
- 15+ bedrooms
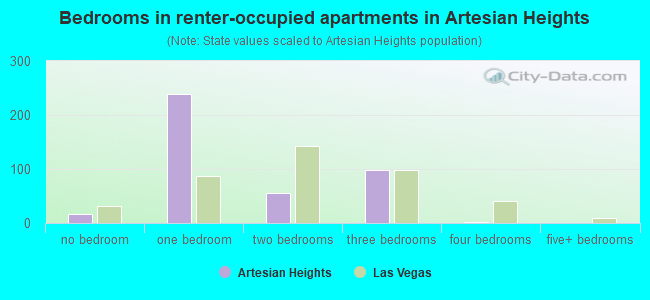
- Bedrooms in renter-occupied apartments in Artesian Heights
- 17no bedroom
- 2391 bedroom
- 562 bedrooms
- 993 bedrooms
- 14 bedrooms
- 05+ bedrooms
Average number of cars or other vehicles available in houses/condos:
Average number of cars or other vehicles available in apartments:
| This neighborhood: | 1.3 |
| Las Vegas: | 2.0 |
Average number of cars or other vehicles available in apartments:
| Here: | 0.7 |
| city: | 1.3 |
Percentage of units with a mortgage:
| Artesian Heights: | 93.6% |
| Las Vegas: | 69.3% |
Average estimated value of detached houses in 2022 (27.1% of all units):
| Artesian Heights: | $377,042 |
| Nevada: | $549,327 |
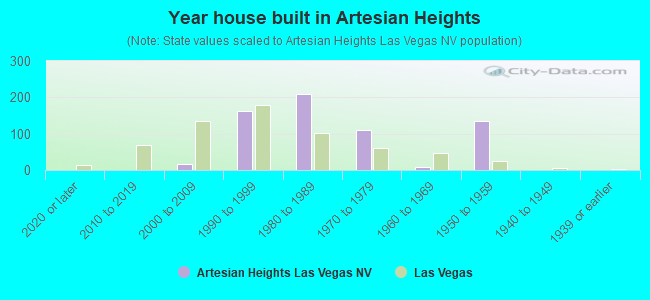
- Year house built in Artesian Heights
- 02020 or later
- 02010 to 2019
- 172000 to 2009
- 1621990 to 1999
- 2101980 to 1989
- 1101970 to 1979
- 81960 to 1969
- 1341950 to 1959
- 01940 to 1949
- 01939 or earlier
City-data.com crime index for city in 2020 (higher means more crime):
| City: | 280.7 |
| U.S. average: | 219.5 |
Travel time to work (commute)
![Travel time to work (commute)]()
- 6Less than 5 minutes
- 375 to 9 minutes
- 3010 to 14 minutes
- 6315 to 19 minutes
- 4520 to 24 minutes
- 3225 to 29 minutes
- 1130 to 34 minutes
- 735 to 39 minutes
- 1140 to 44 minutes
- 545 to 59 minutes
- 260 to 89 minutes
- 290 or more minutes

Means of transportation to work
![Means of transportation to work]()
- 90.5%214Drove a car alone
- 3.0%7Carpooled
- 13.5%32Bus
- 0.4%1Motorcycle
- 2.1%5Walked
- 26.6%63Other means
- 6.8%16Worked at home

Time leaving home to go to work
![Time leaving home to go to work]()
- 1212:00 a.m. to 4:59 a.m.
- 155:00 a.m. to 5:29 a.m.
- 45:30 a.m. to 5:59 a.m.
- 116:00 a.m. to 6:29 a.m.
- 136:30 a.m. to 6:59 a.m.
- 277:00 a.m. to 7:29 a.m.
- 317:30 a.m. to 7:59 a.m.
- 128:00 a.m. to 8:29 a.m.
- 148:30 a.m. to 8:59 a.m.
- 219:00 a.m. to 9:59 a.m.
- 610:00 a.m. to 10:59 a.m.
- 4112:00 p.m. to 3:59 p.m.
- 394:00 p.m. to 11:59 p.m.

Occupations of males:
- Percentage of males in management occupations (except farmers):
Here: 9.1% city: 9.6%
- Percentage of males in computer and mathematical occupations:
Here: 3.9% city: 3.4%
- Percentage of males in architecture and engineering occupations:
Here: 1.8% city: 1.8%
- Percentage of males in education, training, and library occupations:
Here: 2.2% city: 2.5%
- Percentage of males in arts, design, entertainment, sports, and media occupations:
Here: 15.3% city: 2.5%
- Percentage of males in healthcare practitioners and technical occupations:
Here: 4.4% city: 3.3%
- Percentage of males in service occupations:
Here: 47.2% city: 23.3%
- Percentage of males in sales and office occupations:
Here: 37.0% city: 16.6%
Occupations of females:
- Percentage of females in business and financial operations occupations:
Here: 8.6% city: 5.7%
- Percentage of females in computer and mathematical occupations:
Here: 3.8% city: 1.1%
- Percentage of females in legal occupations:
Here: 47.9% city: 1.5%
- Percentage of females in service occupations:
Here: 5.0% city: 26.5%
- Percentage of females in sales and office occupations:
Here: 38.3% city: 30.5%
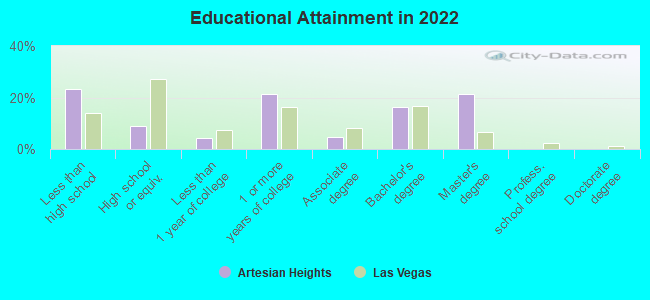
Education in this neighborhood (subdivision or community):
- Percentage of people 3 years and older in K-12 schools:
Artesian Heights: 46.1% Las Vegas: 17.4%
- Percentage of people 3 years and older in undergraduate colleges:
Artesian Heights: 9.1% Las Vegas: 4.2%
- Percentage of people 3 years and older in grad. or professional schools:
Artesian Heights: 0.2% Las Vegas: 1.0%
- Percentage of students K-12 enrolled in private schools:
Artesian Heights: 0.0% Las Vegas: 12.9%
Percentage of population below poverty level:
| Artesian Heights: | 13.8% |
| Las Vegas: | 14.1% |
Median year owner moved in (as recorded in 2022):
Median year renter moved in (as recorded in 2022):
| Artesian Heights: | 2011 |
| Las Vegas: | 2015 |
Median year renter moved in (as recorded in 2022):
| Artesian Heights: | 2016 |
| Las Vegas: | 2020 |
Percentage of married-couple families with both working:
| Artesian Heights: | 155.3% |
| Las Vegas: | 62.0% |
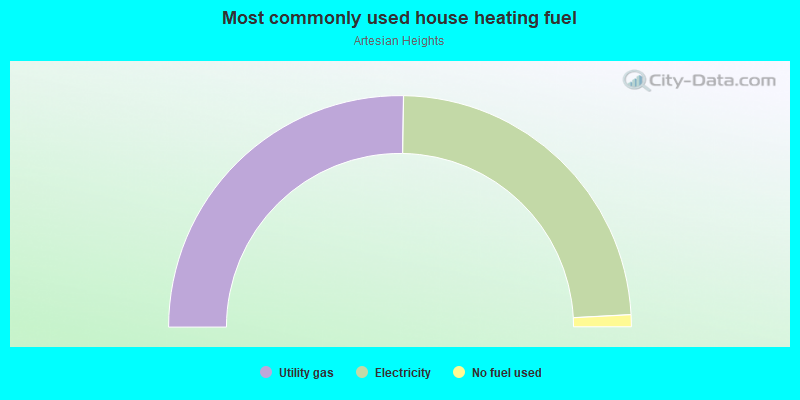
- 50.5%Utility gas
- 47.8%Electricity
- 1.7%No fuel used
Roads and streets:
W Oakey Blvd
Length: 0.32 miles
Direction: E-W
Address range: 3923 to 4215
Direction: E-W
Address range: 3923 to 4215
Hinson St
Length: 0.26 miles
Direction: N-S
Address range: 1400 to 1699
Direction: N-S
Address range: 1400 to 1699
Mountain View Blvd
Length: 0.18 miles
Direction: E-W
Address range: 4100 to 4299
Direction: E-W
Address range: 4100 to 4299
del Monte Ave
Length: 0.18 miles
Direction: E-W
Address range: 4100 to 4199
Direction: E-W
Address range: 4100 to 4199
del Rey Ave
Length: 0.16 miles
Direction: E-W
Address range: 4100 to 4199
Direction: E-W
Address range: 4100 to 4199
Vista Dr
Length: 0.13 miles
Direction: N-S
Address range: 1500 to 1599
Direction: N-S
Address range: 1500 to 1599
Paul Robarts Ct
Length: 0.10 miles
Direction: E-W
Address range: 3900 to 4099
Direction: E-W
Address range: 3900 to 4099
Los Altos Pl
Length: 0.04 miles
Direction: N-S
Address range: 1600 to 1699
Direction: N-S
Address range: 1600 to 1699
Stephen Burnet Ct
Length: 0.02 miles
Direction: N-S
Address range: 1644 to 1661
Direction: N-S
Address range: 1644 to 1661
Van Bryant Ct
Length: 0.02 miles
Direction: N-S
Address range: 1600 to 1699
Direction: N-S
Address range: 1600 to 1699
Bossart Ct
Length: 0.01 miles
Direction: SW-NE
Address range: 4201 to 4211
Direction: SW-NE
Address range: 4201 to 4211