Bannister Acres neighborhood in Kansas City, Missouri (MO), 64134 detailed profile
Settings
X

Business Search - 14 Million verified businesses
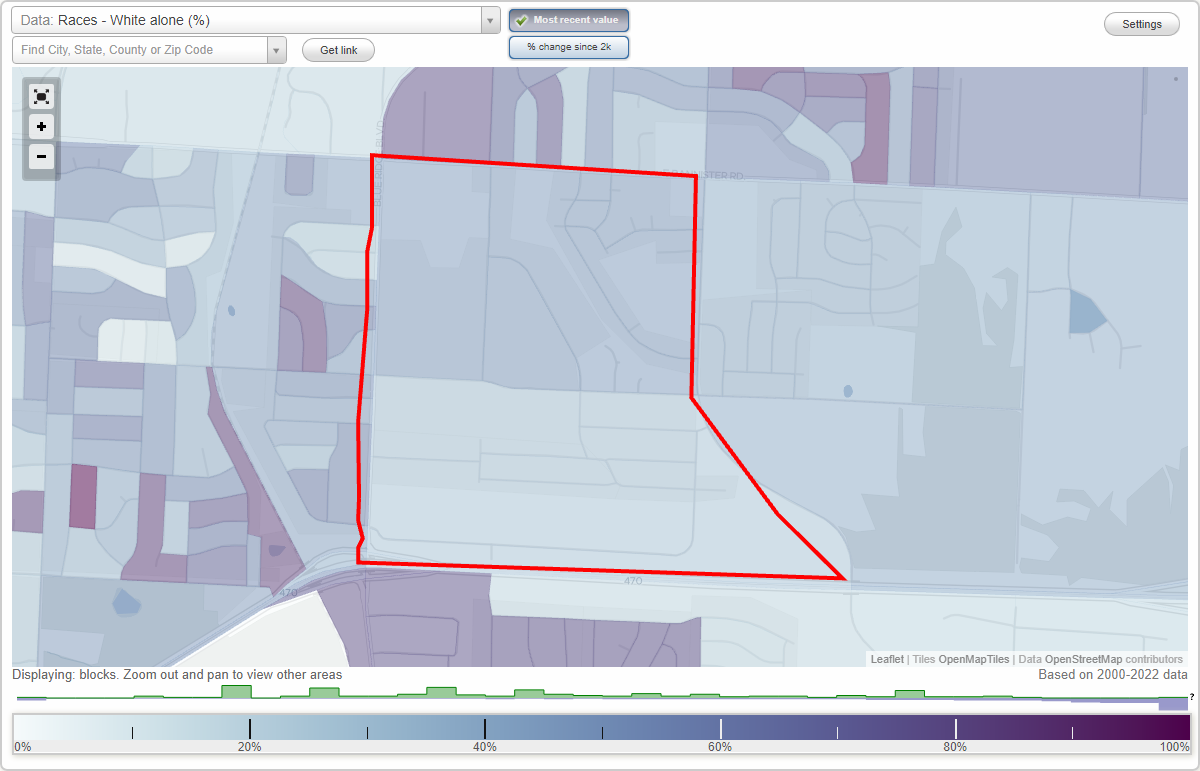
Area: 0.769 square miles
Population: 3,315
Population density:
| Bannister Acres: | 4,310 people per square mile |
| Kansas City: | 1,624 people per square mile |

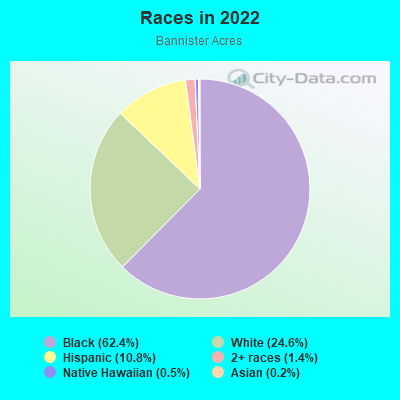
- 2,08562.4%Black
- 82324.6%White
- 35910.8%Hispanic or Latino
- 481.4%Two or more races
- 180.5%Native Hawaiian and Other
Pacific Islander - 60.2%Asian
Distribution of median household income
![Distribution of median household income]()
- 146Less than $10,000
- 133$10,000 to $19,999
- 134$20,000 to $29,999
- 250$30,000 to $39,999
- 156$40,000 to $49,999
- 96$50,000 to $59,999
- 257$60,000 to $74,999
- 293$75,000 to $99,999
- 133$100,000 to $124,999
- 76$125,000 to $149,999
- 244$150,000 to $199,999
- 61$200,000 or more

Distribution of owner-occupied house/condo value
![Distribution of owner-occupied house/condo value]()
- 73Less than $50,000
- 284$50,000 to $99,999
- 166$100,000 to $149,999
- 529$150,000 to $199,999
- 121$200,000 to $249,999
- 22$250,000 to $299,999
- 37$400,000 to $499,999
- 22$500,000 to $749,999

Distribution of rent paid by renters
![Distribution of rent paid by renters]()
- 4$300 to $399
- 43$400 to $499
- 16$500 to $599
- 178$600 to $699
- 81$700 to $799
- 118$800 to $899
- 123$900 to $999
- 302$1,000 to $1,249
- 185$1,250 to $1,499
- 11$1,500 to $1,999

Median rent in 2022:
| Bannister Acres: | $1,026 |
| Kansas City: | $959 |
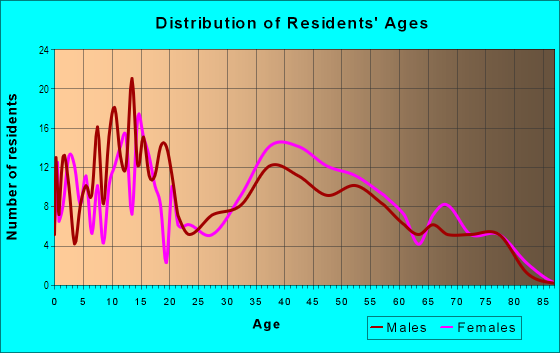
| Males: | 1,553 |
| Females: | 1,762 |
Males:
| This neighborhood: | 31.2 years |
| Whole city: | 35.3 years |
| This neighborhood: | 38.0 years |
| Whole city: | 36.6 years |
Average household size:
| Bannister Acres: | 2.4 people |
| Kansas City: | 2.2 people |
Percentage of family households:
| Bannister Acres: | 35.4% |
| Kansas City: | 37.9% |
| Here: | 28.2% |
| Kansas City: | 35.0% |
Percentage of married-couple families with children (among all households):
| Bannister Acres: | 26.0% |
| Kansas City: | 26.7% |
Percentage of single-mother households (among all households):
| Bannister Acres: | 26.7% |
| Kansas City: | 14.3% |
Percentage of never married males 15 years old and over:
Percentage of never married females 15 years old and over:
| Bannister Acres: | 14.3% |
| Kansas City: | 20.0% |
Percentage of never married females 15 years old and over:
| Bannister Acres: | 23.6% |
| city: | 20.0% |
Percentage of people that speak English not well or not at all:
| Bannister Acres: | 2.0% |
| Kansas City: | 2.5% |
Percentage of people born in this state:
Percentage of people born in another U.S. state:
Percentage of native residents but born outside the U.S.:
Percentage of foreign born residents:
| Here: | 69.0% |
| Kansas City: | 53.2% |
Percentage of people born in another U.S. state:
| Bannister Acres: | 26.7% |
| Kansas City: | 38.2% |
Percentage of native residents but born outside the U.S.:
| Here: | 0.5% |
| city: | 1.0% |
Percentage of foreign born residents:
| Here: | 3.8% |
| Kansas City: | 7.6% |
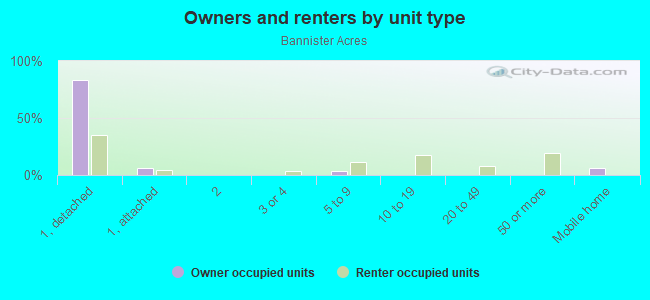
Owner-occupied
Renter-occupied

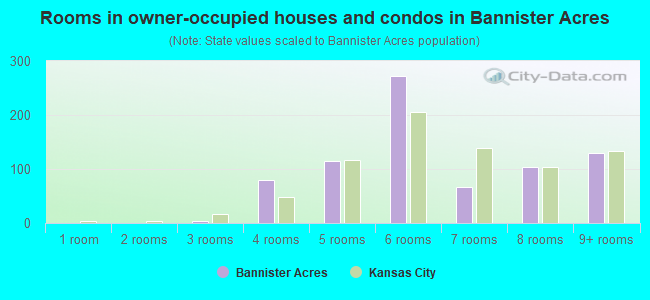
- Rooms in owner-occupied houses and condos in Bannister Acres
- 01 room
- 02 rooms
- 43 rooms
- 804 rooms
- 1145 rooms
- 2726 rooms
- 677 rooms
- 1048 rooms
- 1299+ rooms
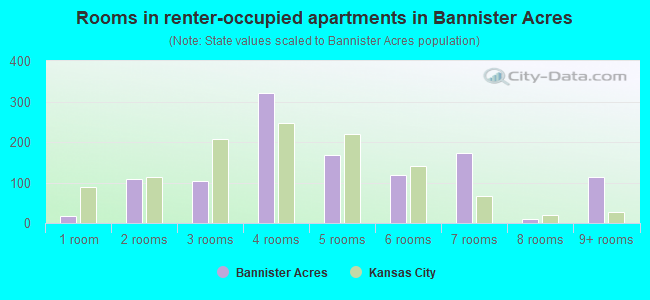
- Rooms in renter-occupied apartments in Bannister Acres
- 171 room
- 1082 rooms
- 1043 rooms
- 3214 rooms
- 1685 rooms
- 1196 rooms
- 1727 rooms
- 108 rooms
- 1139+ rooms
Owner-occupied
Renter-occupied
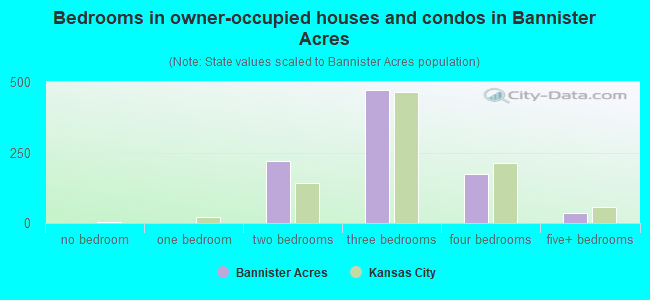
- Bedrooms in owner-occupied houses and condos in Bannister Acres
- 0no bedroom
- 01 bedroom
- 2192 bedrooms
- 4713 bedrooms
- 1744 bedrooms
- 365+ bedrooms
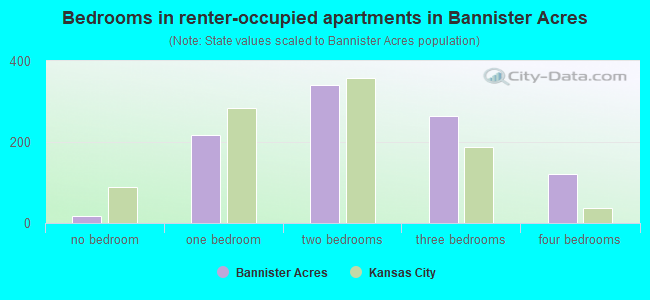
- Bedrooms in renter-occupied apartments in Bannister Acres
- 17no bedroom
- 2171 bedroom
- 3412 bedrooms
- 2643 bedrooms
- 1204 bedrooms
- 05+ bedrooms
Average number of cars or other vehicles available in houses/condos:
Average number of cars or other vehicles available in apartments:
| This neighborhood: | 1.9 |
| Kansas City: | 1.9 |
Average number of cars or other vehicles available in apartments:
| Here: | 1.5 |
| city: | 1.2 |
Percentage of units with a mortgage:
| Bannister Acres: | 66.0% |
| Kansas City: | 62.2% |
Average estimated value of detached houses in 2022 (77.8% of all units):
| Bannister Acres: | $144,835 |
| Kansas City: | $271,492 |
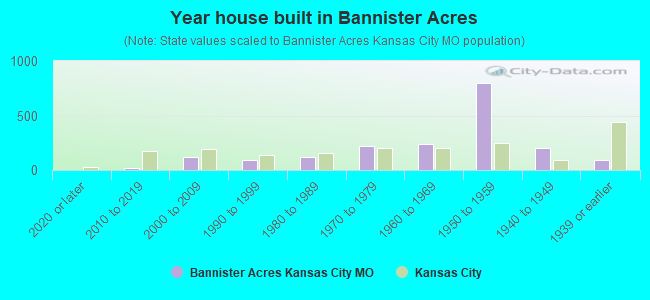
- Year house built in Bannister Acres
- 02020 or later
- 172010 to 2019
- 1162000 to 2009
- 881990 to 1999
- 1171980 to 1989
- 2231970 to 1979
- 2421960 to 1969
- 7961950 to 1959
- 1981940 to 1949
- 891939 or earlier
City-data.com crime index for city in 2020 (higher means more crime):
| City: | 671.9 |
| U.S. average: | 219.5 |
Travel time to work (commute)
![Travel time to work (commute)]()
- 4Less than 5 minutes
- 295 to 9 minutes
- 9010 to 14 minutes
- 29515 to 19 minutes
- 16920 to 24 minutes
- 17525 to 29 minutes
- 34930 to 34 minutes
- 1535 to 39 minutes
- 3240 to 44 minutes
- 32245 to 59 minutes
- 3160 to 89 minutes
- 3590 or more minutes

Means of transportation to work
![Means of transportation to work]()
- 87.0%1,443Drove a car alone
- 16.5%273Carpooled
- 6.5%108Bus
- 0.4%6Walked
- 0.2%4Other means
- 5.8%96Worked at home

Time leaving home to go to work
![Time leaving home to go to work]()
- 6812:00 a.m. to 4:59 a.m.
- 305:00 a.m. to 5:29 a.m.
- 925:30 a.m. to 5:59 a.m.
- 796:00 a.m. to 6:29 a.m.
- 1716:30 a.m. to 6:59 a.m.
- 2377:00 a.m. to 7:29 a.m.
- 1737:30 a.m. to 7:59 a.m.
- 988:00 a.m. to 8:29 a.m.
- 618:30 a.m. to 8:59 a.m.
- 639:00 a.m. to 9:59 a.m.
- 1710:00 a.m. to 10:59 a.m.
- 2111:00 a.m. to 11:59 a.m.
- 8612:00 p.m. to 3:59 p.m.
- 514:00 p.m. to 11:59 p.m.

Occupations of males:
- Percentage of males in management occupations (except farmers):
Here: 5.3% city: 11.5%
- Percentage of males in business and financial operations occupations:
Here: 8.7% city: 5.6%
- Percentage of males in computer and mathematical occupations:
Here: 10.7% city: 6.1%
- Percentage of males in architecture and engineering occupations:
Here: 1.2% city: 3.4%
- Percentage of males in community and social services occupations:
Here: 2.9% city: 1.1%
- Percentage of males in healthcare practitioners and technical occupations:
Here: 3.0% city: 3.4%
- Percentage of males in service occupations:
Here: 20.2% city: 13.8%
- Percentage of males in sales and office occupations:
Here: 16.7% city: 16.1%
- Percentage of males in farming, fishing, and forestry occupations:
Here: 2.2% city: 0.3%
- Percentage of males in construction, extraction, and maintenance occupations:
Here: 1.9% city: 7.3%
- Percentage of males in production occupations:
Here: 10.7% city: 6.9%
- Percentage of males in transportation occupations:
Here: 9.8% city: 6.2%
- Percentage of males in material moving occupations:
Here: 2.2% city: 6.3%
Occupations of females:
- Percentage of females in management occupations (except farmers):
Here: 2.7% city: 9.9%
- Percentage of females in business and financial operations occupations:
Here: 1.6% city: 7.2%
- Percentage of females in architecture and engineering occupations:
Here: 2.6% city: 0.7%
- Percentage of females in community and social services occupations:
Here: 3.1% city: 2.9%
- Percentage of females in education, training, and library occupations:
Here: 14.2% city: 8.0%
- Percentage of females in arts, design, entertainment, sports, and media occupations:
Here: 9.4% city: 2.7%
- Percentage of females in healthcare practitioners and technical occupations:
Here: 14.3% city: 10.3%
- Percentage of females in service occupations:
Here: 18.2% city: 18.7%
- Percentage of females in sales and office occupations:
Here: 29.0% city: 26.2%
- Percentage of females in transportation occupations:
Here: 1.3% city: 1.3%
- Percentage of females in material moving occupations:
Here: 5.2% city: 3.0%
Percentage of people 16-64 in Armed Forces:
| Bannister Acres: | 0.3% |
| Kansas City: | 0.3% |
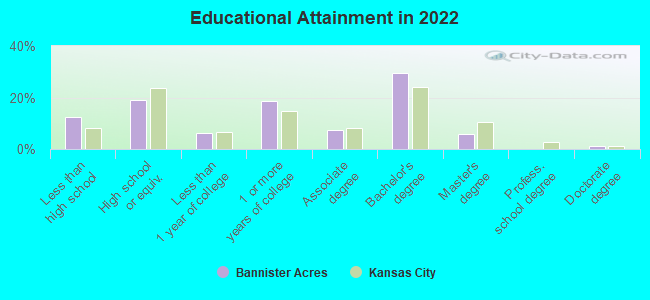
Education in this neighborhood (subdivision or community):
- Percentage of people 3 years and older in K-12 schools:
Bannister Acres: 23.5% Kansas City: 15.8%
- Percentage of people 3 years and older in undergraduate colleges:
Bannister Acres: 5.6% Kansas City: 5.0%
- Percentage of people 3 years and older in grad. or professional schools:
Bannister Acres: 1.6% Kansas City: 1.7%
- Percentage of students K-12 enrolled in private schools:
Bannister Acres: 20.6% Kansas City: 14.7%
Percentage of population below poverty level:
| Bannister Acres: | 18.6% |
| Kansas City: | 14.6% |
Median year owner moved in (as recorded in 2022):
| Bannister Acres: | 1999 |
| Kansas City: | 2012 |
Percentage of married-couple families with both working:
| Bannister Acres: | 117.8% |
| Kansas City: | 76.6% |
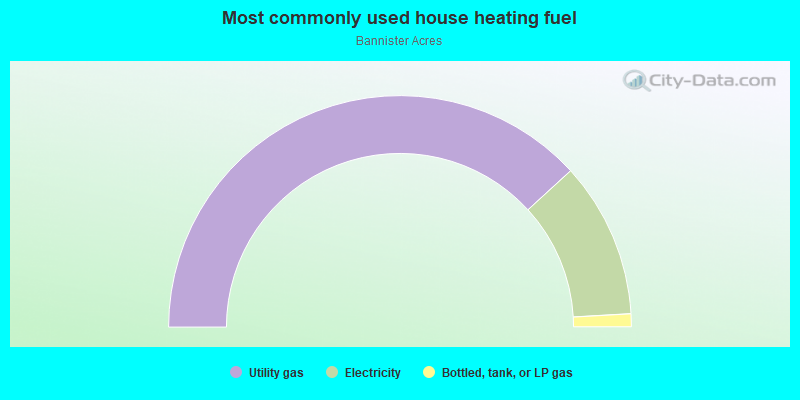
- 76.4%Utility gas
- 21.8%Electricity
- 1.8%Bottled, tank, or LP gas
Limited-access highways (interstate or state) in this neighborhood:
I- 470 (US Hwy 50)
Length: 0.20 miles
Direction: E-W
Address range: 7028 to 7198
Direction: E-W
Address range: 7028 to 7198
Roads and streets:
E 100th Ter (E 100 Ter)
Length: 1.00 miles
Directions: E-W, N-S, SE-NW
Address range: 7000 to 10010
Directions: E-W, N-S, SE-NW
Address range: 7000 to 10010
Blue Ridge Blvd
Length: 0.93 miles
Direction: N-S
Address range: 9500 to 10299
Direction: N-S
Address range: 9500 to 10299
E 102nd St (E 102 St)
Length: 0.91 miles
Directions: E-W, SE-NW
Address range: 7000 to 8199
Directions: E-W, SE-NW
Address range: 7000 to 8199
E 99th St (E 99 St)
Length: 0.79 miles
Direction: E-W
Address range: 7000 to 7964
Direction: E-W
Address range: 7000 to 7964
E Bannister Rd
Length: 0.76 miles
Direction: E-W
Address range: 7000 to 7961
Direction: E-W
Address range: 7000 to 7961
Richmond Ave
Length: 0.67 miles
Directions: E-W, N-S, SE-NW
Address range: 9600 to 10099
Directions: E-W, N-S, SE-NW
Address range: 9600 to 10099
E 100 St (E 100th St)
Length: 0.64 miles
Directions: E-W, SW-NE
Address range: 7400 to 8199
Directions: E-W, SW-NE
Address range: 7400 to 8199
Eastern Ave
Length: 0.58 miles
Direction: N-S
Address range: 9500 to 10049
Direction: N-S
Address range: 9500 to 10049
Overhill Dr (Overhill Rd)
Length: 0.45 miles
Directions: N-S, SE-NW, SW-NE
Address range: 9500 to 9731
Directions: N-S, SE-NW, SW-NE
Address range: 9500 to 9731
E 99th Ter (E 99 Ter)
Length: 0.38 miles
Direction: E-W
Address range: 7800 to 8199
Direction: E-W
Address range: 7800 to 8199
E 96th St (E 96 St)
Length: 0.35 miles
Directions: E-W, N-S, SE-NW, SW-NE
Address range: 7600 to 7999
Directions: E-W, N-S, SE-NW, SW-NE
Address range: 7600 to 7999
Tullis Ave
Length: 0.33 miles
Directions: E-W, N-S, SW-NE
Address range: 9900 to 10199
Directions: E-W, N-S, SW-NE
Address range: 9900 to 10199
Manchester Ave
Length: 0.19 miles
Directions: E-W, N-S, SW-NE
Address range: 9500 to 9599
Directions: E-W, N-S, SW-NE
Address range: 9500 to 9599
James A Reed Rd
Length: 0.16 miles
Direction: SE-NW
Address range: 9968 to 10045
Direction: SE-NW
Address range: 9968 to 10045
E 95th Ter (E 95 Ter)
Length: 0.15 miles
Direction: E-W
Address range: 7600 to 7799
Direction: E-W
Address range: 7600 to 7799
Smalley Ave
Length: 0.14 miles
Directions: E-W, N-S, SE-NW
Address range: 9800 to 9899
Directions: E-W, N-S, SE-NW
Address range: 9800 to 9899
Sycamore Ave
Length: 0.10 miles
Directions: SE-NW, SW-NE
Address range: 9600 to 9705
Directions: SE-NW, SW-NE
Address range: 9600 to 9705
E 100th Ct (E 100th Terrace Ct)
Length: 0.09 miles
Direction: E-W
Address range: 8100 to 8199
Direction: E-W
Address range: 8100 to 8199
Potter Cir (Potter Ave)
Length: 0.04 miles
Directions: N-S, SW-NE
Address range: 9800 to 9899
Directions: N-S, SW-NE
Address range: 9800 to 9899
Oakland Ave
Length: 0.03 miles
Direction: N-S
Address range: 10201 to 10299
Direction: N-S
Address range: 10201 to 10299