Beaumont neighborhood in Knoxville, Tennessee (TN), 37921 detailed profile
Settings
X

Business Search - 14 Million verified businesses
Area: 0.270 square miles
Population: 664
Population density:
| Beaumont: | 2,460 people per square mile |
| Knoxville: | 2,114 people per square mile |

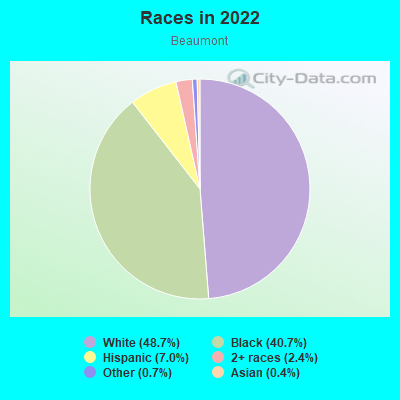
- 32648.7%White
- 27340.7%Black
- 477.0%Hispanic or Latino
- 162.4%Two or more races
- 50.7%Some other race
- 30.4%Asian
Distribution of median household income
![Distribution of median household income]()
- 186Less than $10,000
- 11$10,000 to $19,999
- 63$20,000 to $29,999
- 57$30,000 to $39,999
- 26$40,000 to $49,999
- 2$50,000 to $59,999
- 35$60,000 to $74,999
- 64$75,000 to $99,999
- 37$100,000 to $124,999
- 6$125,000 to $149,999
- 9$150,000 to $199,999
- 81$200,000 or more

Distribution of owner-occupied house/condo value
![Distribution of owner-occupied house/condo value]()
- 88Less than $50,000
- 54$50,000 to $99,999
- 16$100,000 to $149,999
- 16$150,000 to $199,999
- 25$200,000 to $249,999
- 2$250,000 to $299,999
- 81$300,000 to $399,999
- 4$400,000 to $499,999
- 5$500,000 to $749,999
- 1$750,000 to $999,999
- 2$1,000,000 or more

Distribution of rent paid by renters
![Distribution of rent paid by renters]()
- 29Less than $100
- 105$100 to $199
- 79$200 to $299
- 5$300 to $399
- 47$400 to $499
- 22$500 to $599
- 83$600 to $699
- 201$700 to $799
- 60$800 to $899
- 45$900 to $999
- 4$1,000 to $1,249
- 9$1,250 to $1,499
- 2$1,500 to $1,999

Median rent in 2022:
| Beaumont: | $726 |
| Knoxville: | $889 |
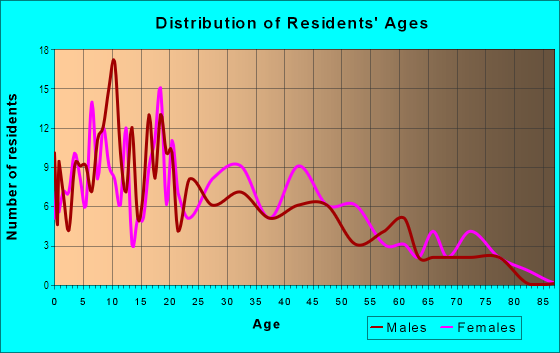
| Males: | 288 |
| Females: | 375 |
Males:
| This neighborhood: | 34.6 years |
| Whole city: | 31.5 years |
| This neighborhood: | 34.2 years |
| Whole city: | 33.5 years |
Average household size:
| Beaumont: | 2.5 people |
| Knoxville: | 2.2 people |
Percentage of family households:
| Beaumont: | 65.4% |
| Knoxville: | 36.0% |
| Here: | 49.8% |
| Knoxville: | 31.0% |
Percentage of married-couple families with children (among all households):
| Beaumont: | 20.9% |
| Knoxville: | 23.7% |
Percentage of single-mother households (among all households):
| Beaumont: | 5.5% |
| Knoxville: | 15.0% |
Percentage of never married males 15 years old and over:
Percentage of never married females 15 years old and over:
| Beaumont: | 21.3% |
| Knoxville: | 23.7% |
Percentage of never married females 15 years old and over:
| Beaumont: | 7.8% |
| city: | 24.2% |
Percentage of people that speak English not well or not at all:
| Beaumont: | 5.3% |
| Knoxville: | 1.7% |
Percentage of people born in this state:
Percentage of people born in another U.S. state:
Percentage of native residents but born outside the U.S.:
Percentage of foreign born residents:
| Here: | 76.0% |
| Knoxville: | 61.7% |
Percentage of people born in another U.S. state:
| Beaumont: | 13.3% |
| Knoxville: | 32.1% |
Percentage of native residents but born outside the U.S.:
| Here: | 3.4% |
| city: | 0.8% |
Percentage of foreign born residents:
| Here: | 7.4% |
| Knoxville: | 5.4% |
Owner-occupied
Renter-occupied

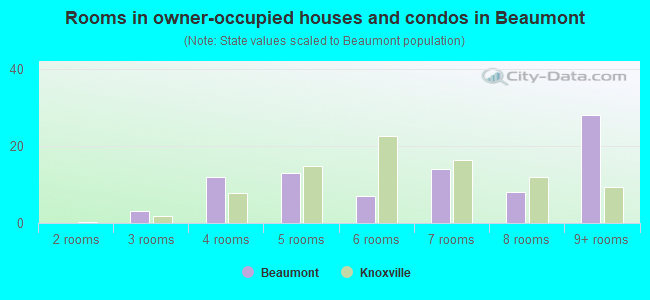
- Rooms in owner-occupied houses and condos in Beaumont
- 01 room
- 02 rooms
- 33 rooms
- 124 rooms
- 135 rooms
- 76 rooms
- 147 rooms
- 88 rooms
- 289+ rooms
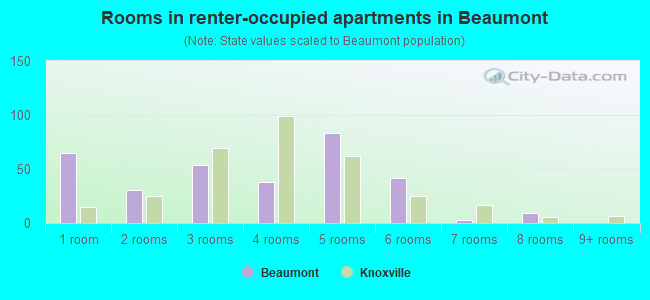
- Rooms in renter-occupied apartments in Beaumont
- 651 room
- 312 rooms
- 543 rooms
- 384 rooms
- 835 rooms
- 426 rooms
- 37 rooms
- 98 rooms
- 09+ rooms
Owner-occupied
Renter-occupied

- Bedrooms in owner-occupied houses and condos in Beaumont
- 0no bedroom
- 11 bedroom
- 42 bedrooms
- 383 bedrooms
- 54 bedrooms
- 35+ bedrooms
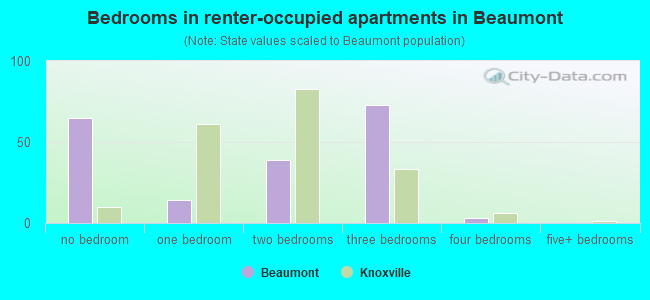
- Bedrooms in renter-occupied apartments in Beaumont
- 65no bedroom
- 141 bedroom
- 392 bedrooms
- 733 bedrooms
- 34 bedrooms
- 05+ bedrooms
Average number of cars or other vehicles available in houses/condos:
Average number of cars or other vehicles available in apartments:
| This neighborhood: | 1.6 |
| Knoxville: | 2.0 |
Average number of cars or other vehicles available in apartments:
| Here: | 1.4 |
| city: | 1.4 |
Percentage of units with a mortgage:
| Beaumont: | 41.4% |
| Knoxville: | 58.0% |
Average estimated value of detached houses in 2022 (92.3% of all units):
| Beaumont: | $83,950 |
| Tennessee: | $374,382 |
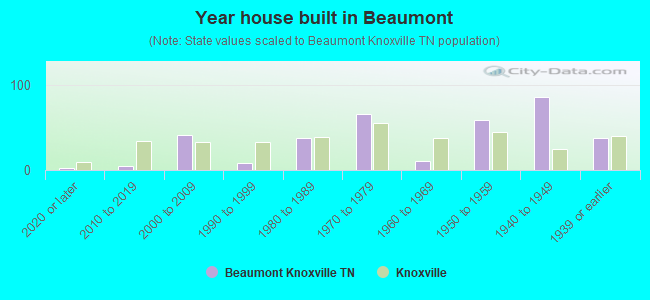
- Year house built in Beaumont
- 22020 or later
- 52010 to 2019
- 412000 to 2009
- 81990 to 1999
- 381980 to 1989
- 661970 to 1979
- 101960 to 1969
- 581950 to 1959
- 851940 to 1949
- 371939 or earlier
City-data.com crime index for city in 2020 (higher means more crime):
| City: | 460.5 |
| U.S. average: | 219.5 |
Travel time to work (commute)
![Travel time to work (commute)]()
- 1Less than 5 minutes
- 715 to 9 minutes
- 2310 to 14 minutes
- 2815 to 19 minutes
- 5020 to 24 minutes
- 825 to 29 minutes
- 2530 to 34 minutes
- 335 to 39 minutes
- 245 to 59 minutes
- 590 or more minutes

Means of transportation to work
![Means of transportation to work]()
- 44.9%164Drove a car alone
- 53.1%194Carpooled
- 1.1%4Bus
- 25.2%92Taxi
- 0.3%1Bicycle
- 15.9%58Walked
- 0.3%1Other means
- 0.3%1Worked at home

Time leaving home to go to work
![Time leaving home to go to work]()
- 212:00 a.m. to 4:59 a.m.
- 15:00 a.m. to 5:29 a.m.
- 45:30 a.m. to 5:59 a.m.
- 26:00 a.m. to 6:29 a.m.
- 186:30 a.m. to 6:59 a.m.
- 367:00 a.m. to 7:29 a.m.
- 37:30 a.m. to 7:59 a.m.
- 118:00 a.m. to 8:29 a.m.
- 228:30 a.m. to 8:59 a.m.
- 119:00 a.m. to 9:59 a.m.
- 810:00 a.m. to 10:59 a.m.
- 211:00 a.m. to 11:59 a.m.
- 4512:00 p.m. to 3:59 p.m.
- 554:00 p.m. to 11:59 p.m.

Occupations of males:
- Percentage of males in management occupations (except farmers):
Here: 28.0% city: 8.8%
- Percentage of males in architecture and engineering occupations:
Here: 2.8% city: 3.4%
- Percentage of males in community and social services occupations:
Here: 2.6% city: 1.3%
- Percentage of males in education, training, and library occupations:
Here: 4.6% city: 4.8%
- Percentage of males in sales and office occupations:
Here: 6.3% city: 15.7%
- Percentage of males in construction, extraction, and maintenance occupations:
Here: 37.3% city: 9.2%
- Percentage of males in material moving occupations:
Here: 16.5% city: 5.5%
Occupations of females:
- Percentage of females in management occupations (except farmers):
Here: 15.3% city: 8.6%
- Percentage of females in community and social services occupations:
Here: 10.8% city: 2.8%
- Percentage of females in healthcare practitioners and technical occupations:
Here: 9.6% city: 9.6%
- Percentage of females in service occupations:
Here: 60.7% city: 21.9%
- Percentage of females in sales and office occupations:
Here: 2.6% city: 28.0%
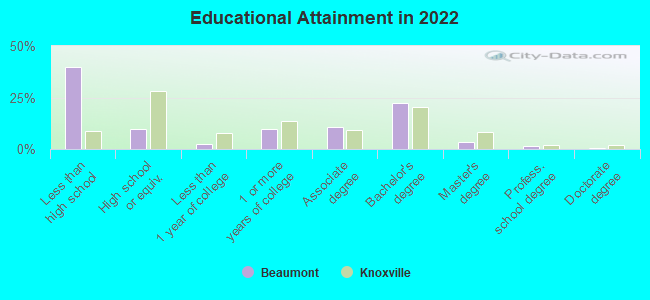
Education in this neighborhood (subdivision or community):
- Percentage of people 3 years and older in K-12 schools:
Beaumont: 50.6% Knoxville: 12.6%
- Percentage of people 3 years and older in undergraduate colleges:
Beaumont: 8.8% Knoxville: 12.8%
- Percentage of people 3 years and older in grad. or professional schools:
Beaumont: 2.3% Knoxville: 3.0%
- Percentage of students K-12 enrolled in private schools:
Beaumont: 7.2% Knoxville: 9.2%
Percentage of population below poverty level:
| Beaumont: | 33.9% |
| Knoxville: | 17.5% |
Median year owner moved in (as recorded in 2022):
Median year renter moved in (as recorded in 2022):
| Beaumont: | 2002 |
| Knoxville: | 2011 |
Median year renter moved in (as recorded in 2022):
| Beaumont: | 2017 |
| Knoxville: | 2020 |
Percentage of married-couple families with both working:
| Beaumont: | 109.3% |
| Knoxville: | 66.2% |
- 66.6%Electricity
- 25.1%Utility gas
- 5.1%Wood
- 2.0%Bottled, tank, or LP gas
- 1.3%Fuel oil, kerosene, etc.
Roads and streets:
Vermont Ave (Vermont Ave NW)
Length: 1.20 miles
Direction: SW-NE
Address range: 800 to 2299
Direction: SW-NE
Address range: 800 to 2299
Maryland Ave (Maryland Ave NW)
Length: 1.07 miles
Directions: N-S, SW-NE
Address range: 900 to 2199
Directions: N-S, SW-NE
Address range: 900 to 2199
Massachusetts Ave NW (Massachusetts Ave)
Length: 0.94 miles
Directions: E-W, N-S, SW-NE
Address range: 900 to 2299
Directions: E-W, N-S, SW-NE
Address range: 900 to 2299
Virginia Ave (Virginia Ave NW)
Length: 0.59 miles
Direction: SW-NE
Address range: 1300 to 2199
Direction: SW-NE
Address range: 1300 to 2199
Lonsdale Pike
Length: 0.33 miles
Directions: E-W, SW-NE
Address range: 2000 to 2299
Directions: E-W, SW-NE
Address range: 2000 to 2299
Iowa Ave
Length: 0.29 miles
Direction: SW-NE
Address range: 1300 to 1599
Direction: SW-NE
Address range: 1300 to 1599
Murphy Ave
Length: 0.21 miles
Directions: E-W, SE-NW
Address range: 900 to 999
Directions: E-W, SE-NW
Address range: 900 to 999
Bowling Ave (Bowling Ave NW)
Length: 0.21 miles
Direction: E-W
Address range: 2000 to 2199
Direction: E-W
Address range: 2000 to 2199
Schofield St (Schofield St NW)
Length: 0.15 miles
Direction: SE-NW
Address range: 2100 to 2299
Direction: SE-NW
Address range: 2100 to 2299
Testerman Dr NW
Length: 0.11 miles
Direction: E-W
Address range: 2000 to 2099
Direction: E-W
Address range: 2000 to 2099
McClellan St
Length: 0.10 miles
Direction: N-S
Address range: 2200 to 2299
Direction: N-S
Address range: 2200 to 2299
Gordon St
Length: 0.10 miles
Direction: N-S
Address range: 2200 to 2299
Direction: N-S
Address range: 2200 to 2299
Hawkins St
Length: 0.09 miles
Direction: E-W
Direction: E-W
Hooker St NW
Length: 0.08 miles
Direction: SE-NW
Direction: SE-NW
Hawkins St NW
Length: 0.08 miles
Directions: E-W, SE-NW
Address range: 2200 to 2299
Directions: E-W, SE-NW
Address range: 2200 to 2299
Gordon St NW
Length: 0.08 miles
Direction: SE-NW
Address range: 2100 to 2199
Direction: SE-NW
Address range: 2100 to 2199
Hooker St
Length: 0.07 miles
Direction: SE-NW
Direction: SE-NW
Stonewall St
Length: 0.06 miles
Direction: N-S
Address range: 2300 to 2357
Direction: N-S
Address range: 2300 to 2357
Burnside St
Length: 0.04 miles
Directions: SE-NW, SW-NE
Address range: 2300 to 2361
Directions: SE-NW, SW-NE
Address range: 2300 to 2361
Bragg St NW
Length: 0.03 miles
Directions: E-W, SE-NW
Address range: 2300 to 2345
Directions: E-W, SE-NW
Address range: 2300 to 2345