Bitter Lake neighborhood in Seattle, Washington (WA), 98133 detailed profile
Settings
X


Business Search - 14 Million verified businesses
Area: 0.986 square miles
Population: 8,765
Population density:
| Bitter Lake: | 8,892 people per square mile |
| Seattle: | 8,933 people per square mile |

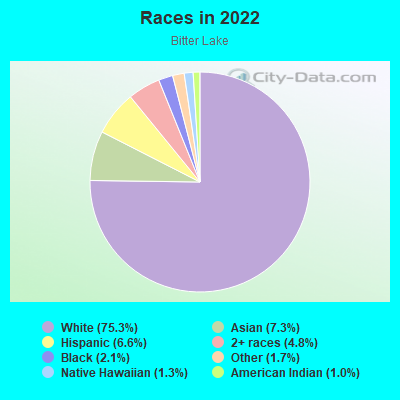
- 6,82575.3%White
- 6597.3%Asian
- 5996.6%Hispanic or Latino
- 4314.8%Two or more races
- 1912.1%Black
- 1531.7%Some other race
- 1161.3%Native Hawaiian and Other
Pacific Islander - 921.0%American Indian
Median household income in 2022:
| Bitter Lake: | $125,075 |
| Seattle: | $115,409 |
Distribution of median household income
![Distribution of median household income]()
- 133Less than $10,000
- 226$10,000 to $19,999
- 526$20,000 to $29,999
- 415$30,000 to $39,999
- 177$40,000 to $49,999
- 302$50,000 to $59,999
- 190$60,000 to $74,999
- 472$75,000 to $99,999
- 315$100,000 to $124,999
- 352$125,000 to $149,999
- 444$150,000 to $199,999
- 1,122$200,000 or more

Distribution of owner-occupied house/condo value
![Distribution of owner-occupied house/condo value]()
- 131Less than $50,000
- 26$50,000 to $99,999
- 76$100,000 to $149,999
- 5$150,000 to $199,999
- 7$200,000 to $249,999
- 26$250,000 to $299,999
- 56$300,000 to $399,999
- 71$400,000 to $499,999
- 741$500,000 to $749,999
- 866$750,000 to $999,999
- 579$1,000,000 or more

Distribution of rent paid by renters
![Distribution of rent paid by renters]()
- 126Less than $100
- 181$100 to $199
- 323$200 to $299
- 124$300 to $399
- 120$400 to $499
- 92$500 to $599
- 170$800 to $899
- 106$900 to $999
- 218$1,000 to $1,249
- 757$1,250 to $1,499
- 629$1,500 to $1,999
- 1,998$2,000 or more

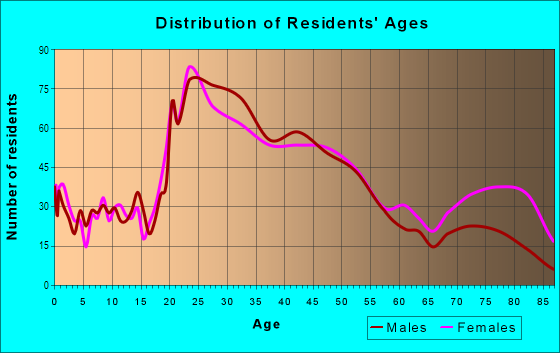
| Males: | 3,983 |
| Females: | 4,781 |
Males:
| This neighborhood: | 45.6 years |
| Whole city: | 35.7 years |
| This neighborhood: | 49.1 years |
| Whole city: | 36.2 years |
Average household size:
| Bitter Lake: | 2.1 people |
| Seattle: | 2.0 people |
Percentage of family households:
| Bitter Lake: | 39.4% |
| Seattle: | 30.9% |
| Here: | 44.1% |
| Seattle: | 33.2% |
Percentage of married-couple families with children (among all households):
| Bitter Lake: | 35.0% |
| Seattle: | 36.5% |
Percentage of single-mother households (among all households):
| Bitter Lake: | 2.9% |
| Seattle: | 9.3% |
Percentage of never married males 15 years old and over:
Percentage of never married females 15 years old and over:
| Bitter Lake: | 13.2% |
| Seattle: | 24.9% |
Percentage of never married females 15 years old and over:
| Bitter Lake: | 12.9% |
| city: | 22.3% |
Percentage of people that speak English not well or not at all:
| Bitter Lake: | 2.0% |
| Seattle: | 3.2% |
Percentage of people born in this state:
Percentage of people born in another U.S. state:
Percentage of native residents but born outside the U.S.:
Percentage of foreign born residents:
| Here: | 43.8% |
| Seattle: | 34.6% |
Percentage of people born in another U.S. state:
| Bitter Lake: | 40.4% |
| Seattle: | 42.9% |
Percentage of native residents but born outside the U.S.:
| Here: | 1.7% |
| city: | 2.2% |
Percentage of foreign born residents:
| Here: | 14.1% |
| Seattle: | 20.3% |
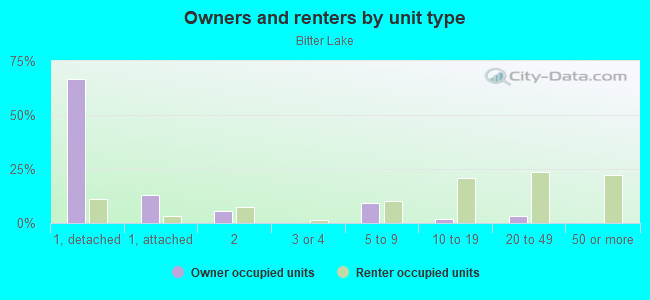
Owner-occupied
Renter-occupied

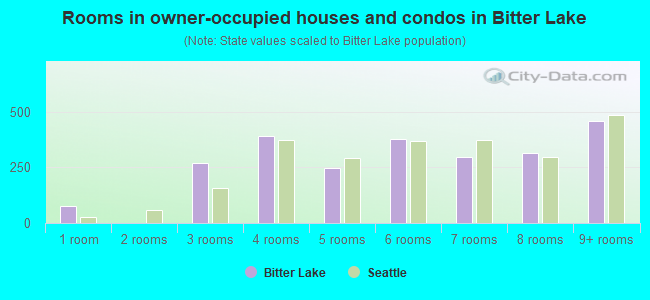
- Rooms in owner-occupied houses and condos in Bitter Lake
- 751 room
- 02 rooms
- 2713 rooms
- 3914 rooms
- 2465 rooms
- 3806 rooms
- 2997 rooms
- 3148 rooms
- 4579+ rooms
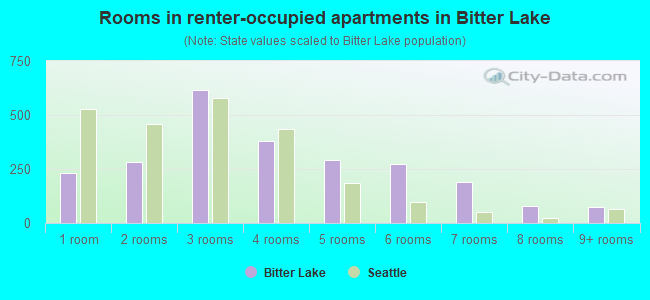
- Rooms in renter-occupied apartments in Bitter Lake
- 2331 room
- 2812 rooms
- 6163 rooms
- 3804 rooms
- 2935 rooms
- 2756 rooms
- 1907 rooms
- 798 rooms
- 729+ rooms
Owner-occupied
Renter-occupied
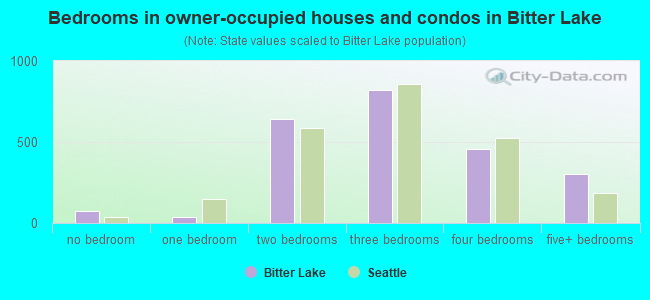
- Bedrooms in owner-occupied houses and condos in Bitter Lake
- 75no bedroom
- 391 bedroom
- 6402 bedrooms
- 8193 bedrooms
- 4554 bedrooms
- 3045+ bedrooms
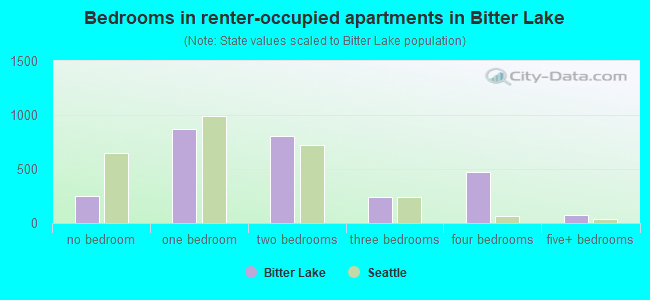
- Bedrooms in renter-occupied apartments in Bitter Lake
- 249no bedroom
- 8671 bedroom
- 8052 bedrooms
- 2403 bedrooms
- 4764 bedrooms
- 725+ bedrooms
Average number of cars or other vehicles available in houses/condos:
Average number of cars or other vehicles available in apartments:
| This neighborhood: | 1.9 |
| Seattle: | 1.7 |
Average number of cars or other vehicles available in apartments:
| Here: | 1.0 |
| city: | 0.9 |
Percentage of units with a mortgage:
| Bitter Lake: | 73.8% |
| Seattle: | 70.4% |
Average estimated value of detached houses in 2022 (51.2% of all units):
| Bitter Lake: | $863,704 |
| Seattle: | $1,274,185 |
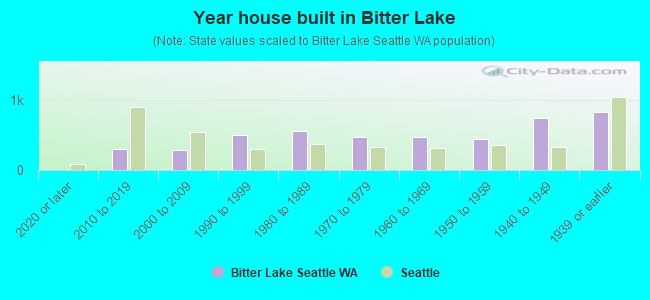
- Year house built in Bitter Lake
- 02020 or later
- 2962010 to 2019
- 2862000 to 2009
- 4971990 to 1999
- 5621980 to 1989
- 4661970 to 1979
- 4641960 to 1969
- 4361950 to 1959
- 7361940 to 1949
- 8221939 or earlier
City-data.com crime index for city in 2020 (higher means more crime):
| City: | 440.8 |
| U.S. average: | 219.5 |
Travel time to work (commute)
![Travel time to work (commute)]()
- 43Less than 5 minutes
- 4145 to 9 minutes
- 37610 to 14 minutes
- 41115 to 19 minutes
- 34320 to 24 minutes
- 36925 to 29 minutes
- 46230 to 34 minutes
- 11635 to 39 minutes
- 26740 to 44 minutes
- 34545 to 59 minutes
- 45260 to 89 minutes
- 6090 or more minutes

Means of transportation to work
![Means of transportation to work]()
- 47.2%2,399Drove a car alone
- 12.5%635Carpooled
- 16.0%816Bus
- 5.0%255Light rail, streetcar or trolley
- 2.5%125Taxi
- 0.8%39Motorcycle
- 1.5%76Bicycle
- 1.8%92Walked
- 4.3%217Other means
- 21.0%1,067Worked at home

Time leaving home to go to work
![Time leaving home to go to work]()
- 17112:00 a.m. to 4:59 a.m.
- 335:00 a.m. to 5:29 a.m.
- 1025:30 a.m. to 5:59 a.m.
- 1126:00 a.m. to 6:29 a.m.
- 2676:30 a.m. to 6:59 a.m.
- 3887:00 a.m. to 7:29 a.m.
- 3947:30 a.m. to 7:59 a.m.
- 7538:00 a.m. to 8:29 a.m.
- 1168:30 a.m. to 8:59 a.m.
- 2149:00 a.m. to 9:59 a.m.
- 34210:00 a.m. to 10:59 a.m.
- 7411:00 a.m. to 11:59 a.m.
- 25412:00 p.m. to 3:59 p.m.
- 4024:00 p.m. to 11:59 p.m.

Occupations of males:
- Percentage of males in management occupations (except farmers):
Here: 15.8% city: 16.0%
- Percentage of males in business and financial operations occupations:
Here: 7.4% city: 7.6%
- Percentage of males in computer and mathematical occupations:
Here: 12.1% city: 18.5%
- Percentage of males in architecture and engineering occupations:
Here: 3.5% city: 5.6%
- Percentage of males in life, physical, and social science occupations:
Here: 5.0% city: 2.5%
- Percentage of males in education, training, and library occupations:
Here: 1.9% city: 4.1%
- Percentage of males in arts, design, entertainment, sports, and media occupations:
Here: 4.7% city: 3.8%
- Percentage of males in healthcare practitioners and technical occupations:
Here: 5.8% city: 3.6%
- Percentage of males in service occupations:
Here: 14.2% city: 10.5%
- Percentage of males in sales and office occupations:
Here: 10.6% city: 12.0%
- Percentage of males in construction, extraction, and maintenance occupations:
Here: 7.3% city: 3.2%
- Percentage of males in production occupations:
Here: 5.4% city: 2.6%
- Percentage of males in transportation occupations:
Here: 2.5% city: 3.0%
- Percentage of males in material moving occupations:
Here: 1.4% city: 1.9%
Occupations of females:
- Percentage of females in management occupations (except farmers):
Here: 8.7% city: 14.2%
- Percentage of females in business and financial operations occupations:
Here: 9.6% city: 9.8%
- Percentage of females in computer and mathematical occupations:
Here: 4.5% city: 6.6%
- Percentage of females in architecture and engineering occupations:
Here: 2.9% city: 2.1%
- Percentage of females in life, physical, and social science occupations:
Here: 2.2% city: 3.0%
- Percentage of females in community and social services occupations:
Here: 2.1% city: 3.2%
- Percentage of females in education, training, and library occupations:
Here: 12.9% city: 8.7%
- Percentage of females in arts, design, entertainment, sports, and media occupations:
Here: 4.2% city: 5.0%
- Percentage of females in healthcare practitioners and technical occupations:
Here: 8.9% city: 9.6%
- Percentage of females in service occupations:
Here: 15.6% city: 13.7%
- Percentage of females in sales and office occupations:
Here: 25.5% city: 17.7%
- Percentage of females in material moving occupations:
Here: 2.0% city: 1.2%
Percentage of people 16-64 in Armed Forces:
| Bitter Lake: | 0.1% |
| Seattle: | 0.2% |
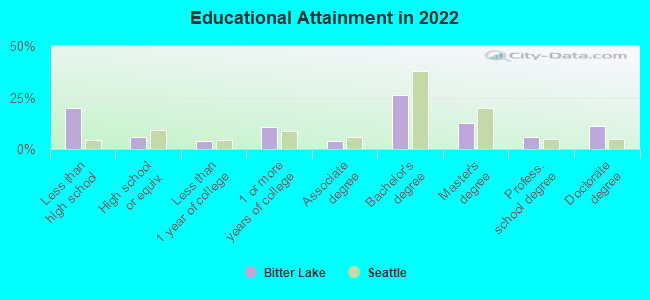
Education in this neighborhood (subdivision or community):
- Percentage of people 3 years and older in K-12 schools:
Bitter Lake: 20.4% Seattle: 9.8%
- Percentage of people 3 years and older in undergraduate colleges:
Bitter Lake: 3.2% Seattle: 6.3%
- Percentage of people 3 years and older in grad. or professional schools:
Bitter Lake: 6.5% Seattle: 3.0%
- Percentage of students K-12 enrolled in private schools:
Bitter Lake: 30.2% Seattle: 17.3%
Percentage of population below poverty level:
| Bitter Lake: | 5.0% |
| Seattle: | 10.1% |
Median year owner moved in (as recorded in 2022):
Median year renter moved in (as recorded in 2022):
| Bitter Lake: | 2007 |
| Seattle: | 2013 |
Median year renter moved in (as recorded in 2022):
| Bitter Lake: | 2018 |
| Seattle: | 2021 |
Percentage of married-couple families with both working:
| Bitter Lake: | 88.1% |
| Seattle: | 74.4% |
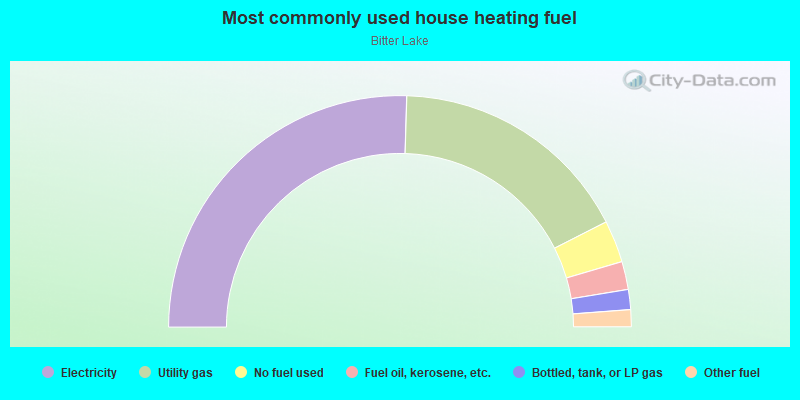
- 51.0%Electricity
- 34.1%Utility gas
- 5.9%No fuel used
- 3.9%Fuel oil, kerosene, etc.
- 2.8%Bottled, tank, or LP gas
- 2.4%Other fuel
Highways in this neighborhood:
State Rte 99 (Aurora Ave N)
Length: 1.02 miles
Direction: N-S
Address range: 10650 to 12699
Direction: N-S
Address range: 10650 to 12699
Roads and streets:
Linden Ave N
Length: 1.81 miles
Direction: N-S
Address range: 10700 to 14299
Direction: N-S
Address range: 10700 to 14299
Fremont Ave N
Length: 1.30 miles
Direction: N-S
Address range: 10601 to 14399
Direction: N-S
Address range: 10601 to 14399
Evanston Ave N
Length: 1.25 miles
Direction: N-S
Address range: 10700 to 14299
Direction: N-S
Address range: 10700 to 14299
Phinney Ave N
Length: 1.22 miles
Directions: N-S, SE-NW, SW-NE
Address range: 10700 to 14199
Directions: N-S, SE-NW, SW-NE
Address range: 10700 to 14199
Dayton Ave N
Length: 1.18 miles
Directions: E-W, N-S, SW-NE
Address range: 10700 to 13899
Directions: E-W, N-S, SW-NE
Address range: 10700 to 13899
N Park Ave N
Length: 0.88 miles
Directions: E-W, N-S, SE-NW, SW-NE
Address range: 10700 to 13699
Directions: E-W, N-S, SE-NW, SW-NE
Address range: 10700 to 13699
N 137th St
Length: 0.74 miles
Directions: E-W, SE-NW
Address range: 300 to 1099
Directions: E-W, SE-NW
Address range: 300 to 1099
N 143rd St
Length: 0.67 miles
Direction: E-W
Address range: 300 to 971
Direction: E-W
Address range: 300 to 971
N 107th St
Length: 0.65 miles
Direction: E-W
Address range: 400 to 1099
Direction: E-W
Address range: 400 to 1099
N 125th St
Length: 0.64 miles
Direction: E-W
Address range: 400 to 952
Direction: E-W
Address range: 400 to 952
N 127th St
Length: 0.64 miles
Direction: E-W
Address range: 400 to 999
Direction: E-W
Address range: 400 to 999
N 130th St
Length: 0.63 miles
Direction: E-W
Address range: 400 to 1099
Direction: E-W
Address range: 400 to 1099
N 138th St
Length: 0.47 miles
Direction: E-W
Address range: 300 to 899
Direction: E-W
Address range: 300 to 899
N 117th St
Length: 0.42 miles
Direction: E-W
Address range: 400 to 899
Direction: E-W
Address range: 400 to 899
N 115th St
Length: 0.39 miles
Direction: E-W
Address range: 400 to 899
Direction: E-W
Address range: 400 to 899
N 120th St
Length: 0.38 miles
Direction: E-W
Address range: 400 to 899
Direction: E-W
Address range: 400 to 899
N 109th St
Length: 0.37 miles
Direction: E-W
Address range: 700 to 1099
Direction: E-W
Address range: 700 to 1099
N 128th St
Length: 0.37 miles
Direction: E-W
Address range: 700 to 1099
Direction: E-W
Address range: 700 to 1099
N 110th St
Length: 0.37 miles
Direction: E-W
Address range: 400 to 799
Direction: E-W
Address range: 400 to 799
N 122nd St
Length: 0.37 miles
Direction: E-W
Address range: 400 to 899
Direction: E-W
Address range: 400 to 899
Greenwood Ave N
Length: 0.34 miles
Direction: N-S
Address range: 13550 to 14399
Direction: N-S
Address range: 13550 to 14399
N 112th St
Length: 0.27 miles
Direction: E-W
Address range: 400 to 698
Direction: E-W
Address range: 400 to 698
N 135th St
Length: 0.22 miles
Direction: E-W
Address range: 743 to 998
Direction: E-W
Address range: 743 to 998
N 141st St
Length: 0.19 miles
Directions: E-W, SE-NW
Address range: 322 to 599
Directions: E-W, SE-NW
Address range: 322 to 599
Whitman Ave N
Length: 0.15 miles
Direction: N-S
Address range: 10700 to 11099
Direction: N-S
Address range: 10700 to 11099
Bitter Pl N
Length: 0.14 miles
Direction: SE-NW
Address range: 13200 to 13399
Direction: SE-NW
Address range: 13200 to 13399
N 142nd St
Length: 0.11 miles
Direction: E-W
Address range: 300 to 599
Direction: E-W
Address range: 300 to 599
Wingard Ct N
Length: 0.06 miles
Direction: SW-NE
Address range: 13500 to 13699
Direction: SW-NE
Address range: 13500 to 13699
N 141st Ct
Length: 0.02 miles
Direction: N-S
Address range: 400 to 499
Direction: N-S
Address range: 400 to 499
N 134th St
Length: 0.00 miles
Direction: SE-NW
Direction: SE-NW