California Maison neighborhood in San Jose, California (CA), 95138 detailed profile
Settings
X

Business Search - 14 Million verified businesses
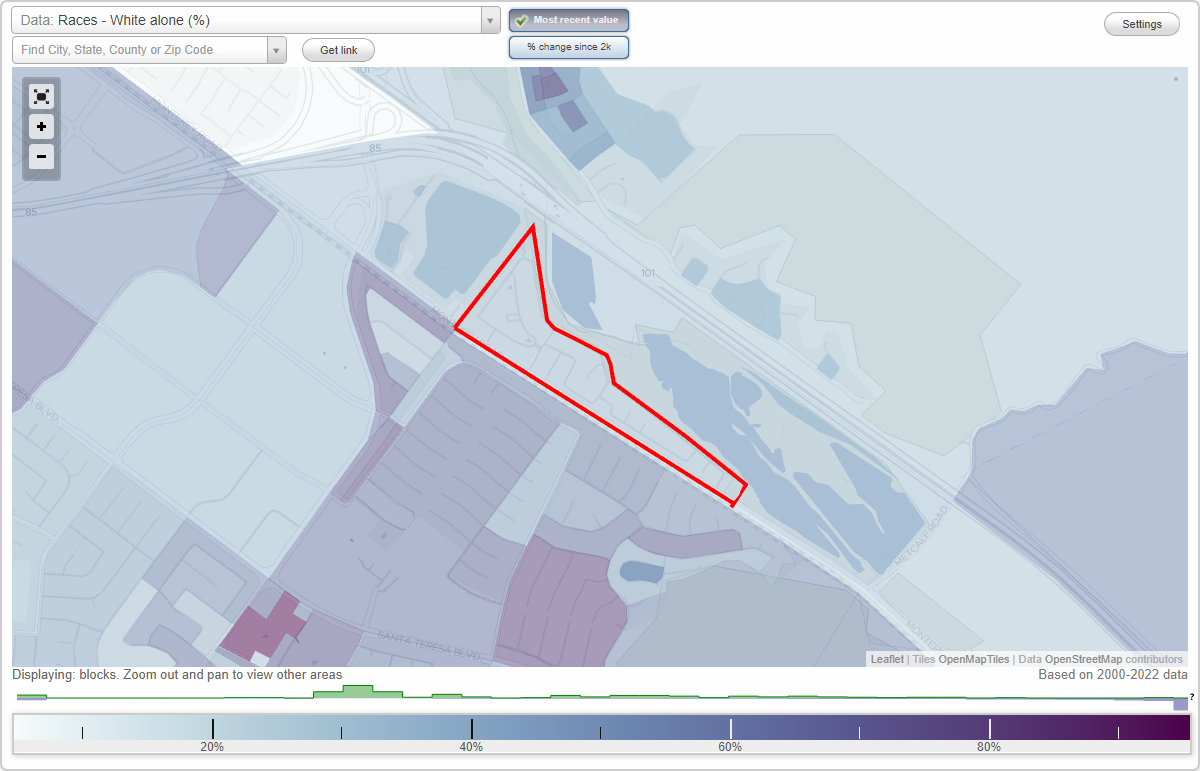
Area: 0.092 square miles
Population: 447
Population density:
| California Maison: | 4,880 people per square mile |
| San Jose: | 5,554 people per square mile |

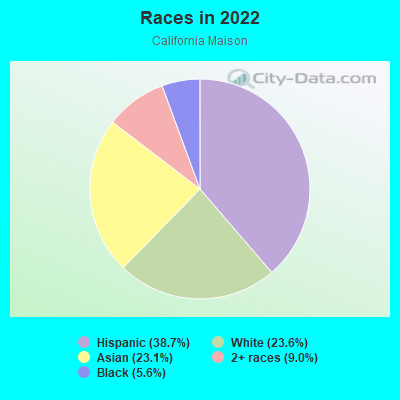
- 17238.7%Hispanic or Latino
- 10523.6%White
- 10323.1%Asian
- 409.0%Two or more races
- 255.6%Black
Median household income in 2022:
| California Maison: | $179,585 |
| San Jose: | $133,835 |
Distribution of median household income
![Distribution of median household income]()
- 2Less than $10,000
- 3$10,000 to $19,999
- 8$20,000 to $29,999
- 2$30,000 to $39,999
- 11$40,000 to $49,999
- 3$50,000 to $59,999
- 9$60,000 to $74,999
- 5$75,000 to $99,999
- 4$100,000 to $124,999
- 10$125,000 to $149,999
- 24$150,000 to $199,999
- 57$200,000 or more

Distribution of owner-occupied house/condo value
![Distribution of owner-occupied house/condo value]()
- 3Less than $50,000
- 2$100,000 to $149,999
- 3$250,000 to $299,999
- 2$400,000 to $499,999
- 5$500,000 to $749,999
- 37$750,000 to $999,999
- 54$1,000,000 or more

Distribution of rent paid by renters
![Distribution of rent paid by renters]()
- 1$600 to $699
- 4$700 to $799
- 5$800 to $899
- 2$1,000 to $1,249
- 32$2,000 or more

Median rent in 2022:
| California Maison: | $3,342 |
| San Jose: | $2,001 |
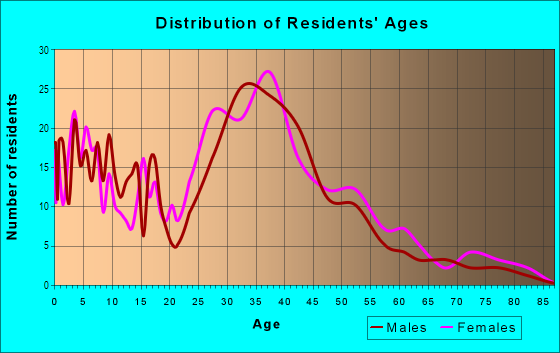
| Males: | 240 |
| Females: | 206 |
Males:
| This neighborhood: | 41.5 years |
| Whole city: | 37.6 years |
| This neighborhood: | 42.7 years |
| Whole city: | 39.1 years |
Average household size:
| California Maison: | 22.6 people |
| San Jose: | 2.9 people |
Percentage of family households:
| California Maison: | 52.0% |
| San Jose: | 49.9% |
| Here: | 68.8% |
| San Jose: | 53.0% |
Percentage of married-couple families with children (among all households):
| California Maison: | 14.9% |
| San Jose: | 25.8% |
Percentage of single-mother households (among all households):
| California Maison: | 1.1% |
| San Jose: | 5.2% |
Percentage of never married males 15 years old and over:
Percentage of never married females 15 years old and over:
| California Maison: | 18.4% |
| San Jose: | 20.9% |
Percentage of never married females 15 years old and over:
| California Maison: | 14.3% |
| city: | 16.7% |
Percentage of people that speak English not well or not at all:
| California Maison: | 0.0% |
| San Jose: | 11.4% |
Percentage of people born in this state:
Percentage of people born in another U.S. state:
Percentage of native residents but born outside the U.S.:
Percentage of foreign born residents:
| Here: | 56.2% |
| San Jose: | 46.1% |
Percentage of people born in another U.S. state:
| California Maison: | 9.6% |
| San Jose: | 10.4% |
Percentage of native residents but born outside the U.S.:
| Here: | 1.2% |
| city: | 1.7% |
Percentage of foreign born residents:
| Here: | 33.0% |
| San Jose: | 41.8% |
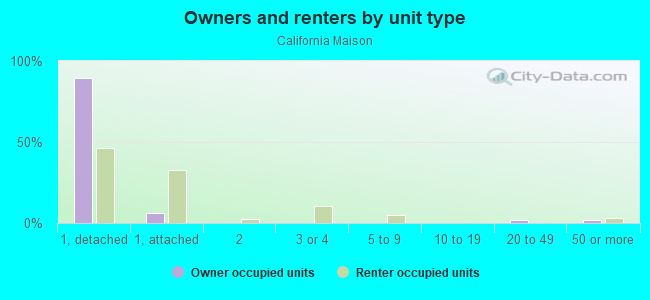
Owner-occupied
Renter-occupied

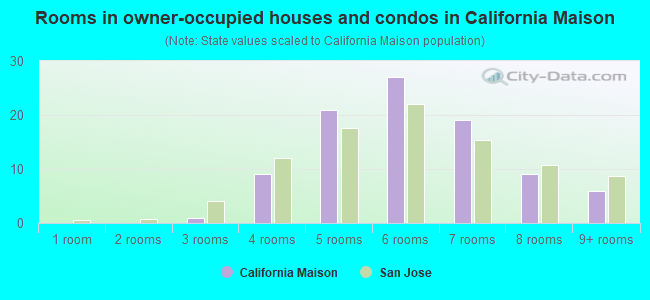
- Rooms in owner-occupied houses and condos in California Maison
- 01 room
- 02 rooms
- 13 rooms
- 94 rooms
- 215 rooms
- 276 rooms
- 197 rooms
- 98 rooms
- 69+ rooms
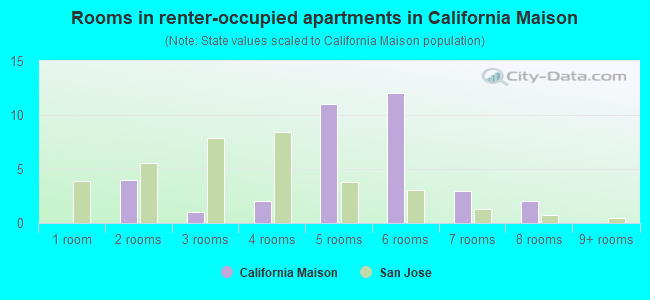
- Rooms in renter-occupied apartments in California Maison
- 01 room
- 42 rooms
- 13 rooms
- 24 rooms
- 115 rooms
- 126 rooms
- 37 rooms
- 28 rooms
- 09+ rooms
Owner-occupied
Renter-occupied
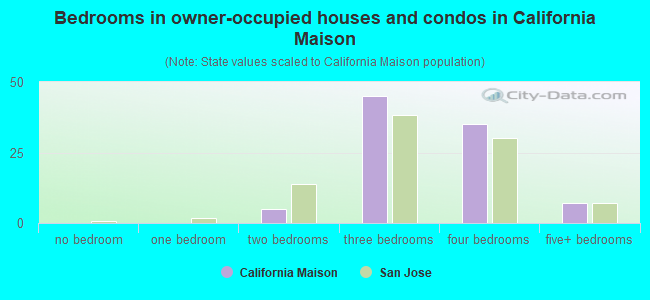
- Bedrooms in owner-occupied houses and condos in California Maison
- 0no bedroom
- 01 bedroom
- 52 bedrooms
- 453 bedrooms
- 354 bedrooms
- 75+ bedrooms
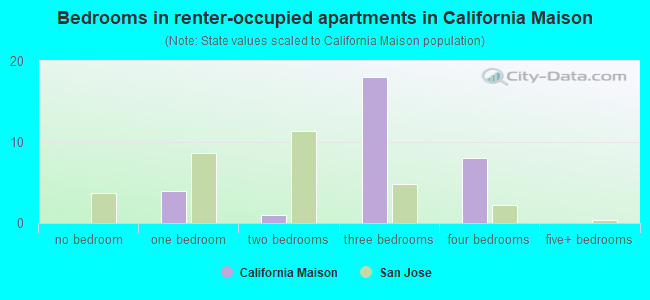
- Bedrooms in renter-occupied apartments in California Maison
- 0no bedroom
- 41 bedroom
- 12 bedrooms
- 183 bedrooms
- 84 bedrooms
- 05+ bedrooms
Average number of cars or other vehicles available in houses/condos:
Average number of cars or other vehicles available in apartments:
| This neighborhood: | 2.6 |
| San Jose: | 2.3 |
Average number of cars or other vehicles available in apartments:
| Here: | 3.7 |
| city: | 1.6 |
Percentage of units with a mortgage:
| California Maison: | 83.2% |
| San Jose: | 66.9% |
Housing prices:
- Average estimated value of detached houses in 2022 (85.2% of all units):
California Maison: $1,519,263 San Jose: $1,532,815
- Average estimated value of townhouses or other attached units in 2022 (13.3% of all units):
This neighborhood: $796,023 city: $1,024,857
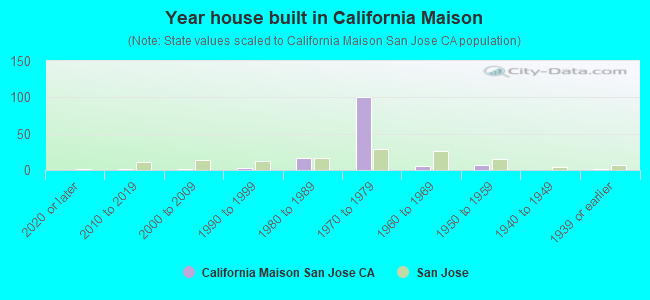
- Year house built in California Maison
- 02020 or later
- 12010 to 2019
- 12000 to 2009
- 31990 to 1999
- 171980 to 1989
- 1001970 to 1979
- 51960 to 1969
- 71950 to 1959
- 01940 to 1949
- 21939 or earlier
City-data.com crime index for city in 2020 (higher means more crime):
| City: | 268.4 |
| U.S. average: | 219.5 |
Travel time to work (commute)
![Travel time to work (commute)]()
- 4Less than 5 minutes
- 85 to 9 minutes
- 1310 to 14 minutes
- 1815 to 19 minutes
- 2020 to 24 minutes
- 1525 to 29 minutes
- 3130 to 34 minutes
- 635 to 39 minutes
- 1640 to 44 minutes
- 3345 to 59 minutes
- 460 to 89 minutes
- 790 or more minutes

Means of transportation to work
![Means of transportation to work]()
- 78.0%166Drove a car alone
- 9.9%21Carpooled
- 0.9%2Bus
- 5.2%11Light rail, streetcar or trolley
- 0.9%2Motorcycle
- 1.4%3Bicycle
- 0.5%1Other means
- 10.3%22Worked at home

Time leaving home to go to work
![Time leaving home to go to work]()
- 1712:00 a.m. to 4:59 a.m.
- 95:00 a.m. to 5:29 a.m.
- 45:30 a.m. to 5:59 a.m.
- 226:00 a.m. to 6:29 a.m.
- 76:30 a.m. to 6:59 a.m.
- 297:00 a.m. to 7:29 a.m.
- 107:30 a.m. to 7:59 a.m.
- 288:00 a.m. to 8:29 a.m.
- 108:30 a.m. to 8:59 a.m.
- 99:00 a.m. to 9:59 a.m.
- 610:00 a.m. to 10:59 a.m.
- 711:00 a.m. to 11:59 a.m.
- 712:00 p.m. to 3:59 p.m.
- 144:00 p.m. to 11:59 p.m.

Occupations of males:
- Percentage of males in management occupations (except farmers):
Here: 17.0% city: 13.0%
- Percentage of males in business and financial operations occupations:
Here: 3.4% city: 4.6%
- Percentage of males in computer and mathematical occupations:
Here: 3.9% city: 13.6%
- Percentage of males in architecture and engineering occupations:
Here: 7.5% city: 10.2%
- Percentage of males in community and social services occupations:
Here: 3.4% city: 0.8%
- Percentage of males in education, training, and library occupations:
Here: 5.8% city: 2.8%
- Percentage of males in arts, design, entertainment, sports, and media occupations:
Here: 1.0% city: 1.8%
- Percentage of males in healthcare practitioners and technical occupations:
Here: 2.8% city: 2.0%
- Percentage of males in service occupations:
Here: 7.6% city: 12.7%
- Percentage of males in sales and office occupations:
Here: 15.1% city: 12.8%
- Percentage of males in construction, extraction, and maintenance occupations:
Here: 8.3% city: 7.8%
- Percentage of males in production occupations:
Here: 5.4% city: 5.5%
- Percentage of males in transportation occupations:
Here: 11.9% city: 3.6%
- Percentage of males in material moving occupations:
Here: 2.6% city: 3.1%
Occupations of females:
- Percentage of females in management occupations (except farmers):
Here: 7.5% city: 11.0%
- Percentage of females in business and financial operations occupations:
Here: 7.7% city: 8.6%
- Percentage of females in computer and mathematical occupations:
Here: 2.0% city: 5.4%
- Percentage of females in architecture and engineering occupations:
Here: 3.2% city: 2.8%
- Percentage of females in education, training, and library occupations:
Here: 26.9% city: 8.1%
- Percentage of females in arts, design, entertainment, sports, and media occupations:
Here: 3.1% city: 2.0%
- Percentage of females in healthcare practitioners and technical occupations:
Here: 2.9% city: 6.8%
- Percentage of females in service occupations:
Here: 28.7% city: 21.7%
- Percentage of females in sales and office occupations:
Here: 19.7% city: 22.0%
- Percentage of females in production occupations:
Here: 3.9% city: 4.0%
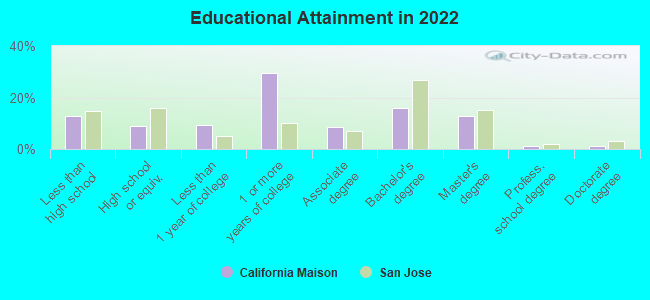
Education in this neighborhood (subdivision or community):
- Percentage of people 3 years and older in K-12 schools:
California Maison: 22.3% San Jose: 16.1%
- Percentage of people 3 years and older in undergraduate colleges:
California Maison: 3.6% San Jose: 6.5%
- Percentage of people 3 years and older in grad. or professional schools:
California Maison: 1.4% San Jose: 2.0%
- Percentage of students K-12 enrolled in private schools:
California Maison: 61.6% San Jose: 14.9%
Percentage of population below poverty level:
| California Maison: | 4.8% |
| San Jose: | 9.0% |
Median year owner moved in (as recorded in 2022):
Median year renter moved in (as recorded in 2022):
| California Maison: | 2005 |
| San Jose: | 2008 |
Median year renter moved in (as recorded in 2022):
| California Maison: | 2014 |
| San Jose: | 2020 |
Percentage of married-couple families with both working:
| California Maison: | 96.8% |
| San Jose: | 72.5% |
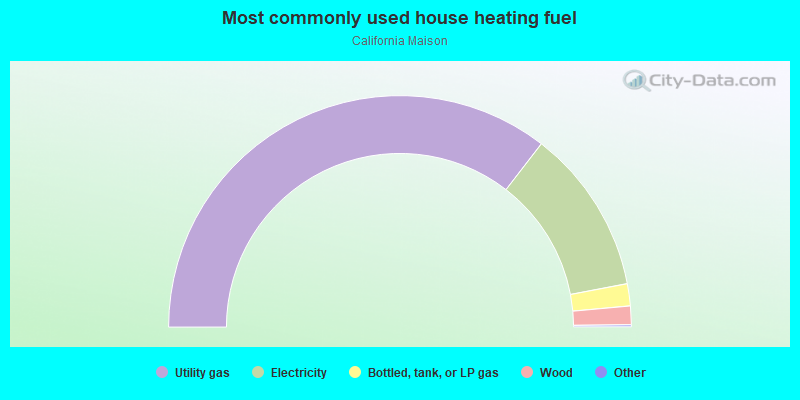
- 71.0%Utility gas
- 23.1%Electricity
- 3.1%Bottled, tank, or LP gas
- 2.6%Wood
Highways in this neighborhood:
US Hwy 101 Bus (State Hwy 82, Monterey Hwy, Monterey Rd)
Length: 0.32 miles
Direction: SE-NW
Address range: 6000 to 6649
Direction: SE-NW
Address range: 6000 to 6649
Roads and streets:
Forsum Rd
Length: 0.49 miles
Directions: N-S, SE-NW, SW-NE
Address range: 7300 to 7499
Directions: N-S, SE-NW, SW-NE
Address range: 7300 to 7499
Prindiville Dr
Length: 0.36 miles
Directions: E-W, N-S, SE-NW, SW-NE
Address range: 7300 to 7499
Directions: E-W, N-S, SE-NW, SW-NE
Address range: 7300 to 7499
Urshan Way
Length: 0.33 miles
Directions: E-W, N-S, SE-NW, SW-NE
Address range: 7200 to 7399
Directions: E-W, N-S, SE-NW, SW-NE
Address range: 7200 to 7399
Rodling Dr
Length: 0.32 miles
Directions: E-W, N-S, SE-NW, SW-NE
Address range: 6900 to 7999
Directions: E-W, N-S, SE-NW, SW-NE
Address range: 6900 to 7999
Gregorich Dr
Length: 0.19 miles
Directions: E-W, N-S, SE-NW, SW-NE
Address range: 6900 to 7999
Directions: E-W, N-S, SE-NW, SW-NE
Address range: 6900 to 7999
Menard Dr
Length: 0.09 miles
Direction: SW-NE
Address range: 100 to 199
Direction: SW-NE
Address range: 100 to 199
Urshan Ct
Length: 0.07 miles
Direction: SW-NE
Address range: 100 to 199
Direction: SW-NE
Address range: 100 to 199
Forsum Ct
Length: 0.06 miles
Directions: E-W, N-S, SW-NE
Address range: 100 to 199
Directions: E-W, N-S, SW-NE
Address range: 100 to 199
Rodling Way
Length: 0.05 miles
Direction: SW-NE
Direction: SW-NE
Yasui Ct
Length: 0.03 miles
Directions: E-W, N-S, SW-NE
Address range: 101 to 199
Directions: E-W, N-S, SW-NE
Address range: 101 to 199
Felice Ct
Length: 0.03 miles
Direction: SW-NE
Address range: 100 to 199
Direction: SW-NE
Address range: 100 to 199
Prindiville Ct
Length: 0.03 miles
Direction: SW-NE
Address range: 100 to 199
Direction: SW-NE
Address range: 100 to 199