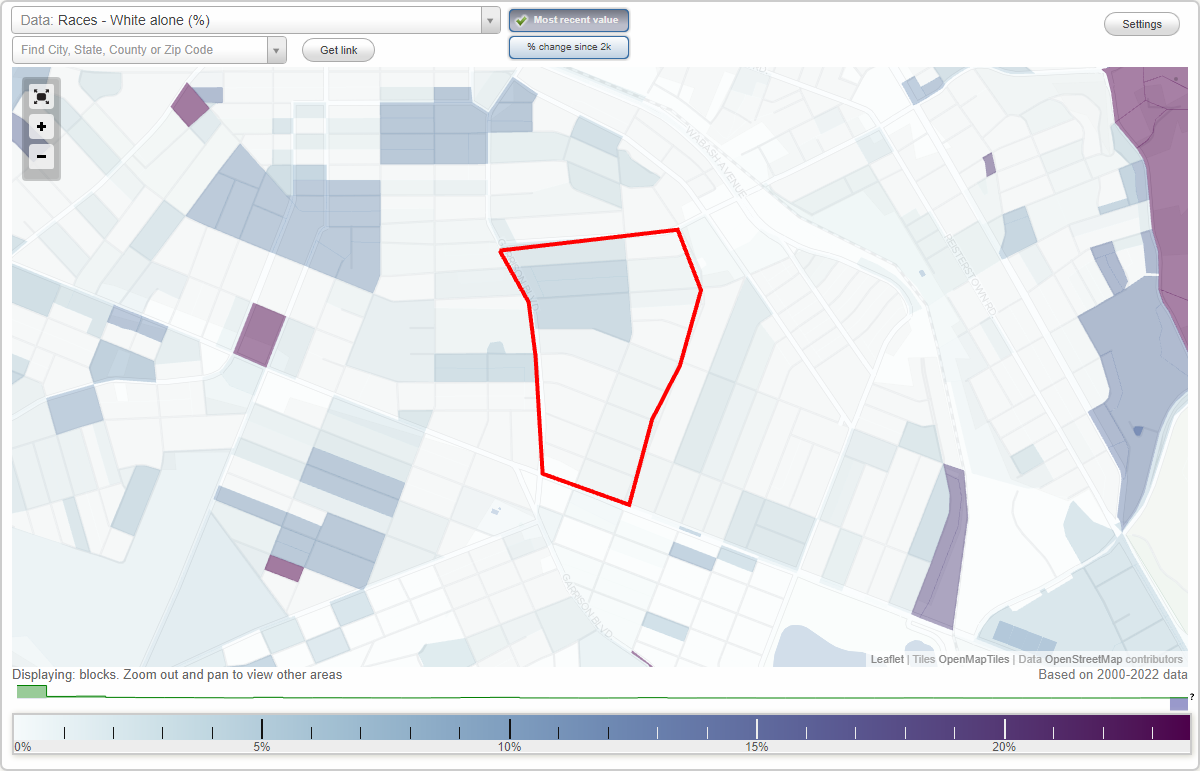
Callaway-Garrison neighborhood in Baltimore, Maryland (MD), 21215 detailed profile
Settings
X

Business Search - 14 Million verified businesses
Area: 0.185 square miles
Population: 2,723
Population density:
| Callaway-Garrison: | 14,708 people per square mile |
| Baltimore: | 7,053 people per square mile |

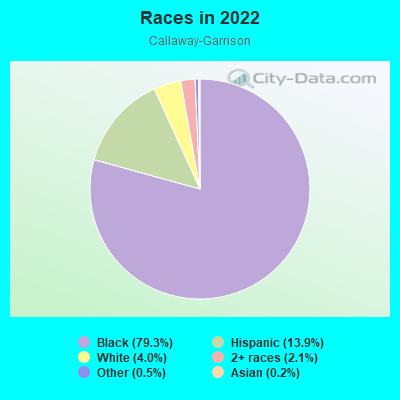
- 2,40879.3%Black
- 42213.9%Hispanic or Latino
- 1224.0%White
- 632.1%Two or more races
- 150.5%Some other race
- 60.2%Asian
- 10.03%Native Hawaiian and Other
Pacific Islander
Distribution of median household income
![Distribution of median household income]()
- 127Less than $10,000
- 286$10,000 to $19,999
- 125$20,000 to $29,999
- 71$30,000 to $39,999
- 386$40,000 to $49,999
- 129$50,000 to $59,999
- 294$60,000 to $74,999
- 81$75,000 to $99,999
- 27$100,000 to $124,999
- 37$125,000 to $149,999
- 70$150,000 to $199,999
- 216$200,000 or more

Distribution of owner-occupied house/condo value
![Distribution of owner-occupied house/condo value]()
- 174Less than $50,000
- 136$50,000 to $99,999
- 98$100,000 to $149,999
- 684$150,000 to $199,999
- 236$200,000 to $249,999
- 89$250,000 to $299,999
- 177$300,000 to $399,999
- 22$400,000 to $499,999
- 16$500,000 to $749,999
- 24$750,000 to $999,999

Distribution of rent paid by renters
![Distribution of rent paid by renters]()
- 35Less than $100
- 28$100 to $199
- 133$500 to $599
- 230$600 to $699
- 118$700 to $799
- 56$800 to $899
- 105$900 to $999
- 119$1,000 to $1,249
- 82$1,250 to $1,499
- 10$1,500 to $1,999

| Males: | 1,272 |
| Females: | 1,450 |
Males:
| This neighborhood: | 47.7 years |
| Whole city: | 35.0 years |
| This neighborhood: | 46.9 years |
| Whole city: | 38.2 years |
Average household size:
| Callaway-Garrison: | 10.5 people |
| Baltimore: | 2.2 people |
Percentage of family households:
| Callaway-Garrison: | 39.0% |
| Baltimore: | 34.2% |
| Here: | 40.8% |
| Baltimore: | 23.3% |
Percentage of married-couple families with children (among all households):
| Callaway-Garrison: | 19.9% |
| Baltimore: | 22.4% |
Percentage of single-mother households (among all households):
| Callaway-Garrison: | 30.8% |
| Baltimore: | 18.7% |
Percentage of never married males 15 years old and over:
Percentage of never married females 15 years old and over:
| Callaway-Garrison: | 23.1% |
| Baltimore: | 25.1% |
Percentage of never married females 15 years old and over:
| Callaway-Garrison: | 28.0% |
| city: | 27.5% |
Percentage of people that speak English not well or not at all:
| Callaway-Garrison: | 0.1% |
| Baltimore: | 2.3% |
Percentage of people born in this state:
Percentage of people born in another U.S. state:
Percentage of native residents but born outside the U.S.:
Percentage of foreign born residents:
| Here: | 78.2% |
| Baltimore: | 64.4% |
Percentage of people born in another U.S. state:
| Callaway-Garrison: | 18.4% |
| Baltimore: | 25.0% |
Percentage of native residents but born outside the U.S.:
| Here: | 0.4% |
| city: | 0.9% |
Percentage of foreign born residents:
| Here: | 3.0% |
| Baltimore: | 9.7% |
Owner-occupied
Renter-occupied

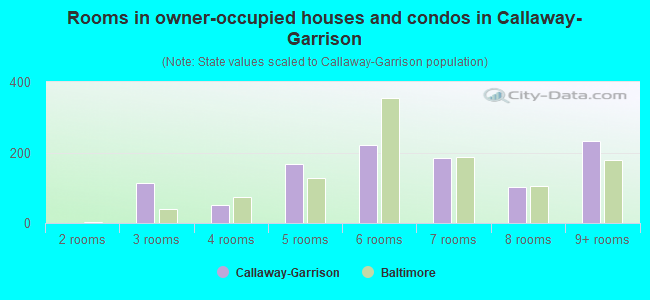
- Rooms in owner-occupied houses and condos in Callaway-Garrison
- 01 room
- 02 rooms
- 1143 rooms
- 514 rooms
- 1675 rooms
- 2206 rooms
- 1857 rooms
- 1038 rooms
- 2349+ rooms
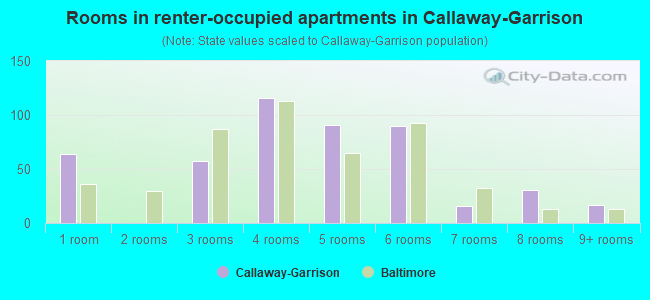
- Rooms in renter-occupied apartments in Callaway-Garrison
- 641 room
- 02 rooms
- 573 rooms
- 1164 rooms
- 915 rooms
- 906 rooms
- 167 rooms
- 318 rooms
- 179+ rooms
Owner-occupied
Renter-occupied
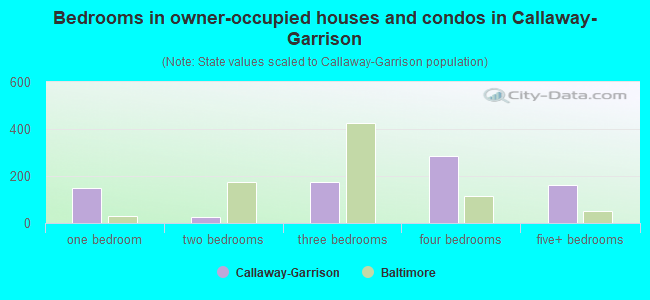
- Bedrooms in owner-occupied houses and condos in Callaway-Garrison
- 1no bedroom
- 1471 bedroom
- 252 bedrooms
- 1763 bedrooms
- 2834 bedrooms
- 1625+ bedrooms
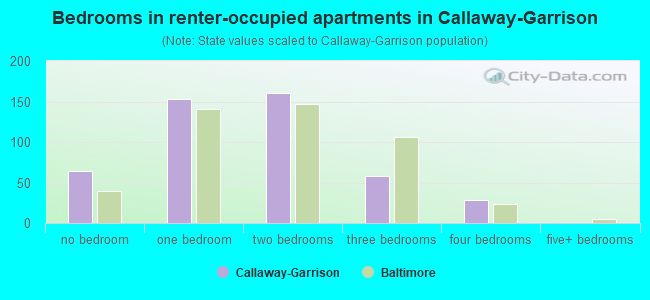
- Bedrooms in renter-occupied apartments in Callaway-Garrison
- 64no bedroom
- 1531 bedroom
- 1602 bedrooms
- 583 bedrooms
- 294 bedrooms
- 05+ bedrooms
Average number of cars or other vehicles available in houses/condos:
Average number of cars or other vehicles available in apartments:
| This neighborhood: | 1.2 |
| Baltimore: | 1.5 |
Average number of cars or other vehicles available in apartments:
| Here: | 1.0 |
| city: | 0.8 |
Percentage of units with a mortgage:
| Callaway-Garrison: | 73.4% |
| Baltimore: | 64.3% |
Average estimated value of detached houses in 2022 (70.8% of all units):
| Callaway-Garrison: | $242,130 |
| Baltimore: | $350,815 |
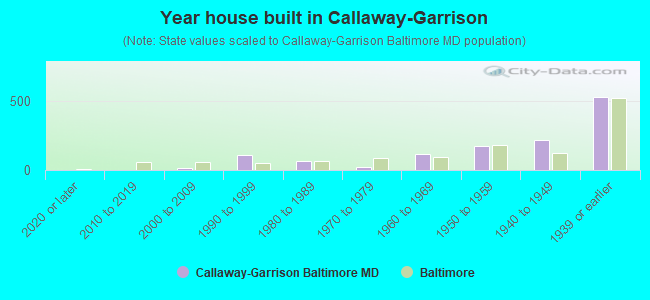
- Year house built in Callaway-Garrison
- 02020 or later
- 02010 to 2019
- 132000 to 2009
- 1101990 to 1999
- 641980 to 1989
- 191970 to 1979
- 1201960 to 1969
- 1751950 to 1959
- 2211940 to 1949
- 5301939 or earlier
Travel time to work (commute)
![Travel time to work (commute)]()
- 35Less than 5 minutes
- 105 to 9 minutes
- 1610 to 14 minutes
- 19515 to 19 minutes
- 15520 to 24 minutes
- 6325 to 29 minutes
- 14030 to 34 minutes
- 2935 to 39 minutes
- 2040 to 44 minutes
- 10145 to 59 minutes
- 3360 to 89 minutes
- 8990 or more minutes

Means of transportation to work
![Means of transportation to work]()
- 62.0%756Drove a car alone
- 14.8%181Carpooled
- 12.4%151Bus
- 8.9%109Subway or elevated rail
- 0.6%7Light rail, streetcar or trolley
- 5.5%67Walked
- 4.5%55Other means
- 13.9%169Worked at home

Time leaving home to go to work
![Time leaving home to go to work]()
- 7612:00 a.m. to 4:59 a.m.
- 265:00 a.m. to 5:29 a.m.
- 595:30 a.m. to 5:59 a.m.
- 586:00 a.m. to 6:29 a.m.
- 336:30 a.m. to 6:59 a.m.
- 1287:00 a.m. to 7:29 a.m.
- 697:30 a.m. to 7:59 a.m.
- 938:00 a.m. to 8:29 a.m.
- 978:30 a.m. to 8:59 a.m.
- 499:00 a.m. to 9:59 a.m.
- 1210:00 a.m. to 10:59 a.m.
- 2111:00 a.m. to 11:59 a.m.
- 5712:00 p.m. to 3:59 p.m.
- 984:00 p.m. to 11:59 p.m.

Occupations of males:
- Percentage of males in management occupations (except farmers):
Here: 18.4% city: 10.7%
- Percentage of males in business and financial operations occupations:
Here: 11.3% city: 5.9%
- Percentage of males in community and social services occupations:
Here: 15.6% city: 1.6%
- Percentage of males in education, training, and library occupations:
Here: 1.4% city: 5.4%
- Percentage of males in arts, design, entertainment, sports, and media occupations:
Here: 3.1% city: 2.8%
- Percentage of males in service occupations:
Here: 10.3% city: 14.7%
- Percentage of males in sales and office occupations:
Here: 3.0% city: 14.2%
- Percentage of males in construction, extraction, and maintenance occupations:
Here: 7.8% city: 5.6%
- Percentage of males in production occupations:
Here: 1.6% city: 4.2%
- Percentage of males in transportation occupations:
Here: 22.0% city: 6.8%
- Percentage of males in material moving occupations:
Here: 9.6% city: 7.0%
Occupations of females:
- Percentage of females in management occupations (except farmers):
Here: 25.6% city: 10.1%
- Percentage of females in business and financial operations occupations:
Here: 2.6% city: 6.6%
- Percentage of females in computer and mathematical occupations:
Here: 3.9% city: 2.4%
- Percentage of females in life, physical, and social science occupations:
Here: 1.2% city: 2.5%
- Percentage of females in community and social services occupations:
Here: 4.4% city: 3.6%
- Percentage of females in legal occupations:
Here: 3.4% city: 1.8%
- Percentage of females in education, training, and library occupations:
Here: 8.1% city: 10.7%
- Percentage of females in arts, design, entertainment, sports, and media occupations:
Here: 1.3% city: 2.4%
- Percentage of females in healthcare practitioners and technical occupations:
Here: 10.8% city: 9.8%
- Percentage of females in service occupations:
Here: 22.6% city: 20.4%
- Percentage of females in sales and office occupations:
Here: 17.5% city: 22.3%
- Percentage of females in production occupations:
Here: 5.0% city: 2.3%
- Percentage of females in material moving occupations:
Here: 1.2% city: 1.9%
Education in this neighborhood (subdivision or community):
- Percentage of people 3 years and older in K-12 schools:
Callaway-Garrison: 27.3% Baltimore: 14.7%
- Percentage of people 3 years and older in undergraduate colleges:
Callaway-Garrison: 9.1% Baltimore: 6.0%
- Percentage of people 3 years and older in grad. or professional schools:
Callaway-Garrison: 11.0% Baltimore: 2.8%
- Percentage of students K-12 enrolled in private schools:
Callaway-Garrison: 28.0% Baltimore: 12.7%
Percentage of population below poverty level:
| Callaway-Garrison: | 19.1% |
| Baltimore: | 18.5% |
Median year owner moved in (as recorded in 2022):
| Callaway-Garrison: | 2004 |
| Baltimore: | 2009 |
Percentage of married-couple families with both working:
| Callaway-Garrison: | 100.0% |
| Baltimore: | 79.2% |
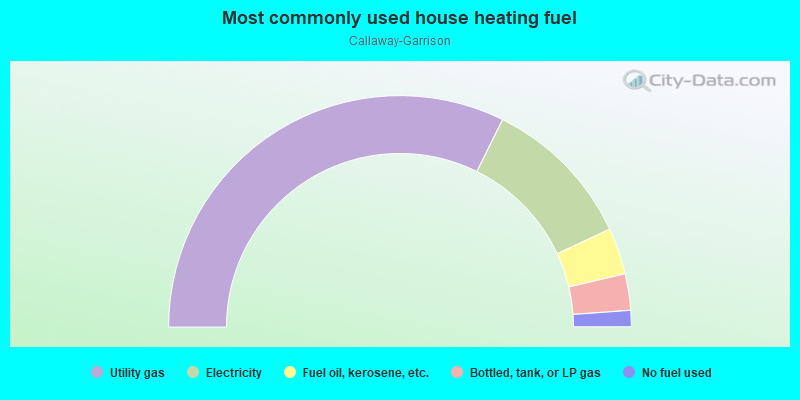
- 64.7%Utility gas
- 21.5%Electricity
- 6.5%Fuel oil, kerosene, etc.
- 5.1%Bottled, tank, or LP gas
- 2.3%No fuel used
Roads and streets:
Belle Ave
Length: 0.51 miles
Direction: E-W
Address range: 3700 to 3999
Direction: E-W
Address range: 3700 to 3999
Ayrdale Ave
Length: 0.49 miles
Directions: N-S, SW-NE
Address range: 3406 to 4021
Directions: N-S, SW-NE
Address range: 3406 to 4021
Sequoia Ave
Length: 0.44 miles
Direction: E-W
Address range: 3700 to 3899
Direction: E-W
Address range: 3700 to 3899
Barrington Rd
Length: 0.39 miles
Direction: E-W
Address range: 3700 to 3899
Direction: E-W
Address range: 3700 to 3899
Garrison Blvd
Length: 0.35 miles
Directions: N-S, SE-NW
Address range: 3600 to 3999
Directions: N-S, SE-NW
Address range: 3600 to 3999
Boarman Ave
Length: 0.34 miles
Direction: E-W
Address range: 3800 to 3999
Direction: E-W
Address range: 3800 to 3999
Dorchester Rd
Length: 0.31 miles
Direction: E-W
Address range: 3700 to 3899
Direction: E-W
Address range: 3700 to 3899
Callaway Ave
Length: 0.22 miles
Direction: SW-NE
Address range: 3406 to 3812
Direction: SW-NE
Address range: 3406 to 3812
Chatham Rd
Length: 0.20 miles
Direction: E-W
Address range: 3800 to 3899
Direction: E-W
Address range: 3800 to 3899
Yosemite Ave
Length: 0.18 miles
Direction: E-W
Address range: 3700 to 3799
Direction: E-W
Address range: 3700 to 3799
Egerton Rd
Length: 0.16 miles
Direction: E-W
Address range: 3700 to 3799
Direction: E-W
Address range: 3700 to 3799