Canton Industrial Area neighborhood in Baltimore, Maryland (MD), 21224 detailed profile
Settings
X

Business Search - 14 Million verified businesses
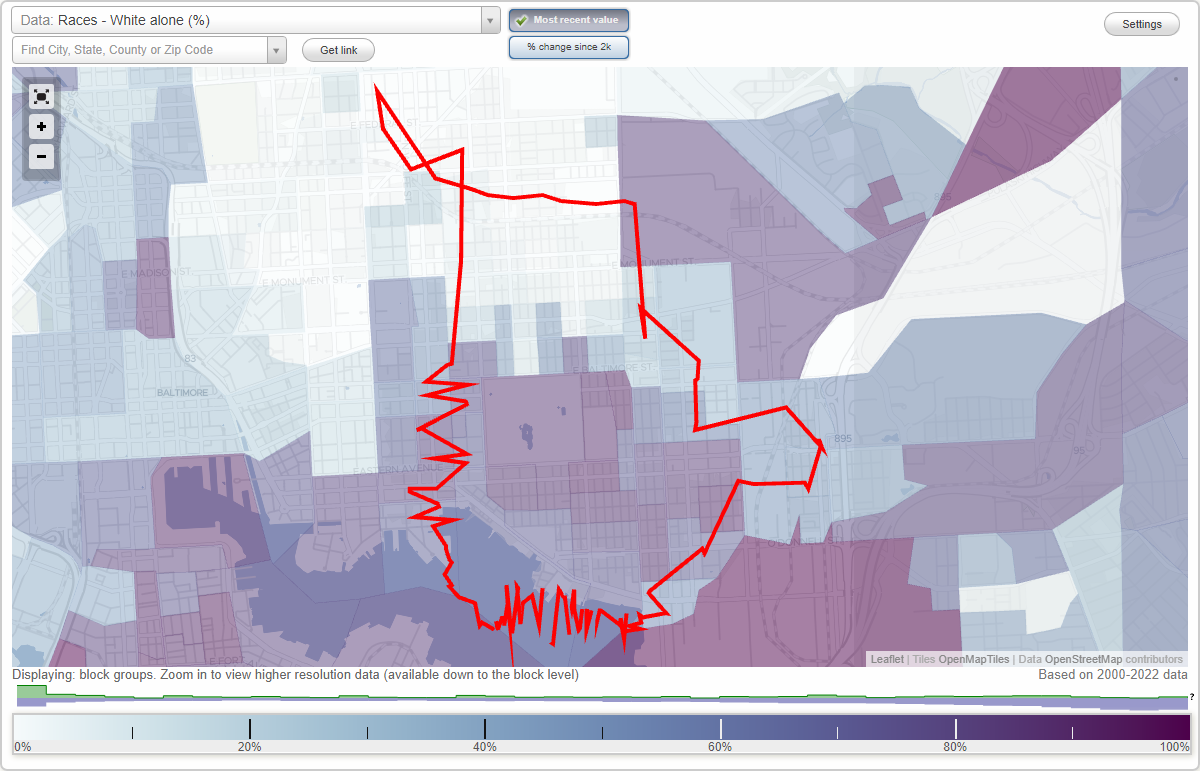
Area: 2.262 square miles
Population: 2,494
Population density:
| Canton Industrial Area: | 1,102 people per square mile |
| Baltimore: | 7,053 people per square mile |

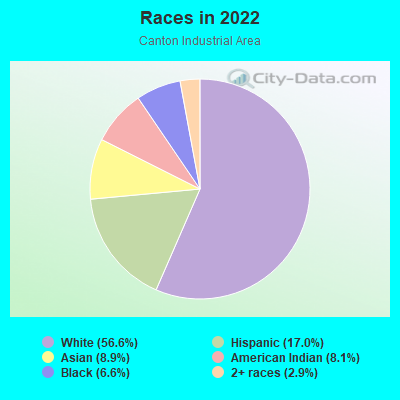
- 1,53456.6%White
- 46117.0%Hispanic or Latino
- 2418.9%Asian
- 2208.1%American Indian
- 1786.6%Black
- 782.9%Two or more races
Median household income in 2022:
| Canton Industrial Area: | $73,127 |
| Baltimore: | $55,198 |
Distribution of median household income
![Distribution of median household income]()
- 38Less than $10,000
- 346$10,000 to $19,999
- 36$20,000 to $29,999
- 35$30,000 to $39,999
- 106$40,000 to $49,999
- 24$50,000 to $59,999
- 66$60,000 to $74,999
- 138$75,000 to $99,999
- 242$100,000 to $124,999
- 114$125,000 to $149,999
- 170$150,000 to $199,999
- 194$200,000 or more

Distribution of owner-occupied house/condo value
![Distribution of owner-occupied house/condo value]()
- 1,105Less than $50,000
- 1,118$50,000 to $99,999
- 104$100,000 to $149,999
- 160$150,000 to $199,999
- 207$200,000 to $249,999
- 708$250,000 to $299,999
- 234$300,000 to $399,999
- 1,235$400,000 to $499,999
- 154$500,000 to $749,999
- 67$750,000 to $999,999
- 2$1,000,000 or more

Distribution of rent paid by renters
![Distribution of rent paid by renters]()
- 2,227$100 to $199
- 474$300 to $399
- 2,475$400 to $499
- 330$500 to $599
- 485$600 to $699
- 901$700 to $799
- 35$800 to $899
- 37$900 to $999
- 58$1,000 to $1,249
- 537$1,250 to $1,499
- 1,111$1,500 to $1,999
- 7,987$2,000 or more

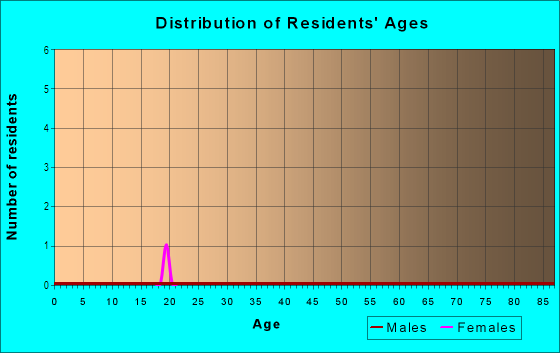
| Males: | 1,313 |
| Females: | 1,180 |
Males:
| This neighborhood: | 36.6 years |
| Whole city: | 35.0 years |
| This neighborhood: | 33.4 years |
| Whole city: | 38.2 years |
Average household size:
| Canton Industrial Area: | 6.5 people |
| Baltimore: | 2.2 people |
Percentage of family households:
| Canton Industrial Area: | 31.3% |
| Baltimore: | 34.2% |
| Here: | 24.9% |
| Baltimore: | 23.3% |
Percentage of married-couple families with children (among all households):
| Canton Industrial Area: | 33.9% |
| Baltimore: | 22.4% |
Percentage of single-mother households (among all households):
| Canton Industrial Area: | 11.1% |
| Baltimore: | 18.7% |
Percentage of never married males 15 years old and over:
Percentage of never married females 15 years old and over:
| Canton Industrial Area: | 31.1% |
| Baltimore: | 25.1% |
Percentage of never married females 15 years old and over:
| Canton Industrial Area: | 27.8% |
| city: | 27.5% |
Percentage of people that speak English not well or not at all:
| Canton Industrial Area: | 1.2% |
| Baltimore: | 2.3% |
Percentage of people born in this state:
Percentage of people born in another U.S. state:
Percentage of native residents but born outside the U.S.:
Percentage of foreign born residents:
| Here: | 50.6% |
| Baltimore: | 64.4% |
Percentage of people born in another U.S. state:
| Canton Industrial Area: | 26.5% |
| Baltimore: | 25.0% |
Percentage of native residents but born outside the U.S.:
| Here: | 5.6% |
| city: | 0.9% |
Percentage of foreign born residents:
| Here: | 17.4% |
| Baltimore: | 9.7% |
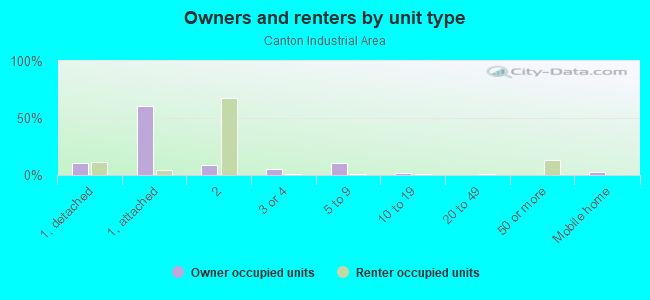
Owner-occupied
Renter-occupied

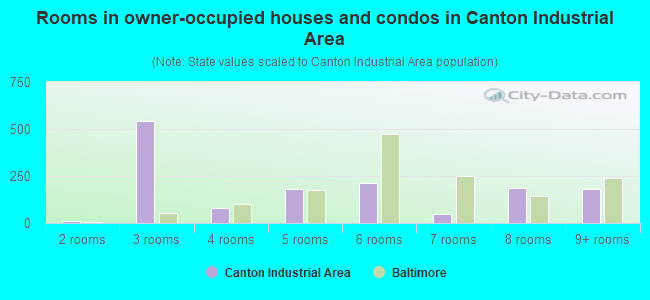
- Rooms in owner-occupied houses and condos in Canton Industrial Area
- 01 room
- 112 rooms
- 5423 rooms
- 804 rooms
- 1815 rooms
- 2146 rooms
- 507 rooms
- 1868 rooms
- 1809+ rooms
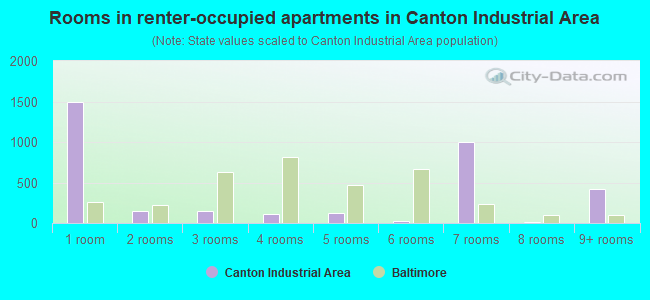
- Rooms in renter-occupied apartments in Canton Industrial Area
- 1,4991 room
- 1472 rooms
- 1443 rooms
- 1164 rooms
- 1265 rooms
- 246 rooms
- 9997 rooms
- 138 rooms
- 4239+ rooms
Owner-occupied
Renter-occupied
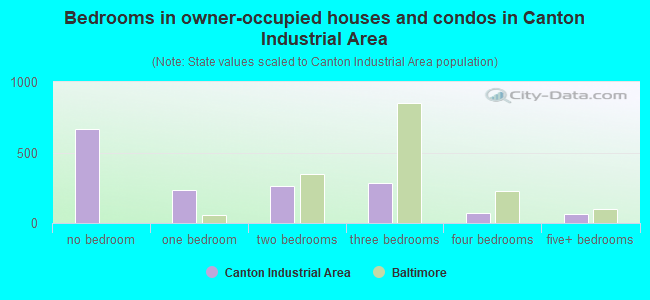
- Bedrooms in owner-occupied houses and condos in Canton Industrial Area
- 667no bedroom
- 2361 bedroom
- 2612 bedrooms
- 2843 bedrooms
- 744 bedrooms
- 635+ bedrooms
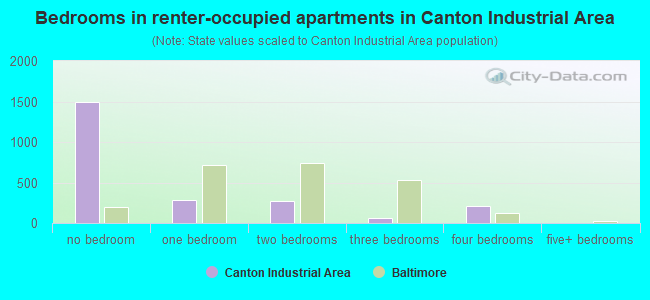
- Bedrooms in renter-occupied apartments in Canton Industrial Area
- 1,499no bedroom
- 2851 bedroom
- 2672 bedrooms
- 613 bedrooms
- 2164 bedrooms
- 45+ bedrooms
Average number of cars or other vehicles available in houses/condos:
Average number of cars or other vehicles available in apartments:
| This neighborhood: | 1.5 |
| Baltimore: | 1.5 |
Average number of cars or other vehicles available in apartments:
| Here: | 1.3 |
| city: | 0.8 |
Percentage of units with a mortgage:
| Canton Industrial Area: | 88.8% |
| Baltimore: | 64.3% |
Housing prices:
- Average estimated value of detached houses in 2022 (6.2% of all units):
Canton Industrial Area: $253,938 Baltimore: $350,815
- Average estimated value of townhouses or other attached units in 2022 (51.2% of all units):
This neighborhood: $112,327 city: $206,258
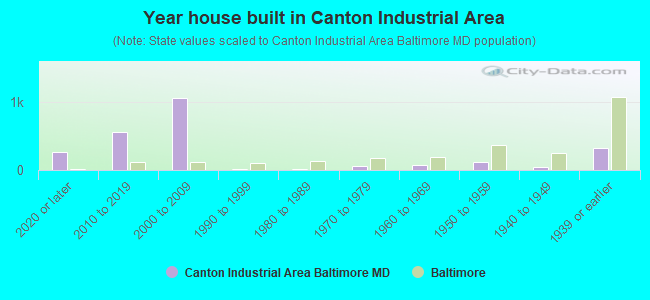
- Year house built in Canton Industrial Area
- 2702020 or later
- 5562010 to 2019
- 1,0662000 to 2009
- 181990 to 1999
- 201980 to 1989
- 551970 to 1979
- 811960 to 1969
- 1111950 to 1959
- 421940 to 1949
- 3301939 or earlier
Travel time to work (commute)
![Travel time to work (commute)]()
- 9Less than 5 minutes
- 465 to 9 minutes
- 4910 to 14 minutes
- 16115 to 19 minutes
- 10720 to 24 minutes
- 5125 to 29 minutes
- 11430 to 34 minutes
- 1735 to 39 minutes
- 1840 to 44 minutes
- 8745 to 59 minutes
- 6160 to 89 minutes
- 2990 or more minutes

Means of transportation to work
![Means of transportation to work]()
- 70.9%1,184Drove a car alone
- 5.7%95Carpooled
- 2.0%33Bus
- 21.8%365Long-distance train or commuter rail
- 1.4%24Light rail, streetcar or trolley
- 67.7%1,132Ferryboat
- 32.7%546Taxi
- 8.4%141Motorcycle
- 77.8%1,300Bicycle
- 1.1%19Walked
- 16.4%274Other means
- 227.1%3,795Worked at home

Time leaving home to go to work
![Time leaving home to go to work]()
- 3512:00 a.m. to 4:59 a.m.
- 295:00 a.m. to 5:29 a.m.
- 355:30 a.m. to 5:59 a.m.
- 776:00 a.m. to 6:29 a.m.
- 366:30 a.m. to 6:59 a.m.
- 1117:00 a.m. to 7:29 a.m.
- 977:30 a.m. to 7:59 a.m.
- 1158:00 a.m. to 8:29 a.m.
- 818:30 a.m. to 8:59 a.m.
- 329:00 a.m. to 9:59 a.m.
- 1910:00 a.m. to 10:59 a.m.
- 311:00 a.m. to 11:59 a.m.
- 3112:00 p.m. to 3:59 p.m.
- 284:00 p.m. to 11:59 p.m.

Occupations of males:
- Percentage of males in management occupations (except farmers):
Here: 12.6% city: 10.7%
- Percentage of males in business and financial operations occupations:
Here: 9.2% city: 5.9%
- Percentage of males in computer and mathematical occupations:
Here: 6.1% city: 6.1%
- Percentage of males in architecture and engineering occupations:
Here: 6.1% city: 2.9%
- Percentage of males in life, physical, and social science occupations:
Here: 1.4% city: 2.3%
- Percentage of males in legal occupations:
Here: 4.8% city: 1.8%
- Percentage of males in arts, design, entertainment, sports, and media occupations:
Here: 5.0% city: 2.8%
- Percentage of males in healthcare practitioners and technical occupations:
Here: 6.5% city: 4.0%
- Percentage of males in service occupations:
Here: 2.9% city: 14.7%
- Percentage of males in sales and office occupations:
Here: 21.4% city: 14.2%
- Percentage of males in construction, extraction, and maintenance occupations:
Here: 3.6% city: 5.6%
- Percentage of males in production occupations:
Here: 1.7% city: 4.2%
- Percentage of males in transportation occupations:
Here: 3.3% city: 6.8%
Occupations of females:
- Percentage of females in management occupations (except farmers):
Here: 13.5% city: 10.1%
- Percentage of females in business and financial operations occupations:
Here: 15.5% city: 6.6%
- Percentage of females in computer and mathematical occupations:
Here: 3.8% city: 2.4%
- Percentage of females in architecture and engineering occupations:
Here: 5.0% city: 0.9%
- Percentage of females in life, physical, and social science occupations:
Here: 1.3% city: 2.5%
- Percentage of females in community and social services occupations:
Here: 1.4% city: 3.6%
- Percentage of females in education, training, and library occupations:
Here: 4.4% city: 10.7%
- Percentage of females in arts, design, entertainment, sports, and media occupations:
Here: 2.0% city: 2.4%
- Percentage of females in healthcare practitioners and technical occupations:
Here: 32.4% city: 9.8%
- Percentage of females in service occupations:
Here: 7.3% city: 20.4%
- Percentage of females in sales and office occupations:
Here: 9.7% city: 22.3%
- Percentage of females in production occupations:
Here: 2.1% city: 2.3%
Percentage of people 16-64 in Armed Forces:
| Canton Industrial Area: | 0.1% |
| Baltimore: | 0.4% |
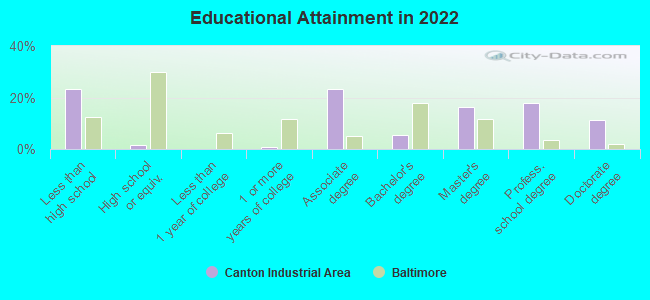
Education in this neighborhood (subdivision or community):
- Percentage of people 3 years and older in K-12 schools:
Canton Industrial Area: 56.3% Baltimore: 14.7%
- Percentage of people 3 years and older in undergraduate colleges:
Canton Industrial Area: 6.9% Baltimore: 6.0%
- Percentage of people 3 years and older in grad. or professional schools:
Canton Industrial Area: 18.1% Baltimore: 2.8%
- Percentage of students K-12 enrolled in private schools:
Canton Industrial Area: 124.5% Baltimore: 12.7%
Percentage of population below poverty level:
| Canton Industrial Area: | 16.2% |
| Baltimore: | 18.5% |
Median year renter moved in (as recorded in 2022):
| Canton Industrial Area: | 2014 |
| Baltimore: | 2019 |
Percentage of married-couple families with both working:
| Canton Industrial Area: | 46.5% |
| Baltimore: | 79.2% |
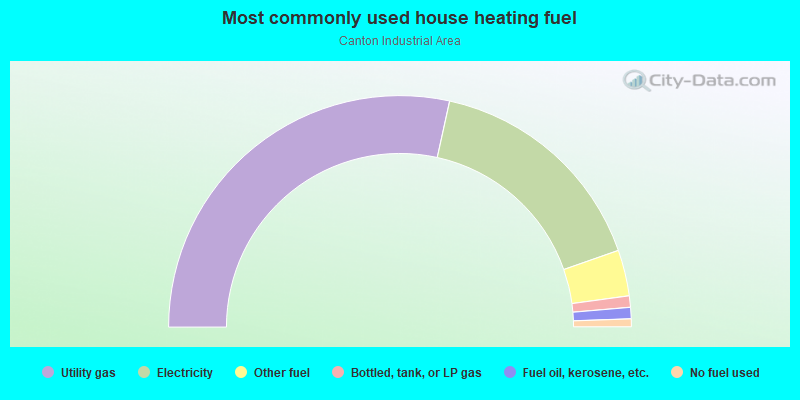
- 56.8%Utility gas
- 32.3%Electricity
- 6.4%Other fuel
- 1.6%Bottled, tank, or LP gas
- 1.6%Fuel oil, kerosene, etc.
- 1.1%No fuel used
Limited-access highways (interstate or state) in this neighborhood:
Fort McHenry Tunl (I- 95)
Length: 3.48 miles
Directions: E-W, N-S, SW-NE
Directions: E-W, N-S, SW-NE
I- 895 (Harbor Tunnel Throughway)
Length: 3.35 miles
Directions: N-S, SE-NW, SW-NE
Directions: N-S, SE-NW, SW-NE
Roads and streets:
S Newkirk St
Length: 1.44 miles
Direction: N-S
Address range: 1100 to 2599
Direction: N-S
Address range: 1100 to 2599
Broening Hwy
Length: 1.30 miles
Directions: E-W, N-S, SE-NW
Address range: 1459 to 2699
Directions: E-W, N-S, SE-NW
Address range: 1459 to 2699
Holabird Ave
Length: 1.22 miles
Directions: E-W, N-S, SW-NE
Address range: 4776 to 6099
Directions: E-W, N-S, SW-NE
Address range: 4776 to 6099
Boston St
Length: 1.17 miles
Directions: E-W, SE-NW, SW-NE
Address range: 3600 to 5057
Directions: E-W, SE-NW, SW-NE
Address range: 3600 to 5057
Newgate Ave
Length: 1.16 miles
Directions: E-W, N-S, SE-NW, SW-NE
Address range: 3600 to 4699
Directions: E-W, N-S, SE-NW, SW-NE
Address range: 3600 to 4699
S Clinton St
Length: 1.13 miles
Direction: N-S
Address range: 1400 to 2599
Direction: N-S
Address range: 1400 to 2599
S Haven St
Length: 0.95 miles
Directions: E-W, N-S, SE-NW
Address range: 1000 to 1798
Directions: E-W, N-S, SE-NW
Address range: 1000 to 1798
S Ponca St
Length: 0.95 miles
Directions: N-S, SE-NW, SW-NE
Address range: 1200 to 2599
Directions: N-S, SE-NW, SW-NE
Address range: 1200 to 2599
O Donnell St
Length: 0.93 miles
Direction: E-W
Address range: 3710 to 5399
Direction: E-W
Address range: 3710 to 5399
S Baylis St
Length: 0.73 miles
Directions: E-W, N-S, SE-NW, SW-NE
Address range: 1500 to 2499
Directions: E-W, N-S, SE-NW, SW-NE
Address range: 1500 to 2499
Cardiff Ave
Length: 0.71 miles
Direction: E-W
Address range: 3200 to 6099
Direction: E-W
Address range: 3200 to 6099
Keith Ave
Length: 0.67 miles
Directions: E-W, N-S, SE-NW, SW-NE
Address range: 4600 to 4899
Directions: E-W, N-S, SE-NW, SW-NE
Address range: 4600 to 4899
Ibsen Ave
Length: 0.30 miles
Directions: E-W, N-S, SE-NW
Address range: 4200 to 4799
Directions: E-W, N-S, SE-NW
Address range: 4200 to 4799
S Kresson St
Length: 0.25 miles
Directions: E-W, N-S, SE-NW
Address range: 300 to 999
Directions: E-W, N-S, SE-NW
Address range: 300 to 999
Eastern Ave
Length: 0.20 miles
Direction: E-W
Address range: 4300 to 4499
Direction: E-W
Address range: 4300 to 4499
Danville Ave
Length: 0.17 miles
Direction: E-W
Address range: 3200 to 4199
Direction: E-W
Address range: 3200 to 4199
S Janney St
Length: 0.17 miles
Directions: N-S, SW-NE
Address range: 400 to 499
Directions: N-S, SW-NE
Address range: 400 to 499
Poncabird Pass
Length: 0.17 miles
Direction: SE-NW
Address range: 1700 to 1799
Direction: SE-NW
Address range: 1700 to 1799
Eastbourne Ave
Length: 0.16 miles
Direction: E-W
Address range: 3200 to 3499
Direction: E-W
Address range: 3200 to 3499
Rappolla St
Length: 0.16 miles
Directions: N-S, SE-NW
Address range: 1600 to 1799
Directions: N-S, SE-NW
Address range: 1600 to 1799
Leland Ave
Length: 0.16 miles
Direction: E-W
Address range: 3500 to 4099
Direction: E-W
Address range: 3500 to 4099
Savage St
Length: 0.13 miles
Directions: N-S, SW-NE
Address range: 1600 to 1799
Directions: N-S, SW-NE
Address range: 1600 to 1799
Gough St
Length: 0.12 miles
Direction: E-W
Address range: 4200 to 4399
Direction: E-W
Address range: 4200 to 4399
Mertens Ave
Length: 0.12 miles
Directions: E-W, SW-NE
Directions: E-W, SW-NE
Dillon St
Length: 0.10 miles
Directions: E-W, SE-NW
Address range: 4100 to 4219
Directions: E-W, SE-NW
Address range: 4100 to 4219
S Highland Ave
Length: 0.08 miles
Direction: N-S
Address range: 2300 to 2399
Direction: N-S
Address range: 2300 to 2399
Toone St
Length: 0.08 miles
Direction: E-W
Address range: 4900 to 4999
Direction: E-W
Address range: 4900 to 4999
Vail St
Length: 0.08 miles
Direction: N-S
Address range: 1700 to 1799
Direction: N-S
Address range: 1700 to 1799
Forty Foot St
Length: 0.07 miles
Direction: E-W
Address range: 3200 to 3299
Direction: E-W
Address range: 3200 to 3299
Hudson St
Length: 0.07 miles
Directions: E-W, SW-NE
Address range: 4200 to 4299
Directions: E-W, SW-NE
Address range: 4200 to 4299
Bank St
Length: 0.05 miles
Directions: E-W, SW-NE
Address range: 4300 to 4399
Directions: E-W, SW-NE
Address range: 4300 to 4399
Odonnell Street Cutoff
Length: 0.03 miles
Direction: E-W
Direction: E-W
Railroad features:
Penn Central RR
Length: 23.11 miles
Directions: E-W, N-S, SE-NW, SW-NE
Directions: E-W, N-S, SE-NW, SW-NE
Baltimore and Ohio RR
Length: 2.09 miles
Directions: E-W, N-S, SE-NW, SW-NE
Directions: E-W, N-S, SE-NW, SW-NE