Capitol Heights neighborhood in Des Moines, Iowa (IA), 50317 detailed profile
Settings
X

Business Search - 14 Million verified businesses
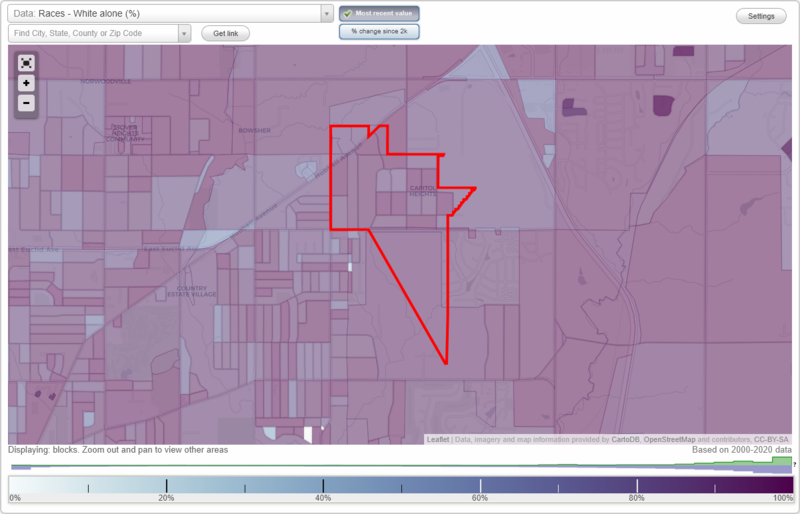
Area: 0.507 square miles
Population: 2,580
Population density:
| Capitol Heights: | 5,092 people per square mile |
| Des Moines: | 2,783 people per square mile |

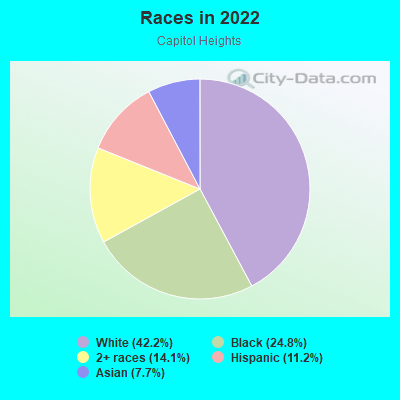
- 1,17942.2%White
- 69224.8%Black
- 39514.1%Two or more races
- 31311.2%Hispanic or Latino
- 2147.7%Asian
Median household income in 2022:
| Capitol Heights: | $56,150 |
| Des Moines: | $58,018 |
Distribution of median household income
![Distribution of median household income]()
- 171Less than $10,000
- 152$10,000 to $19,999
- 100$20,000 to $29,999
- 126$30,000 to $39,999
- 133$40,000 to $49,999
- 60$50,000 to $59,999
- 85$60,000 to $74,999
- 119$75,000 to $99,999
- 31$100,000 to $124,999
- 31$125,000 to $149,999
- 44$150,000 to $199,999
- 90$200,000 or more

Distribution of owner-occupied house/condo value
![Distribution of owner-occupied house/condo value]()
- 51Less than $50,000
- 22$50,000 to $99,999
- 72$100,000 to $149,999
- 90$150,000 to $199,999
- 17$200,000 to $249,999
- 25$250,000 to $299,999
- 9$300,000 to $399,999
- 15$500,000 to $749,999

Distribution of rent paid by renters
![Distribution of rent paid by renters]()
- 20$200 to $299
- 20$300 to $399
- 21$400 to $499
- 23$500 to $599
- 8$600 to $699
- 255$700 to $799
- 194$800 to $899
- 99$900 to $999
- 236$1,000 to $1,249
- 9$1,250 to $1,499
- 25$1,500 to $1,999

Median rent in 2022:
| Capitol Heights: | $875 |
| Des Moines: | $873 |
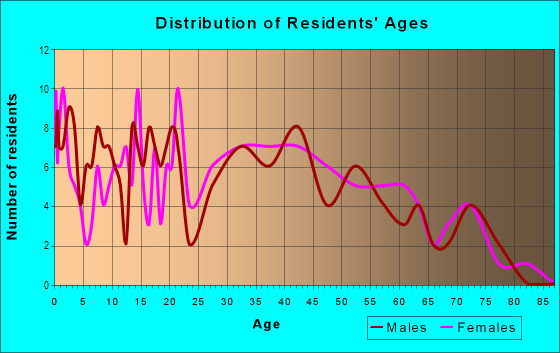
| Males: | 1,228 |
| Females: | 1,351 |
Males:
| This neighborhood: | 32.6 years |
| Whole city: | 34.7 years |
| This neighborhood: | 33.8 years |
| Whole city: | 35.5 years |
Average household size:
| Capitol Heights: | 2.5 people |
| Des Moines: | 2.2 people |
Percentage of family households:
| Capitol Heights: | 46.4% |
| Des Moines: | 40.8% |
| Here: | 19.1% |
| Des Moines: | 32.7% |
Percentage of married-couple families with children (among all households):
| Capitol Heights: | 9.4% |
| Des Moines: | 26.2% |
Percentage of single-mother households (among all households):
| Capitol Heights: | 28.1% |
| Des Moines: | 14.0% |
Percentage of never married males 15 years old and over:
Percentage of never married females 15 years old and over:
| Capitol Heights: | 23.0% |
| Des Moines: | 21.4% |
Percentage of never married females 15 years old and over:
| Capitol Heights: | 21.9% |
| city: | 19.3% |
Percentage of people that speak English not well or not at all:
| Capitol Heights: | 7.1% |
| Des Moines: | 5.0% |
Percentage of people born in this state:
Percentage of people born in another U.S. state:
Percentage of native residents but born outside the U.S.:
Percentage of foreign born residents:
| Here: | 62.0% |
| Des Moines: | 64.1% |
Percentage of people born in another U.S. state:
| Capitol Heights: | 20.5% |
| Des Moines: | 19.2% |
Percentage of native residents but born outside the U.S.:
| Here: | 2.3% |
| city: | 0.5% |
Percentage of foreign born residents:
| Here: | 15.2% |
| Des Moines: | 16.2% |
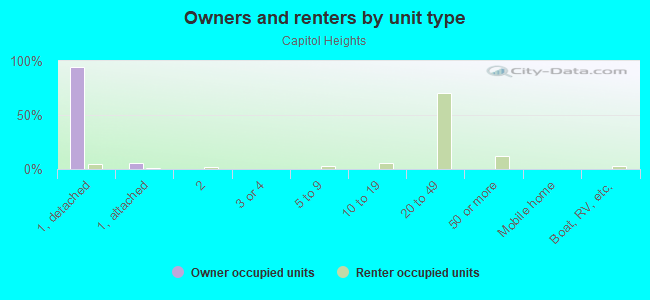
Owner-occupied
Renter-occupied

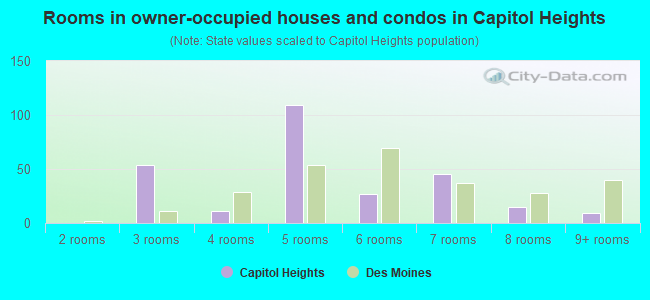
- Rooms in owner-occupied houses and condos in Capitol Heights
- 01 room
- 02 rooms
- 543 rooms
- 114 rooms
- 1095 rooms
- 276 rooms
- 457 rooms
- 158 rooms
- 99+ rooms
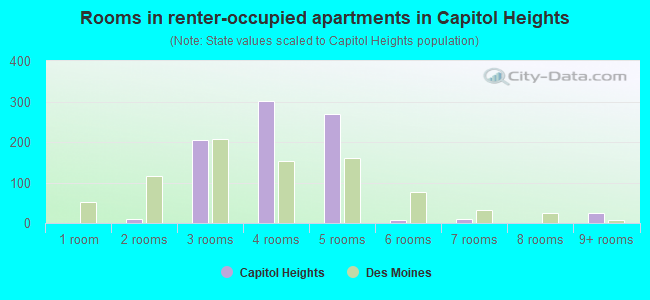
- Rooms in renter-occupied apartments in Capitol Heights
- 01 room
- 102 rooms
- 2063 rooms
- 3024 rooms
- 2695 rooms
- 76 rooms
- 97 rooms
- 08 rooms
- 249+ rooms
Owner-occupied
Renter-occupied
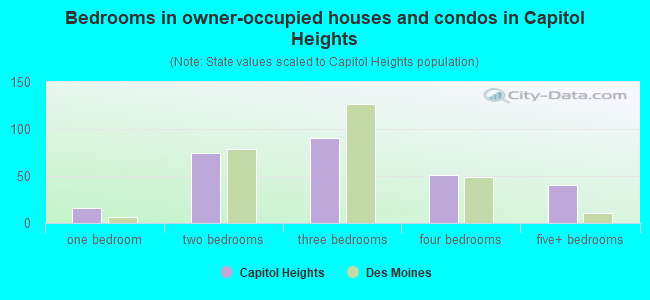
- Bedrooms in owner-occupied houses and condos in Capitol Heights
- 0no bedroom
- 161 bedroom
- 752 bedrooms
- 903 bedrooms
- 514 bedrooms
- 405+ bedrooms
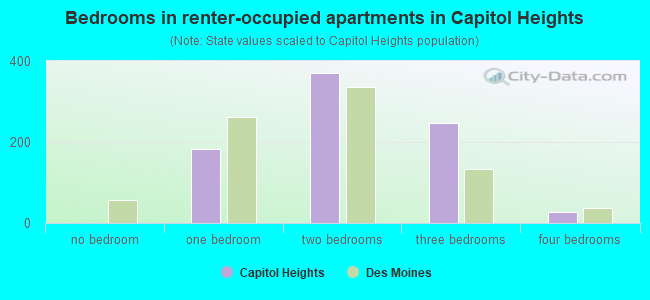
- Bedrooms in renter-occupied apartments in Capitol Heights
- 0no bedroom
- 1831 bedroom
- 3712 bedrooms
- 2463 bedrooms
- 284 bedrooms
- 05+ bedrooms
Average number of cars or other vehicles available in houses/condos:
Average number of cars or other vehicles available in apartments:
| This neighborhood: | 2.0 |
| Des Moines: | 1.9 |
Average number of cars or other vehicles available in apartments:
| Here: | 1.0 |
| city: | 1.2 |
Percentage of units with a mortgage:
| Capitol Heights: | 73.3% |
| Des Moines: | 69.7% |
Housing prices:
- Average estimated value of detached houses in 2022 (20.2% of all units):
Capitol Heights: $173,461 Des Moines: $201,532
- Average estimated value of townhouses or other attached units in 2022 (1.7% of all units):
This neighborhood: $129,083 city: $241,703
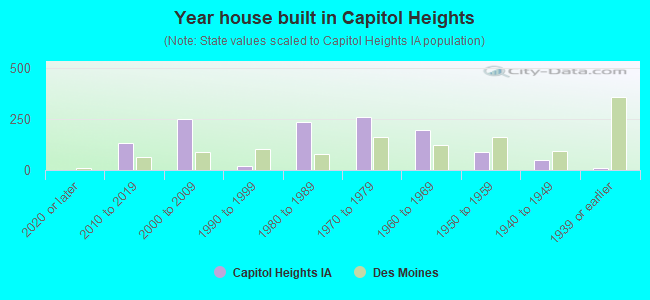
- Year house built in Capitol Heights
- 02020 or later
- 1342010 to 2019
- 2512000 to 2009
- 211990 to 1999
- 2371980 to 1989
- 2611970 to 1979
- 1941960 to 1969
- 871950 to 1959
- 471940 to 1949
- 111939 or earlier
City-data.com crime index for city in 2020 (higher means more crime):
| City: | 422.4 |
| U.S. average: | 219.5 |
Travel time to work (commute)
![Travel time to work (commute)]()
- 78Less than 5 minutes
- 985 to 9 minutes
- 27210 to 14 minutes
- 23915 to 19 minutes
- 30120 to 24 minutes
- 10725 to 29 minutes
- 5630 to 34 minutes
- 3235 to 39 minutes
- 2740 to 44 minutes
- 345 to 59 minutes
- 2060 to 89 minutes
- 1090 or more minutes

Means of transportation to work
![Means of transportation to work]()
- 73.3%776Drove a car alone
- 16.0%169Carpooled
- 2.0%21Bus
- 7.2%76Taxi
- 2.3%24Bicycle
- 1.3%14Walked
- 2.2%23Other means
- 6.4%68Worked at home

Time leaving home to go to work
![Time leaving home to go to work]()
- 412:00 a.m. to 4:59 a.m.
- 655:00 a.m. to 5:29 a.m.
- 1015:30 a.m. to 5:59 a.m.
- 1516:00 a.m. to 6:29 a.m.
- 1566:30 a.m. to 6:59 a.m.
- 457:00 a.m. to 7:29 a.m.
- 1117:30 a.m. to 7:59 a.m.
- 658:00 a.m. to 8:29 a.m.
- 188:30 a.m. to 8:59 a.m.
- 399:00 a.m. to 9:59 a.m.
- 3910:00 a.m. to 10:59 a.m.
- 3211:00 a.m. to 11:59 a.m.
- 18112:00 p.m. to 3:59 p.m.
- 1324:00 p.m. to 11:59 p.m.

Occupations of males:
- Percentage of males in management occupations (except farmers):
Here: 2.2% city: 9.3%
- Percentage of males in computer and mathematical occupations:
Here: 1.6% city: 6.0%
- Percentage of males in architecture and engineering occupations:
Here: 1.8% city: 2.3%
- Percentage of males in education, training, and library occupations:
Here: 4.7% city: 2.1%
- Percentage of males in service occupations:
Here: 20.0% city: 13.1%
- Percentage of males in sales and office occupations:
Here: 9.9% city: 15.2%
- Percentage of males in farming, fishing, and forestry occupations:
Here: 3.6% city: 0.3%
- Percentage of males in construction, extraction, and maintenance occupations:
Here: 15.9% city: 10.0%
- Percentage of males in production occupations:
Here: 20.5% city: 9.9%
- Percentage of males in transportation occupations:
Here: 1.4% city: 6.3%
- Percentage of males in material moving occupations:
Here: 13.2% city: 7.2%
Occupations of females:
- Percentage of females in management occupations (except farmers):
Here: 4.4% city: 8.5%
- Percentage of females in architecture and engineering occupations:
Here: 2.2% city: 0.6%
- Percentage of females in life, physical, and social science occupations:
Here: 1.5% city: 0.7%
- Percentage of females in legal occupations:
Here: 1.9% city: 1.3%
- Percentage of females in education, training, and library occupations:
Here: 9.0% city: 7.0%
- Percentage of females in healthcare practitioners and technical occupations:
Here: 2.4% city: 7.6%
- Percentage of females in service occupations:
Here: 26.7% city: 23.4%
- Percentage of females in sales and office occupations:
Here: 22.5% city: 27.7%
- Percentage of females in construction, extraction, and maintenance occupations:
Here: 2.4% city: 0.5%
- Percentage of females in production occupations:
Here: 22.6% city: 5.0%
- Percentage of females in material moving occupations:
Here: 3.7% city: 2.1%
Percentage of people 16-64 in Armed Forces:
| Capitol Heights: | 1.3% |
| Des Moines: | 0.1% |
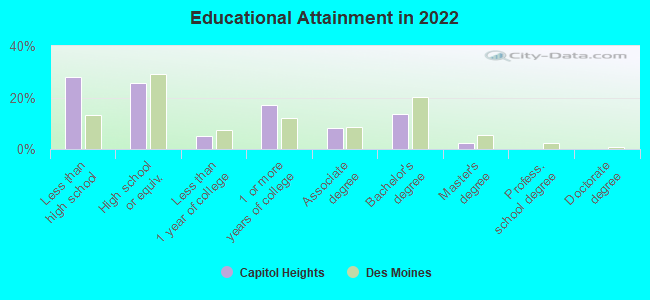
Education in this neighborhood (subdivision or community):
- Percentage of people 3 years and older in K-12 schools:
Capitol Heights: 31.7% Des Moines: 17.5%
- Percentage of people 3 years and older in undergraduate colleges:
Capitol Heights: 1.2% Des Moines: 3.7%
- Percentage of people 3 years and older in grad. or professional schools:
Capitol Heights: 1.3% Des Moines: 1.6%
- Percentage of students K-12 enrolled in private schools:
Capitol Heights: 23.0% Des Moines: 6.9%
Percentage of population below poverty level:
| Capitol Heights: | 37.2% |
| Des Moines: | 14.7% |
Median year owner moved in (as recorded in 2022):
Median year renter moved in (as recorded in 2022):
| Capitol Heights: | 2012 |
| Des Moines: | 2011 |
Median year renter moved in (as recorded in 2022):
| Capitol Heights: | 2016 |
| Des Moines: | 2020 |
Percentage of married-couple families with both working:
| Capitol Heights: | 76.4% |
| Des Moines: | 73.4% |
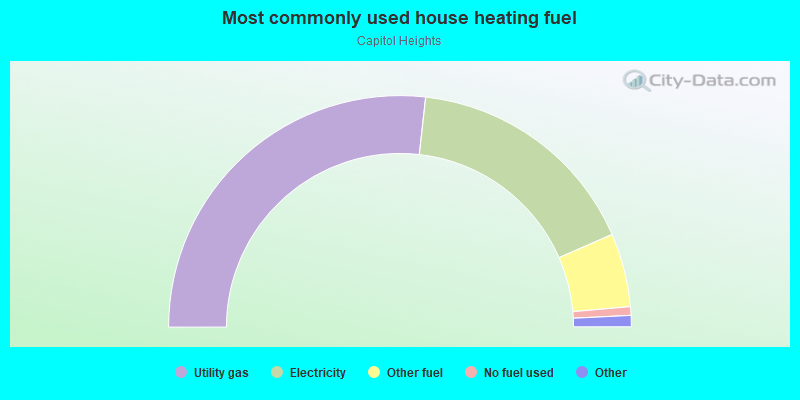
- 53.6%Utility gas
- 33.4%Electricity
- 10.3%Other fuel
- 1.2%No fuel used
- 1.0%Bottled, tank, or LP gas
- 0.6%Wood
Highways in this neighborhood:
Hubbell Ave (NE Hubbell Ave, US Hwy 6)
Length: 0.09 miles
Direction: SW-NE
Address range: 4302 to 4304
Direction: SW-NE
Address range: 4302 to 4304
Roads and streets:
NE 39th Ave
Length: 0.77 miles
Direction: E-W
Address range: 4400 to 4969
Direction: E-W
Address range: 4400 to 4969
NE Aurora Ave (NE 42nd Ave)
Length: 0.71 miles
Directions: E-W, SE-NW
Address range: 4300 to 4798
Directions: E-W, SE-NW
Address range: 4300 to 4798
NE 40th Ave
Length: 0.68 miles
Direction: E-W
Address range: 4400 to 4999
Direction: E-W
Address range: 4400 to 4999
NE 44th Dr
Length: 0.56 miles
Directions: E-W, N-S, SE-NW, SW-NE
Address range: 3816 to 4199
Directions: E-W, N-S, SE-NW, SW-NE
Address range: 3816 to 4199
NE 43rd Street Ct (NE 43rd Ct, NE 43rd St)
Length: 0.54 miles
Directions: N-S, SE-NW
Address range: 3800 to 4251
Directions: N-S, SE-NW
Address range: 3800 to 4251
E Douglas Ave (NE 38th Ave)
Length: 0.52 miles
Direction: E-W
Address range: 4232 to 4399
Direction: E-W
Address range: 4232 to 4399
NE 48th St
Length: 0.50 miles
Direction: N-S
Address range: 3812 to 4199
Direction: N-S
Address range: 3812 to 4199
NE 46th St
Length: 0.50 miles
Direction: N-S
Address range: 3812 to 4199
Direction: N-S
Address range: 3812 to 4199
NE 41st Ave
Length: 0.41 miles
Direction: E-W
Address range: 4490 to 4799
Direction: E-W
Address range: 4490 to 4799
NE 45th Dr
Length: 0.38 miles
Directions: E-W, N-S, SE-NW, SW-NE
Address range: 3900 to 4199
Directions: E-W, N-S, SE-NW, SW-NE
Address range: 3900 to 4199
NE 47th St
Length: 0.31 miles
Direction: N-S
Address range: 3900 to 4099
Direction: N-S
Address range: 3900 to 4099
NE 49th St
Length: 0.15 miles
Direction: N-S
Address range: 3900 to 3999
Direction: N-S
Address range: 3900 to 3999