Castlemont neighborhood in San Jose, California (CA), 95128 detailed profile
Settings
X


Business Search - 14 Million verified businesses
Area: 0.185 square miles
Population: 1,061
Population density:
| Castlemont: | 5,747 people per square mile |
| San Jose: | 5,554 people per square mile |

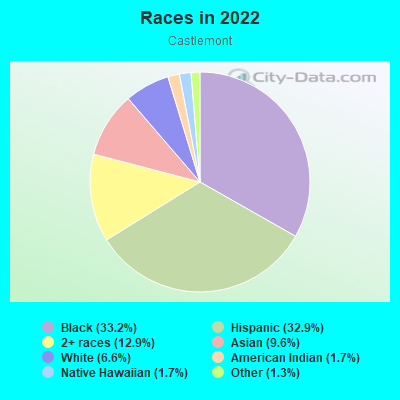
- 45340.2%White
- 30627.2%Hispanic or Latino
- 21819.3%Asian
- 756.7%Black
- 615.4%Two or more races
- 121.1%Some other race
- 20.2%Native Hawaiian and Other
Pacific Islander
Median household income in 2022:
| Castlemont: | $129,252 |
| San Jose: | $133,835 |
Distribution of median household income
![Distribution of median household income]()
- 19Less than $10,000
- 8$10,000 to $19,999
- 41$20,000 to $29,999
- 52$30,000 to $39,999
- 161$40,000 to $49,999
- 39$50,000 to $59,999
- 34$60,000 to $74,999
- 46$75,000 to $99,999
- 42$100,000 to $124,999
- 48$125,000 to $149,999
- 26$150,000 to $199,999
- 156$200,000 or more

Distribution of owner-occupied house/condo value
![Distribution of owner-occupied house/condo value]()
- 37Less than $50,000
- 113$100,000 to $149,999
- 6$400,000 to $499,999
- 87$750,000 to $999,999
- 148$1,000,000 or more

Distribution of rent paid by renters
![Distribution of rent paid by renters]()
- 16$300 to $399
- 58$1,250 to $1,499
- 35$1,500 to $1,999
- 220$2,000 or more

| Males: | 514 |
| Females: | 547 |
Males:
| This neighborhood: | 43.5 years |
| Whole city: | 37.6 years |
| This neighborhood: | 40.4 years |
| Whole city: | 39.1 years |
Average household size:
| Castlemont: | 2.4 people |
| San Jose: | 2.9 people |
Percentage of family households:
| Castlemont: | 45.5% |
| San Jose: | 49.9% |
| Here: | 35.9% |
| San Jose: | 53.0% |
Percentage of married-couple families with children (among all households):
| Castlemont: | 24.8% |
| San Jose: | 25.8% |
Percentage of single-mother households (among all households):
| Castlemont: | 10.6% |
| San Jose: | 5.2% |
Percentage of never married males 15 years old and over:
Percentage of never married females 15 years old and over:
| Castlemont: | 17.7% |
| San Jose: | 20.9% |
Percentage of never married females 15 years old and over:
| Castlemont: | 20.7% |
| city: | 16.7% |
Percentage of people that speak English not well or not at all:
| Castlemont: | 9.7% |
| San Jose: | 11.4% |
Percentage of people born in this state:
Percentage of people born in another U.S. state:
Percentage of native residents but born outside the U.S.:
Percentage of foreign born residents:
| Here: | 48.3% |
| San Jose: | 46.1% |
Percentage of people born in another U.S. state:
| Castlemont: | 16.5% |
| San Jose: | 10.4% |
Percentage of native residents but born outside the U.S.:
| Here: | 1.4% |
| city: | 1.7% |
Percentage of foreign born residents:
| Here: | 33.8% |
| San Jose: | 41.8% |
Owner-occupied
Renter-occupied

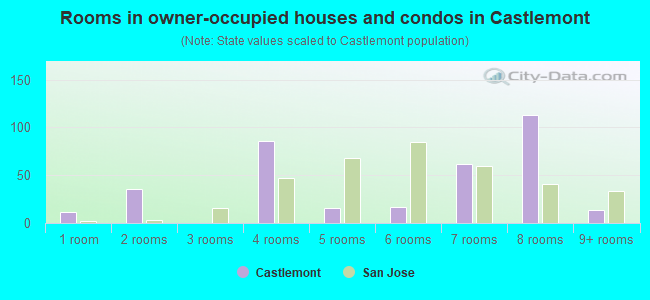
- Rooms in owner-occupied houses and condos in Castlemont
- 121 room
- 362 rooms
- 03 rooms
- 864 rooms
- 165 rooms
- 176 rooms
- 627 rooms
- 1138 rooms
- 149+ rooms
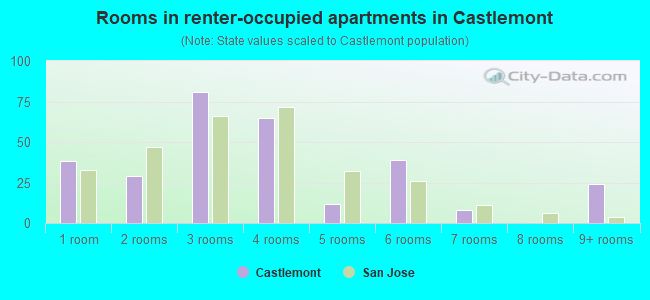
- Rooms in renter-occupied apartments in Castlemont
- 381 room
- 292 rooms
- 813 rooms
- 654 rooms
- 125 rooms
- 396 rooms
- 87 rooms
- 08 rooms
- 249+ rooms
Owner-occupied
Renter-occupied
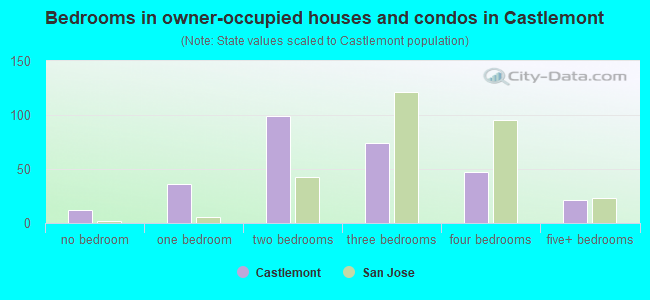
- Bedrooms in owner-occupied houses and condos in Castlemont
- 12no bedroom
- 361 bedroom
- 992 bedrooms
- 743 bedrooms
- 474 bedrooms
- 215+ bedrooms
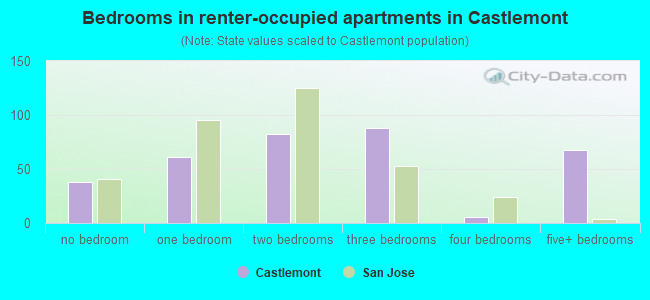
- Bedrooms in renter-occupied apartments in Castlemont
- 38no bedroom
- 611 bedroom
- 822 bedrooms
- 883 bedrooms
- 64 bedrooms
- 685+ bedrooms
Average number of cars or other vehicles available in houses/condos:
Average number of cars or other vehicles available in apartments:
| This neighborhood: | 1.9 |
| San Jose: | 2.3 |
Average number of cars or other vehicles available in apartments:
| Here: | |
| city: |
Percentage of units with a mortgage:
| Castlemont: | 55.1% |
| San Jose: | 66.9% |
Average estimated value of detached houses in 2022 (33.1% of all units):
| Castlemont: | $1,428,247 |
| San Jose: | $1,532,815 |
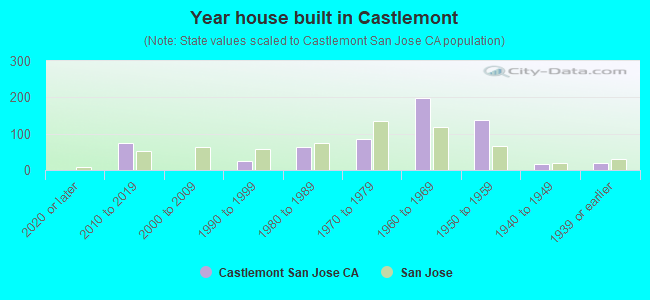
- Year house built in Castlemont
- 02020 or later
- 752010 to 2019
- 02000 to 2009
- 241990 to 1999
- 641980 to 1989
- 841970 to 1979
- 1991960 to 1969
- 1381950 to 1959
- 171940 to 1949
- 181939 or earlier
City-data.com crime index for city in 2020 (higher means more crime):
| City: | 268.4 |
| U.S. average: | 219.5 |
Travel time to work (commute)
![Travel time to work (commute)]()
- 475 to 9 minutes
- 10210 to 14 minutes
- 16415 to 19 minutes
- 19220 to 24 minutes
- 5925 to 29 minutes
- 14430 to 34 minutes
- 235 to 39 minutes
- 2740 to 44 minutes
- 6245 to 59 minutes
- 3360 to 89 minutes
- 4390 or more minutes

Means of transportation to work
![Means of transportation to work]()
- 71.6%339Drove a car alone
- 4.2%20Carpooled
- 2.3%11Bus
- 3.8%18Long-distance train or commuter rail
- 3.8%18Motorcycle
- 4.2%20Bicycle
- 2.5%12Walked
- 3.0%14Other means
- 20.1%95Worked at home

Time leaving home to go to work
![Time leaving home to go to work]()
- 435:00 a.m. to 5:29 a.m.
- 365:30 a.m. to 5:59 a.m.
- 296:00 a.m. to 6:29 a.m.
- 316:30 a.m. to 6:59 a.m.
- 1377:00 a.m. to 7:29 a.m.
- 1287:30 a.m. to 7:59 a.m.
- 1758:00 a.m. to 8:29 a.m.
- 658:30 a.m. to 8:59 a.m.
- 739:00 a.m. to 9:59 a.m.
- 1010:00 a.m. to 10:59 a.m.
- 2411:00 a.m. to 11:59 a.m.
- 6612:00 p.m. to 3:59 p.m.
- 334:00 p.m. to 11:59 p.m.

Occupations of males:
- Percentage of males in management occupations (except farmers):
Here: 13.2% city: 13.0%
- Percentage of males in business and financial operations occupations:
Here: 15.5% city: 4.6%
- Percentage of males in computer and mathematical occupations:
Here: 16.8% city: 13.6%
- Percentage of males in architecture and engineering occupations:
Here: 15.5% city: 10.2%
- Percentage of males in community and social services occupations:
Here: 4.0% city: 0.8%
- Percentage of males in education, training, and library occupations:
Here: 5.6% city: 2.8%
- Percentage of males in healthcare practitioners and technical occupations:
Here: 5.2% city: 2.0%
- Percentage of males in service occupations:
Here: 7.7% city: 12.7%
- Percentage of males in sales and office occupations:
Here: 13.0% city: 12.8%
- Percentage of males in material moving occupations:
Here: 2.6% city: 3.1%
Occupations of females:
- Percentage of females in management occupations (except farmers):
Here: 17.4% city: 11.0%
- Percentage of females in business and financial operations occupations:
Here: 10.3% city: 8.6%
- Percentage of females in computer and mathematical occupations:
Here: 2.3% city: 5.4%
- Percentage of females in life, physical, and social science occupations:
Here: 2.8% city: 1.7%
- Percentage of females in community and social services occupations:
Here: 5.7% city: 1.8%
- Percentage of females in legal occupations:
Here: 4.9% city: 1.3%
- Percentage of females in education, training, and library occupations:
Here: 2.5% city: 8.1%
- Percentage of females in arts, design, entertainment, sports, and media occupations:
Here: 2.9% city: 2.0%
- Percentage of females in healthcare practitioners and technical occupations:
Here: 16.5% city: 6.8%
- Percentage of females in service occupations:
Here: 2.4% city: 21.7%
- Percentage of females in sales and office occupations:
Here: 32.0% city: 22.0%
- Percentage of females in production occupations:
Here: 3.2% city: 4.0%
Percentage of people 16-64 in Armed Forces:
| Castlemont: | 0.2% |
| San Jose: | 0.0% |
Education in this neighborhood (subdivision or community):
- Percentage of people 3 years and older in K-12 schools:
Castlemont: 17.9% San Jose: 16.1%
- Percentage of people 3 years and older in undergraduate colleges:
Castlemont: 3.7% San Jose: 6.5%
- Percentage of people 3 years and older in grad. or professional schools:
Castlemont: 1.9% San Jose: 2.0%
- Percentage of students K-12 enrolled in private schools:
Castlemont: 62.0% San Jose: 14.9%
Percentage of population below poverty level:
| Castlemont: | 5.7% |
| San Jose: | 9.0% |
Median year owner moved in (as recorded in 2022):
| Castlemont: | 2002 |
| San Jose: | 2008 |
Percentage of married-couple families with both working:
| Castlemont: | 92.0% |
| San Jose: | 72.5% |
- 55.4%Utility gas
- 29.4%Electricity
- 7.5%No fuel used
- 4.8%Bottled, tank, or LP gas
- 2.9%Other fuel
Roads and streets:
Greenbriar Ave
Length: 0.52 miles
Directions: E-W, N-S, SE-NW, SW-NE
Address range: 1000 to 1299
Directions: E-W, N-S, SE-NW, SW-NE
Address range: 1000 to 1299
Castlemont Ave
Length: 0.40 miles
Direction: N-S
Address range: 1200 to 1399
Direction: N-S
Address range: 1200 to 1399
Driftwood Dr
Length: 0.30 miles
Directions: E-W, N-S, SE-NW, SW-NE
Address range: 2900 to 3072
Directions: E-W, N-S, SE-NW, SW-NE
Address range: 2900 to 3072
Westfield Ave
Length: 0.25 miles
Direction: E-W
Address range: 2888 to 3099
Direction: E-W
Address range: 2888 to 3099
Payne Ave
Length: 0.22 miles
Direction: E-W
Address range: 3000 to 3066
Direction: E-W
Address range: 3000 to 3066
Fireside Dr
Length: 0.20 miles
Direction: E-W
Address range: 2900 to 3047
Direction: E-W
Address range: 2900 to 3047
Woodlawn Ave
Length: 0.19 miles
Directions: N-S, SW-NE
Address range: 1200 to 1299
Directions: N-S, SW-NE
Address range: 1200 to 1299
Redoaks Dr
Length: 0.18 miles
Direction: N-S
Address range: 1100 to 1299
Direction: N-S
Address range: 1100 to 1299
Neet Ave
Length: 0.18 miles
Directions: E-W, N-S, SW-NE
Address range: 2900 to 3099
Directions: E-W, N-S, SW-NE
Address range: 2900 to 3099
Greentree Way
Length: 0.17 miles
Directions: E-W, N-S, SE-NW
Address range: 3000 to 3078
Directions: E-W, N-S, SE-NW
Address range: 3000 to 3078
Barkwood Way
Length: 0.15 miles
Directions: E-W, SE-NW
Directions: E-W, SE-NW
Walgrove Way
Length: 0.12 miles
Direction: E-W
Address range: 2900 to 3011
Direction: E-W
Address range: 2900 to 3011
Teakwood Dr
Length: 0.09 miles
Direction: N-S
Address range: 1300 to 1399
Direction: N-S
Address range: 1300 to 1399
Greenbriar Ct
Length: 0.05 miles
Direction: E-W
Address range: 3000 to 3099
Direction: E-W
Address range: 3000 to 3099
San Filippo Ct
Length: 0.02 miles
Direction: SW-NE
Address range: 1229 to 1247
Direction: SW-NE
Address range: 1229 to 1247