Central Business District neighborhood in Bellingham, Washington (WA), 98225 detailed profile
Settings
X


Business Search - 14 Million verified businesses
Area: 1.318 square miles
Population: 6,191
Population density:
| Central Business District: | 4,697 people per square mile |
| Bellingham: | 3,662 people per square mile |

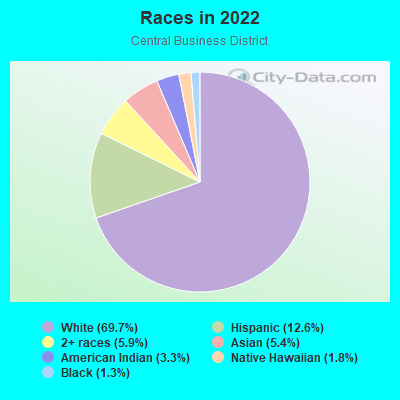
- 4,31569.7%White
- 78112.6%Hispanic or Latino
- 3635.9%Two or more races
- 3365.4%Asian
- 2033.3%American Indian
- 1121.8%Native Hawaiian and Other
Pacific Islander - 791.3%Black
Median household income in 2022:
| Central Business District: | $52,602 |
| Bellingham: | $64,748 |
Distribution of median household income
![Distribution of median household income]()
- 729Less than $10,000
- 721$10,000 to $19,999
- 534$20,000 to $29,999
- 276$30,000 to $39,999
- 237$40,000 to $49,999
- 391$50,000 to $59,999
- 381$60,000 to $74,999
- 361$75,000 to $99,999
- 90$100,000 to $124,999
- 30$125,000 to $149,999
- 138$150,000 to $199,999
- 29$200,000 or more

Distribution of owner-occupied house/condo value
![Distribution of owner-occupied house/condo value]()
- 37Less than $50,000
- 9$150,000 to $199,999
- 5$200,000 to $249,999
- 23$250,000 to $299,999
- 121$300,000 to $399,999
- 33$400,000 to $499,999
- 17$500,000 to $749,999
- 132$750,000 to $999,999

Distribution of rent paid by renters
![Distribution of rent paid by renters]()
- 261$100 to $199
- 206$200 to $299
- 12$300 to $399
- 102$400 to $499
- 29$500 to $599
- 321$600 to $699
- 217$700 to $799
- 164$800 to $899
- 252$900 to $999
- 1,095$1,000 to $1,249
- 517$1,250 to $1,499
- 480$1,500 to $1,999
- 96$2,000 or more

Median rent in 2022:
| Central Business District: | $1,099 |
| Bellingham: | $1,372 |
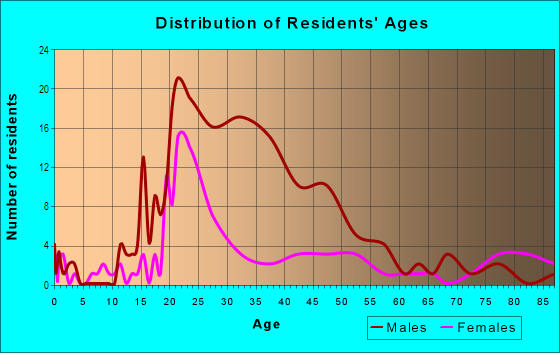
| Males: | 3,796 |
| Females: | 2,394 |
Males:
| This neighborhood: | 24.8 years |
| Whole city: | 35.5 years |
| This neighborhood: | 25.5 years |
| Whole city: | 33.5 years |
Average household size:
| Central Business District: | 1.5 people |
| Bellingham: | 2.1 people |
Percentage of family households:
| Central Business District: | 14.0% |
| Bellingham: | 30.7% |
| Here: | 6.6% |
| Bellingham: | 34.3% |
Percentage of married-couple families with children (among all households):
| Central Business District: | 69.2% |
| Bellingham: | 29.6% |
Percentage of single-mother households (among all households):
| Central Business District: | 49.3% |
| Bellingham: | 11.1% |
Percentage of never married males 15 years old and over:
Percentage of never married females 15 years old and over:
| Central Business District: | 45.0% |
| Bellingham: | 22.3% |
Percentage of never married females 15 years old and over:
| Central Business District: | 21.9% |
| city: | 23.0% |
Percentage of people that speak English not well or not at all:
| Central Business District: | 1.1% |
| Bellingham: | 1.4% |
Percentage of people born in this state:
Percentage of people born in another U.S. state:
Percentage of native residents but born outside the U.S.:
Percentage of foreign born residents:
| Here: | 43.6% |
| Bellingham: | 46.3% |
Percentage of people born in another U.S. state:
| Central Business District: | 42.9% |
| Bellingham: | 40.0% |
Percentage of native residents but born outside the U.S.:
| Here: | 3.6% |
| city: | 2.9% |
Percentage of foreign born residents:
| Here: | 9.9% |
| Bellingham: | 10.8% |
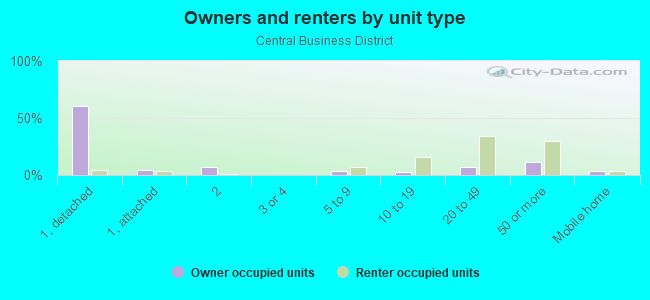
Owner-occupied
Renter-occupied

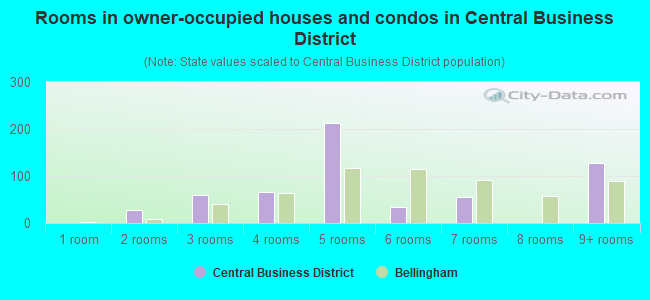
- Rooms in owner-occupied houses and condos in Central Business District
- 01 room
- 272 rooms
- 593 rooms
- 674 rooms
- 2125 rooms
- 336 rooms
- 567 rooms
- 08 rooms
- 1289+ rooms
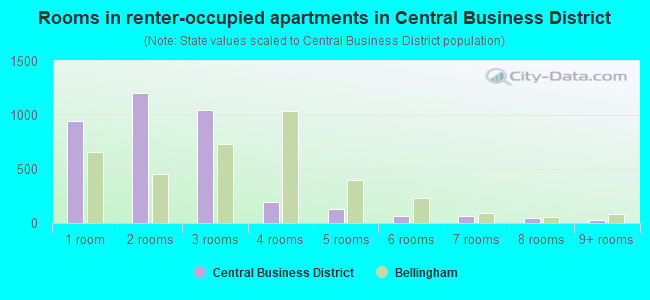
- Rooms in renter-occupied apartments in Central Business District
- 9481 room
- 1,2052 rooms
- 1,0423 rooms
- 1984 rooms
- 1285 rooms
- 676 rooms
- 657 rooms
- 478 rooms
- 329+ rooms
Owner-occupied
Renter-occupied
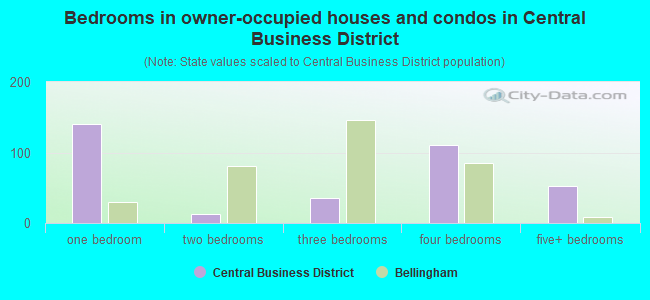
- Bedrooms in owner-occupied houses and condos in Central Business District
- 0no bedroom
- 1411 bedroom
- 132 bedrooms
- 353 bedrooms
- 1104 bedrooms
- 535+ bedrooms
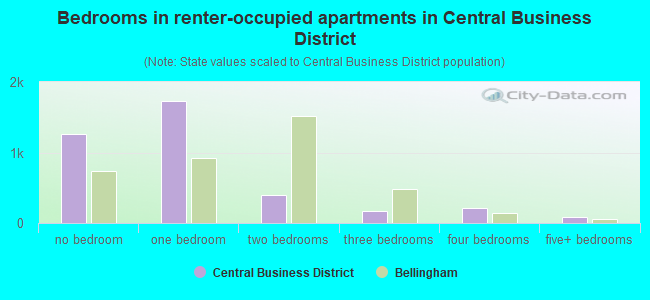
- Bedrooms in renter-occupied apartments in Central Business District
- 1,268no bedroom
- 1,7341 bedroom
- 3942 bedrooms
- 1683 bedrooms
- 2064 bedrooms
- 805+ bedrooms
Average number of cars or other vehicles available in houses/condos:
Average number of cars or other vehicles available in apartments:
| This neighborhood: | 0.6 |
| Bellingham: | 2.0 |
Average number of cars or other vehicles available in apartments:
| Here: | 1.0 |
| city: | 1.5 |
Percentage of units with a mortgage:
| Central Business District: | 59.2% |
| Bellingham: | 61.8% |
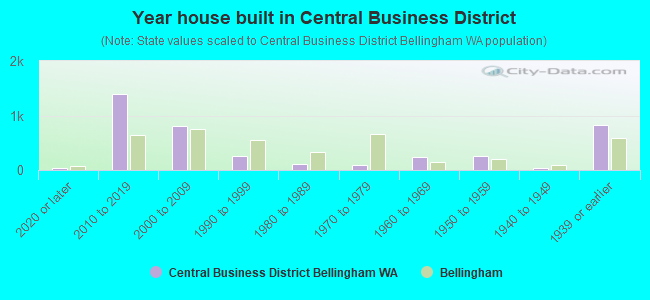
- Year house built in Central Business District
- 302020 or later
- 1,3972010 to 2019
- 8072000 to 2009
- 2591990 to 1999
- 1181980 to 1989
- 851970 to 1979
- 2411960 to 1969
- 2611950 to 1959
- 281940 to 1949
- 8171939 or earlier
City-data.com crime index for city in 2020 (higher means more crime):
| City: | 298.0 |
| U.S. average: | 219.5 |
Travel time to work (commute)
![Travel time to work (commute)]()
- 57Less than 5 minutes
- 4915 to 9 minutes
- 33510 to 14 minutes
- 44015 to 19 minutes
- 20520 to 24 minutes
- 3425 to 29 minutes
- 8130 to 34 minutes
- 1235 to 39 minutes
- 2340 to 44 minutes
- 3845 to 59 minutes
- 8560 to 89 minutes
- 8690 or more minutes

Means of transportation to work
![Means of transportation to work]()
- 51.1%1,364Drove a car alone
- 4.5%119Carpooled
- 9.4%251Bus
- 0.1%4Long-distance train or commuter rail
- 2.0%53Ferryboat
- 1.0%28Motorcycle
- 1.2%33Bicycle
- 21.8%581Walked
- 1.2%31Other means
- 9.6%257Worked at home

Time leaving home to go to work
![Time leaving home to go to work]()
- 2512:00 a.m. to 4:59 a.m.
- 215:00 a.m. to 5:29 a.m.
- 215:30 a.m. to 5:59 a.m.
- 1026:00 a.m. to 6:29 a.m.
- 726:30 a.m. to 6:59 a.m.
- 797:00 a.m. to 7:29 a.m.
- 2347:30 a.m. to 7:59 a.m.
- 2378:00 a.m. to 8:29 a.m.
- 2418:30 a.m. to 8:59 a.m.
- 919:00 a.m. to 9:59 a.m.
- 15010:00 a.m. to 10:59 a.m.
- 2511:00 a.m. to 11:59 a.m.
- 39912:00 p.m. to 3:59 p.m.
- 1544:00 p.m. to 11:59 p.m.

Occupations of males:
- Percentage of males in management occupations (except farmers):
Here: 5.8% city: 13.7%
- Percentage of males in business and financial operations occupations:
Here: 5.3% city: 4.6%
- Percentage of males in computer and mathematical occupations:
Here: 12.9% city: 4.2%
- Percentage of males in architecture and engineering occupations:
Here: 2.2% city: 4.5%
- Percentage of males in life, physical, and social science occupations:
Here: 1.8% city: 1.6%
- Percentage of males in community and social services occupations:
Here: 2.5% city: 1.6%
- Percentage of males in education, training, and library occupations:
Here: 6.0% city: 4.5%
- Percentage of males in arts, design, entertainment, sports, and media occupations:
Here: 4.4% city: 2.3%
- Percentage of males in healthcare practitioners and technical occupations:
Here: 1.2% city: 4.0%
- Percentage of males in service occupations:
Here: 21.3% city: 17.8%
- Percentage of males in sales and office occupations:
Here: 18.9% city: 13.8%
- Percentage of males in production occupations:
Here: 7.2% city: 6.9%
- Percentage of males in material moving occupations:
Here: 8.1% city: 5.0%
Occupations of females:
- Percentage of females in management occupations (except farmers):
Here: 6.8% city: 8.2%
- Percentage of females in business and financial operations occupations:
Here: 3.8% city: 5.9%
- Percentage of females in life, physical, and social science occupations:
Here: 2.6% city: 1.0%
- Percentage of females in community and social services occupations:
Here: 2.2% city: 3.8%
- Percentage of females in education, training, and library occupations:
Here: 26.5% city: 11.2%
- Percentage of females in service occupations:
Here: 25.1% city: 26.0%
- Percentage of females in sales and office occupations:
Here: 23.7% city: 22.8%
- Percentage of females in production occupations:
Here: 6.7% city: 3.1%
- Percentage of females in material moving occupations:
Here: 2.4% city: 1.6%
Percentage of people 16-64 in Armed Forces:
| Central Business District: | 1.2% |
| Bellingham: | 0.3% |
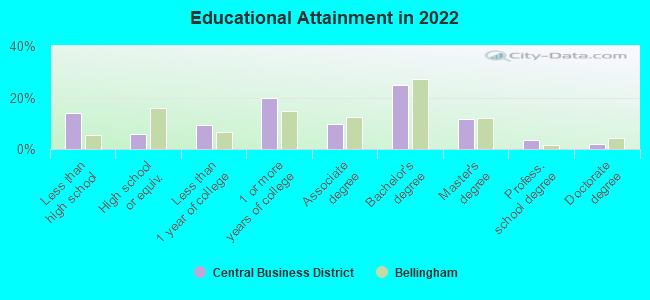
Education in this neighborhood (subdivision or community):
- Percentage of people 3 years and older in K-12 schools:
Central Business District: 9.5% Bellingham: 12.3%
- Percentage of people 3 years and older in undergraduate colleges:
Central Business District: 19.7% Bellingham: 15.0%
- Percentage of people 3 years and older in grad. or professional schools:
Central Business District: 2.5% Bellingham: 1.7%
- Percentage of students K-12 enrolled in private schools:
Central Business District: 0.0% Bellingham: 28.6%
Percentage of population below poverty level:
| Central Business District: | 39.6% |
| Bellingham: | 14.3% |
Median year owner moved in (as recorded in 2022):
Median year renter moved in (as recorded in 2022):
| Central Business District: | 2009 |
| Bellingham: | 2012 |
Median year renter moved in (as recorded in 2022):
| Central Business District: | 2019 |
| Bellingham: | 2020 |
Percentage of married-couple families with both working:
| Central Business District: | 61.2% |
| Bellingham: | 76.1% |
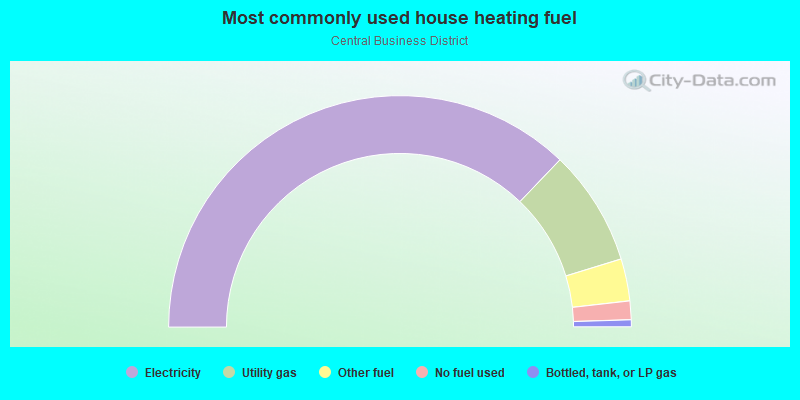
- 74.3%Electricity
- 16.2%Utility gas
- 5.9%Other fuel
- 2.6%No fuel used
- 1.0%Bottled, tank, or LP gas
Roads and streets:
Roeder Ave
Length: 1.91 miles
Directions: E-W, N-S, SE-NW
Address range: 600 to 2999
Directions: E-W, N-S, SE-NW
Address range: 600 to 2999
Cornwall Ave
Length: 1.39 miles
Directions: N-S, SW-NE
Address range: 400 to 1699
Directions: N-S, SW-NE
Address range: 400 to 1699
N State St
Length: 1.02 miles
Direction: SW-NE
Address range: 822 to 1599
Direction: SW-NE
Address range: 822 to 1599
Railroad Ave
Length: 1.00 miles
Direction: SW-NE
Address range: 1100 to 1599
Direction: SW-NE
Address range: 1100 to 1599
Central Ave
Length: 0.59 miles
Directions: E-W, SW-NE
Address range: 100 to 1299
Directions: E-W, SW-NE
Address range: 100 to 1299
Coho Way
Length: 0.54 miles
Directions: N-S, SE-NW, SW-NE
Address range: 1 to 899
Directions: N-S, SE-NW, SW-NE
Address range: 1 to 899
N Harbor Loop Dr
Length: 0.50 miles
Directions: E-W, N-S, SE-NW
Address range: 2400 to 2699
Directions: E-W, N-S, SE-NW
Address range: 2400 to 2699
W Champion St
Length: 0.43 miles
Directions: E-W, SE-NW
Address range: 1 to 499
Directions: E-W, SE-NW
Address range: 1 to 499
W Holly St
Length: 0.41 miles
Direction: SE-NW
Address range: 100 to 599
Direction: SE-NW
Address range: 100 to 599
Flora St
Length: 0.40 miles
Direction: E-W
Address range: 1 to 399
Direction: E-W
Address range: 1 to 399
Pine St
Length: 0.38 miles
Directions: E-W, SE-NW
Address range: 99 to 198
Directions: E-W, SE-NW
Address range: 99 to 198
Boulevard St
Length: 0.36 miles
Directions: E-W, SW-NE
Address range: 387 to 798
Directions: E-W, SW-NE
Address range: 387 to 798
Bellwether Way
Length: 0.35 miles
Direction: SW-NE
Address range: 950 to 1199
Direction: SW-NE
Address range: 950 to 1199
Squalicum Way (Squalicum Pkwy)
Length: 0.33 miles
Directions: N-S, SW-NE
Address range: 1 to 899
Directions: N-S, SW-NE
Address range: 1 to 899
C St
Length: 0.33 miles
Direction: SW-NE
Address range: 900 to 1199
Direction: SW-NE
Address range: 900 to 1199
Wharf St
Length: 0.32 miles
Directions: E-W, SE-NW, SW-NE
Directions: E-W, SE-NW, SW-NE
Chestnut St (W Chestnut St)
Length: 0.31 miles
Directions: N-S, SE-NW
Address range: 100 to 499
Directions: N-S, SE-NW
Address range: 100 to 499
Commercial St
Length: 0.30 miles
Direction: SW-NE
Address range: 1200 to 1499
Direction: SW-NE
Address range: 1200 to 1499
G St
Length: 0.29 miles
Direction: SW-NE
Direction: SW-NE
N Commercial St
Length: 0.28 miles
Directions: N-S, SW-NE
Address range: 100 to 499
Directions: N-S, SW-NE
Address range: 100 to 499
Hilton Ave
Length: 0.27 miles
Directions: E-W, SW-NE
Address range: 500 to 1083
Directions: E-W, SW-NE
Address range: 500 to 1083
Grand Ave (Grand St)
Length: 0.26 miles
Direction: N-S
Address range: 100 to 499
Direction: N-S
Address range: 100 to 499
W Laurel St
Length: 0.26 miles
Directions: E-W, SE-NW
Address range: 100 to 499
Directions: E-W, SE-NW
Address range: 100 to 499
Prospect St
Length: 0.25 miles
Direction: N-S
Address range: 1 to 399
Direction: N-S
Address range: 1 to 399
Beal Memorial Way
Length: 0.24 miles
Direction: SE-NW
Address range: 100 to 499
Direction: SE-NW
Address range: 100 to 499
Bay St
Length: 0.22 miles
Direction: SW-NE
Address range: 1200 to 1399
Direction: SW-NE
Address range: 1200 to 1399
York St
Length: 0.21 miles
Directions: E-W, SE-NW
Address range: 100 to 299
Directions: E-W, SE-NW
Address range: 100 to 299
Lottie St
Length: 0.20 miles
Direction: E-W
Address range: 200 to 399
Direction: E-W
Address range: 200 to 399
E Champion St
Length: 0.17 miles
Direction: SE-NW
Address range: 100 to 299
Direction: SE-NW
Address range: 100 to 299
E Laurel St
Length: 0.17 miles
Direction: SE-NW
Address range: 100 to 299
Direction: SE-NW
Address range: 100 to 299
E Maple St
Length: 0.17 miles
Direction: SE-NW
Address range: 100 to 299
Direction: SE-NW
Address range: 100 to 299
E Magnolia St
Length: 0.17 miles
Direction: SE-NW
Address range: 100 to 299
Direction: SE-NW
Address range: 100 to 299
E Holly St
Length: 0.17 miles
Direction: SE-NW
Address range: 100 to 299
Direction: SE-NW
Address range: 100 to 299
E Chestnut St
Length: 0.17 miles
Direction: SE-NW
Address range: 100 to 299
Direction: SE-NW
Address range: 100 to 299
Unity St
Length: 0.15 miles
Directions: E-W, N-S, SE-NW
Address range: 100 to 415
Directions: E-W, N-S, SE-NW
Address range: 100 to 415
Magnolia St (W Magnolia St)
Length: 0.15 miles
Directions: E-W, SE-NW
Address range: 100 to 299
Directions: E-W, SE-NW
Address range: 100 to 299
E Ivy St
Length: 0.15 miles
Direction: SE-NW
Direction: SE-NW
W Chestnut St
Length: 0.14 miles
Direction: SE-NW
Address range: 600 to 799
Direction: SE-NW
Address range: 600 to 799
W Maple St
Length: 0.11 miles
Direction: SE-NW
Direction: SE-NW
E Oak St
Length: 0.08 miles
Direction: SE-NW
Direction: SE-NW
E Pine St
Length: 0.06 miles
Direction: SE-NW
Direction: SE-NW
Railroad features:
Burlington Northern Santa Fe Rlwy
Length: 3.47 miles
Directions: E-W, N-S, SE-NW, SW-NE
Directions: E-W, N-S, SE-NW, SW-NE
B N R R
Length: 0.05 miles
Direction: E-W
Direction: E-W
Other features:
Whatcom Crk
Length: 0.55 miles
Directions: E-W, SW-NE
Directions: E-W, SW-NE
Squalicum Crk
Length: 0.12 miles
Directions: N-S, SW-NE
Directions: N-S, SW-NE