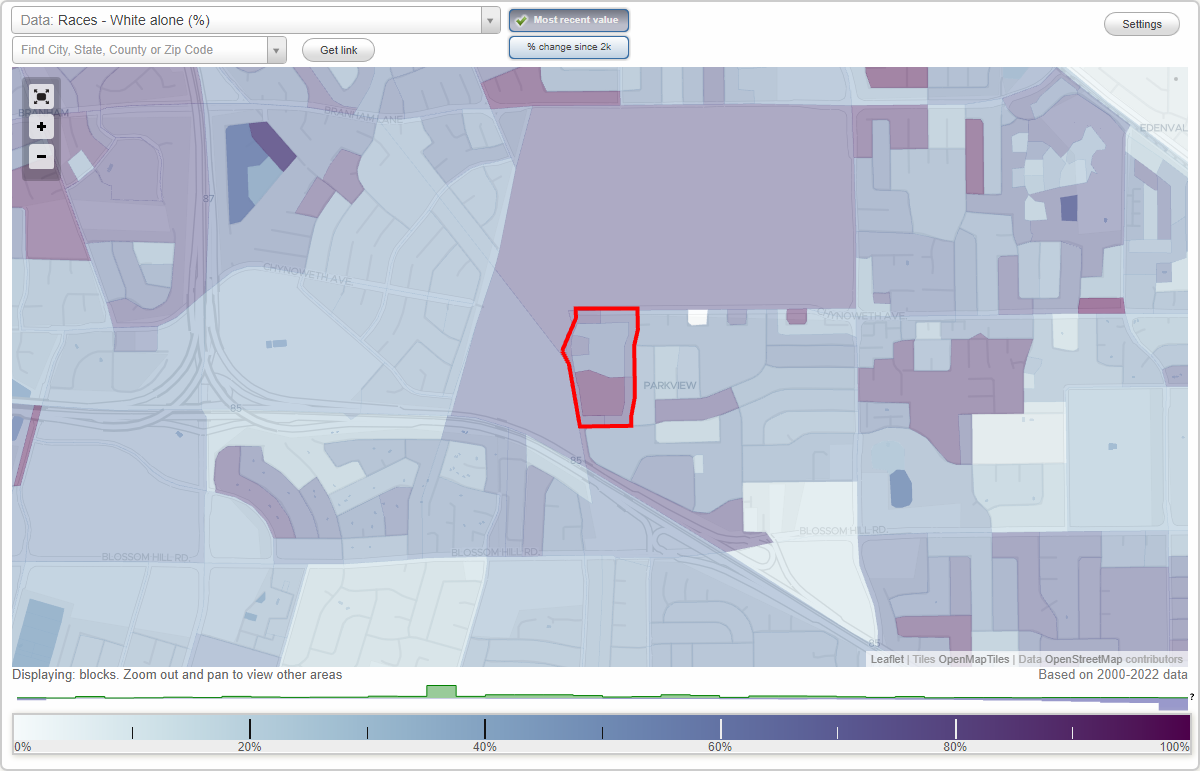
Colony Green neighborhood in San Jose, California (CA), 95123 detailed profile
Settings
X

Business Search - 14 Million verified businesses
Area: 0.041 square miles
Population: 130
Population density:
| Colony Green: | 3,155 people per square mile |
| San Jose: | 5,554 people per square mile |

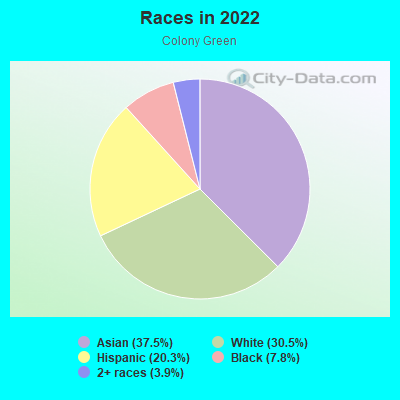
- 4837.5%Asian
- 3930.5%White
- 2620.3%Hispanic or Latino
- 107.8%Black
- 53.9%Two or more races
Median household income in 2022:
| Colony Green: | $131,322 |
| San Jose: | $133,835 |
Distribution of median household income
![Distribution of median household income]()
- 5Less than $10,000
- 2$10,000 to $19,999
- 2$20,000 to $29,999
- 2$30,000 to $39,999
- 7$40,000 to $49,999
- 1$50,000 to $59,999
- 5$60,000 to $74,999
- 6$75,000 to $99,999
- 5$100,000 to $124,999
- 3$125,000 to $149,999
- 7$150,000 to $199,999
- 11$200,000 or more

Distribution of owner-occupied house/condo value
![Distribution of owner-occupied house/condo value]()
- 1Less than $50,000
- 1$50,000 to $99,999
- 3$100,000 to $149,999
- 4$300,000 to $399,999
- 4$400,000 to $499,999
- 29$500,000 to $749,999
- 5$750,000 to $999,999
- 4$1,000,000 or more

Distribution of rent paid by renters
![Distribution of rent paid by renters]()
- 2$700 to $799
- 2$1,500 to $1,999
- 19$2,000 or more

Median rent in 2022:
| Colony Green: | $2,797 |
| San Jose: | $2,001 |
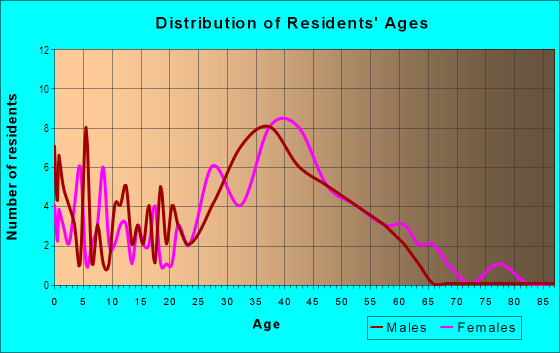
| Males: | 72 |
| Females: | 57 |
Males:
| This neighborhood: | 40.1 years |
| Whole city: | 37.6 years |
| This neighborhood: | 43.2 years |
| Whole city: | 39.1 years |
Average household size:
| Colony Green: | 2.8 people |
| San Jose: | 2.9 people |
Percentage of family households:
| Colony Green: | 38.6% |
| San Jose: | 49.9% |
| Here: | 48.8% |
| San Jose: | 53.0% |
Percentage of married-couple families with children (among all households):
| Colony Green: | 34.5% |
| San Jose: | 25.8% |
Percentage of single-mother households (among all households):
| Colony Green: | 1.9% |
| San Jose: | 5.2% |
Percentage of never married males 15 years old and over:
Percentage of never married females 15 years old and over:
| Colony Green: | 22.5% |
| San Jose: | 20.9% |
Percentage of never married females 15 years old and over:
| Colony Green: | 9.8% |
| city: | 16.7% |
Percentage of people that speak English not well or not at all:
| Colony Green: | 12.5% |
| San Jose: | 11.4% |
Percentage of people born in this state:
Percentage of people born in another U.S. state:
Percentage of native residents but born outside the U.S.:
Percentage of foreign born residents:
| Here: | 53.4% |
| San Jose: | 46.1% |
Percentage of people born in another U.S. state:
| Colony Green: | 11.2% |
| San Jose: | 10.4% |
Percentage of native residents but born outside the U.S.:
| Here: | 0.2% |
| city: | 1.7% |
Percentage of foreign born residents:
| Here: | 35.2% |
| San Jose: | 41.8% |
Owner-occupied
Renter-occupied

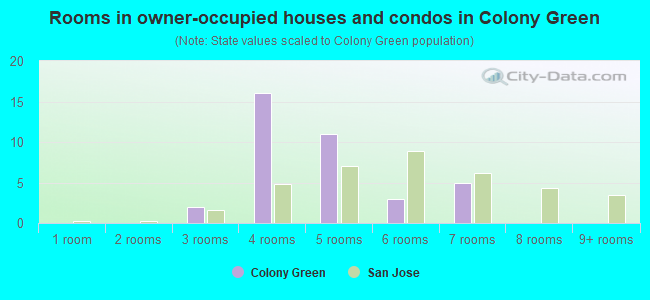
- Rooms in owner-occupied houses and condos in Colony Green
- 01 room
- 02 rooms
- 23 rooms
- 164 rooms
- 115 rooms
- 36 rooms
- 57 rooms
- 08 rooms
- 09+ rooms
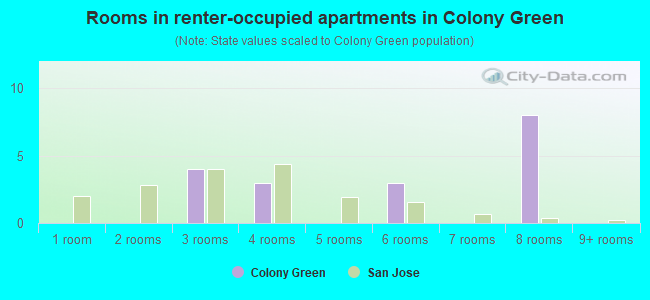
- Rooms in renter-occupied apartments in Colony Green
- 01 room
- 02 rooms
- 43 rooms
- 34 rooms
- 05 rooms
- 36 rooms
- 07 rooms
- 88 rooms
- 09+ rooms
Owner-occupied
Renter-occupied
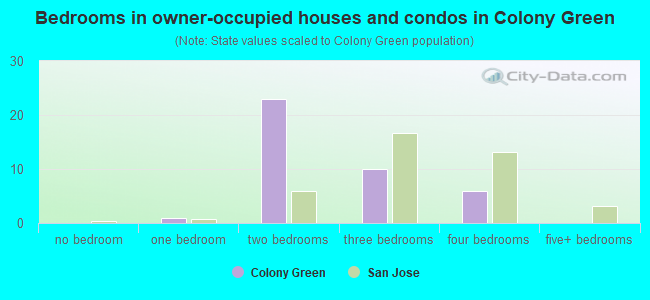
- Bedrooms in owner-occupied houses and condos in Colony Green
- 0no bedroom
- 11 bedroom
- 232 bedrooms
- 103 bedrooms
- 64 bedrooms
- 05+ bedrooms
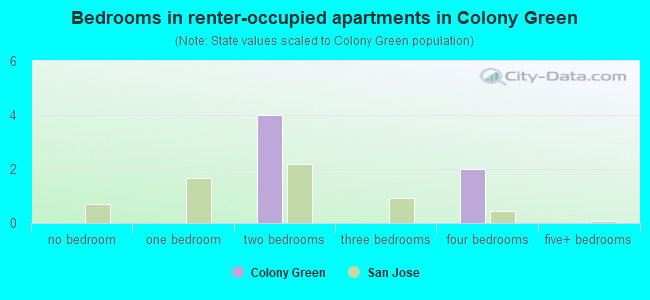
- Bedrooms in renter-occupied apartments in Colony Green
- 0no bedroom
- 01 bedroom
- 42 bedrooms
- 03 bedrooms
- 24 bedrooms
- 05+ bedrooms
Average number of cars or other vehicles available in houses/condos:
Average number of cars or other vehicles available in apartments:
| This neighborhood: | 2.0 |
| San Jose: | 2.3 |
Average number of cars or other vehicles available in apartments:
| Here: | 1.9 |
| city: | 1.6 |
Percentage of units with a mortgage:
| Colony Green: | 58.3% |
| San Jose: | 66.9% |
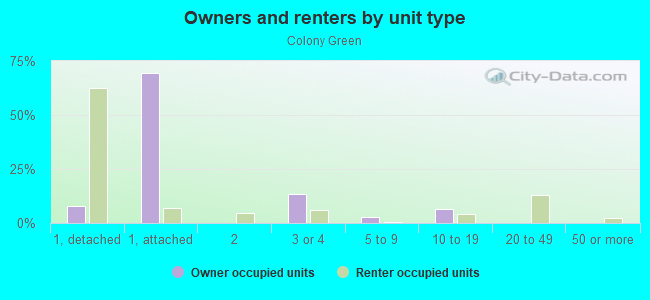
Housing prices:
- Average estimated value of detached houses in 2022 (6.1% of all units):
Colony Green: $5,786,638 San Jose: $1,532,815
- Average estimated value of townhouses or other attached units in 2022 (69.4% of all units):
This neighborhood: $390,093 city: $1,024,857
- Average estimated '22 value of housing units in 3-to-4-unit structures (16.3% of all units):
Colony Green: $352,448 city: $781,695
- Average estimated '22 value of housing units in 5-or-more-unit structures (2.0% of all units):
Colony Green: $597,704 San Jose: $791,954
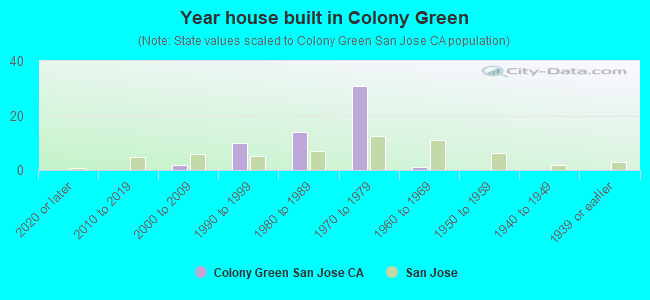
- Year house built in Colony Green
- 02020 or later
- 02010 to 2019
- 22000 to 2009
- 101990 to 1999
- 141980 to 1989
- 311970 to 1979
- 11960 to 1969
- 01950 to 1959
- 01940 to 1949
- 01939 or earlier
City-data.com crime index for city in 2020 (higher means more crime):
| City: | 268.4 |
| U.S. average: | 219.5 |
Travel time to work (commute)
![Travel time to work (commute)]()
- 25 to 9 minutes
- 310 to 14 minutes
- 715 to 19 minutes
- 1620 to 24 minutes
- 625 to 29 minutes
- 1430 to 34 minutes
- 135 to 39 minutes
- 140 to 44 minutes
- 745 to 59 minutes
- 760 to 89 minutes
- 490 or more minutes

Means of transportation to work
![Means of transportation to work]()
- 66.8%46Drove a car alone
- 17.4%12Carpooled
- 1.5%1Bus
- 2.9%2Light rail, streetcar or trolley
- 11.6%8Walked
- 7.3%5Worked at home

Time leaving home to go to work
![Time leaving home to go to work]()
- 412:00 a.m. to 4:59 a.m.
- 15:00 a.m. to 5:29 a.m.
- 25:30 a.m. to 5:59 a.m.
- 46:00 a.m. to 6:29 a.m.
- 96:30 a.m. to 6:59 a.m.
- 117:00 a.m. to 7:29 a.m.
- 117:30 a.m. to 7:59 a.m.
- 68:00 a.m. to 8:29 a.m.
- 48:30 a.m. to 8:59 a.m.
- 69:00 a.m. to 9:59 a.m.
- 110:00 a.m. to 10:59 a.m.
- 111:00 a.m. to 11:59 a.m.
- 512:00 p.m. to 3:59 p.m.
- 54:00 p.m. to 11:59 p.m.

Occupations of males:
- Percentage of males in management occupations (except farmers):
Here: 19.6% city: 13.0%
- Percentage of males in business and financial operations occupations:
Here: 2.3% city: 4.6%
- Percentage of males in computer and mathematical occupations:
Here: 10.8% city: 13.6%
- Percentage of males in architecture and engineering occupations:
Here: 1.5% city: 10.2%
- Percentage of males in life, physical, and social science occupations:
Here: 6.4% city: 1.1%
- Percentage of males in legal occupations:
Here: 2.6% city: 0.8%
- Percentage of males in education, training, and library occupations:
Here: 8.0% city: 2.8%
- Percentage of males in arts, design, entertainment, sports, and media occupations:
Here: 2.2% city: 1.8%
- Percentage of males in healthcare practitioners and technical occupations:
Here: 4.4% city: 2.0%
- Percentage of males in service occupations:
Here: 14.3% city: 12.7%
- Percentage of males in sales and office occupations:
Here: 6.4% city: 12.8%
- Percentage of males in construction, extraction, and maintenance occupations:
Here: 4.9% city: 7.8%
- Percentage of males in production occupations:
Here: 6.7% city: 5.5%
- Percentage of males in transportation occupations:
Here: 4.5% city: 3.6%
Occupations of females:
- Percentage of females in management occupations (except farmers):
Here: 15.2% city: 11.0%
- Percentage of females in business and financial operations occupations:
Here: 12.1% city: 8.6%
- Percentage of females in architecture and engineering occupations:
Here: 2.5% city: 2.8%
- Percentage of females in life, physical, and social science occupations:
Here: 6.8% city: 1.7%
- Percentage of females in community and social services occupations:
Here: 4.0% city: 1.8%
- Percentage of females in education, training, and library occupations:
Here: 15.0% city: 8.1%
- Percentage of females in arts, design, entertainment, sports, and media occupations:
Here: 2.0% city: 2.0%
- Percentage of females in healthcare practitioners and technical occupations:
Here: 1.6% city: 6.8%
- Percentage of females in service occupations:
Here: 9.2% city: 21.7%
- Percentage of females in sales and office occupations:
Here: 22.6% city: 22.0%
- Percentage of females in production occupations:
Here: 8.9% city: 4.0%
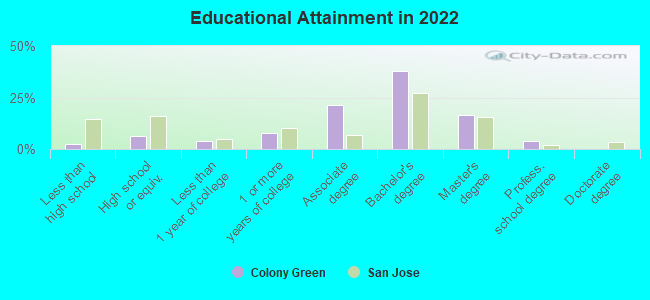
Education in this neighborhood (subdivision or community):
- Percentage of people 3 years and older in K-12 schools:
Colony Green: 9.4% San Jose: 16.1%
- Percentage of people 3 years and older in undergraduate colleges:
Colony Green: 7.0% San Jose: 6.5%
- Percentage of people 3 years and older in grad. or professional schools:
Colony Green: 3.1% San Jose: 2.0%
- Percentage of students K-12 enrolled in private schools:
Colony Green: 50.0% San Jose: 14.9%
Percentage of population below poverty level:
| Colony Green: | 3.5% |
| San Jose: | 9.0% |
Median year owner moved in (as recorded in 2022):
Median year renter moved in (as recorded in 2022):
| Colony Green: | 2008 |
| San Jose: | 2008 |
Median year renter moved in (as recorded in 2022):
| Colony Green: | 2016 |
| San Jose: | 2020 |
Percentage of married-couple families with both working:
| Colony Green: | 76.0% |
| San Jose: | 72.5% |
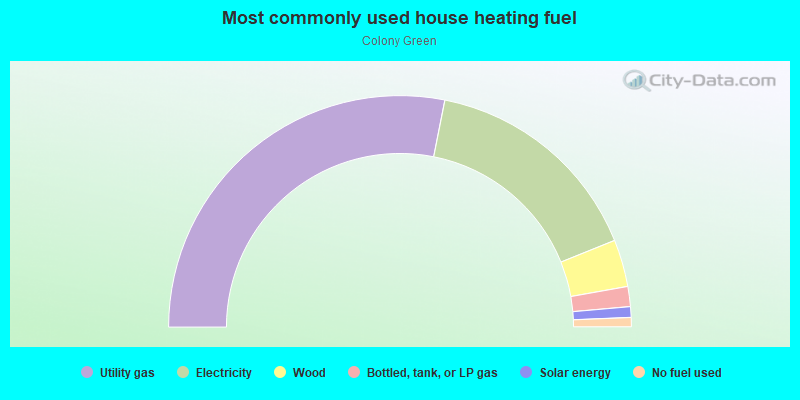
- 56.3%Utility gas
- 31.6%Electricity
- 6.6%Wood
- 2.8%Bottled, tank, or LP gas
- 1.5%Solar energy
- 1.3%No fuel used
Roads and streets:
Duesenberg Dr
Length: 0.24 miles
Directions: N-S, SW-NE
Directions: N-S, SW-NE
Colony Field Dr
Length: 0.23 miles
Directions: N-S, SE-NW, SW-NE
Address range: 5300 to 5498
Directions: N-S, SE-NW, SW-NE
Address range: 5300 to 5498
Colony Green Dr
Length: 0.22 miles
Directions: N-S, SW-NE
Address range: 5300 to 5499
Directions: N-S, SW-NE
Address range: 5300 to 5499
Colony Crest Dr
Length: 0.15 miles
Direction: E-W
Address range: 400 to 499
Direction: E-W
Address range: 400 to 499
Colony Knoll Dr
Length: 0.15 miles
Directions: E-W, SE-NW
Address range: 437 to 5498
Directions: E-W, SE-NW
Address range: 437 to 5498
Colony Park Cir
Length: 0.14 miles
Directions: E-W, N-S, SE-NW, SW-NE
Address range: 5300 to 5499
Directions: E-W, N-S, SE-NW, SW-NE
Address range: 5300 to 5499
Colony Cove Dr
Length: 0.12 miles
Directions: E-W, SE-NW
Address range: 400 to 499
Directions: E-W, SE-NW
Address range: 400 to 499
Chynoweth Ave
Length: 0.11 miles
Direction: E-W
Direction: E-W
Ave Arboles
Length: 0.08 miles
Direction: E-W
Address range: 440 to 456
Direction: E-W
Address range: 440 to 456
Don Correlli Way
Length: 0.03 miles
Direction: N-S
Direction: N-S