Cool Spring/Tilton Park Historic District neighborhood in Wilmington, Delaware (DE), 19805, 19806 detailed profile
Settings
X

Business Search - 14 Million verified businesses
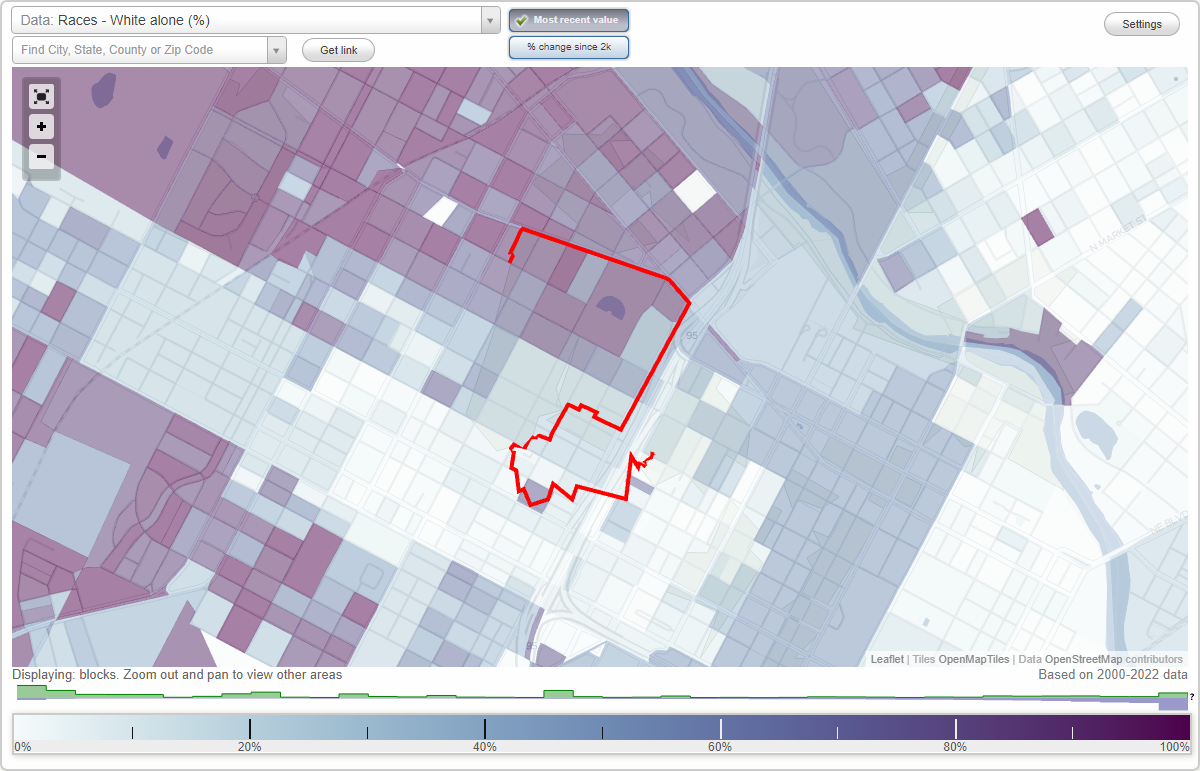
Area: 0.156 square miles
Population: 809
Population density:
| Cool Spring/Tilton Park Historic District: | 5,191 people per square mile |
| Wilmington: | 6,597 people per square mile |

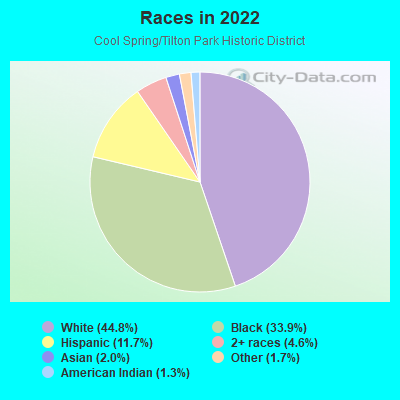
- 37944.8%White
- 28733.9%Black
- 9911.7%Hispanic or Latino
- 394.6%Two or more races
- 172.0%Asian
- 141.7%Some other race
- 111.3%American Indian
Median household income in 2022:
| Cool Spring/Tilton Park Historic District: | $57,969 |
| Wilmington: | $52,768 |
Distribution of median household income
![Distribution of median household income]()
- 78Less than $10,000
- 53$10,000 to $19,999
- 39$20,000 to $29,999
- 43$30,000 to $39,999
- 48$40,000 to $49,999
- 48$50,000 to $59,999
- 98$60,000 to $74,999
- 35$75,000 to $99,999
- 21$100,000 to $124,999
- 9$125,000 to $149,999
- 24$150,000 to $199,999
- 37$200,000 or more

Distribution of owner-occupied house/condo value
![Distribution of owner-occupied house/condo value]()
- 71Less than $50,000
- 162$50,000 to $99,999
- 75$100,000 to $149,999
- 106$150,000 to $199,999
- 22$200,000 to $249,999
- 32$250,000 to $299,999
- 24$300,000 to $399,999
- 12$400,000 to $499,999
- 15$500,000 to $749,999
- 50$750,000 to $999,999

Distribution of rent paid by renters
![Distribution of rent paid by renters]()
- 6$100 to $199
- 87$200 to $299
- 184$300 to $399
- 49$400 to $499
- 197$500 to $599
- 37$600 to $699
- 38$700 to $799
- 41$800 to $899
- 34$900 to $999
- 108$1,000 to $1,249
- 41$1,250 to $1,499
- 48$1,500 to $1,999
- 270$2,000 or more

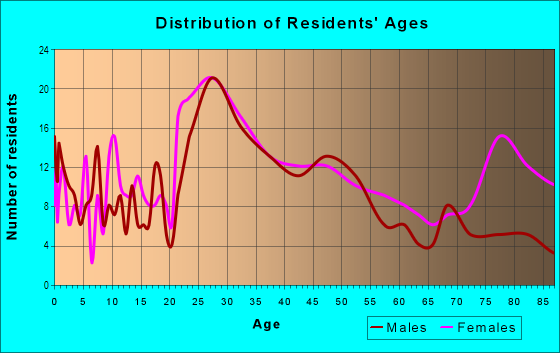
| Males: | 399 |
| Females: | 410 |
Males:
| This neighborhood: | 44.5 years |
| Whole city: | 37.1 years |
| This neighborhood: | 52.7 years |
| Whole city: | 41.1 years |
Average household size:
| Cool Spring/Tilton Park Historic District: | 1.5 people |
| Wilmington: | 2.1 people |
Percentage of family households:
| Cool Spring/Tilton Park Historic District: | 18.9% |
| Wilmington: | 32.8% |
| Here: | 15.7% |
| Wilmington: | 20.9% |
Percentage of married-couple families with children (among all households):
| Cool Spring/Tilton Park Historic District: | 35.1% |
| Wilmington: | 13.2% |
Percentage of single-mother households (among all households):
| Cool Spring/Tilton Park Historic District: | 20.9% |
| Wilmington: | 24.1% |
Percentage of never married males 15 years old and over:
Percentage of never married females 15 years old and over:
| Cool Spring/Tilton Park Historic District: | 23.8% |
| Wilmington: | 22.2% |
Percentage of never married females 15 years old and over:
| Cool Spring/Tilton Park Historic District: | 16.9% |
| city: | 28.6% |
Percentage of people that speak English not well or not at all:
| Cool Spring/Tilton Park Historic District: | 4.6% |
| Wilmington: | 2.4% |
Percentage of people born in this state:
Percentage of people born in another U.S. state:
Percentage of native residents but born outside the U.S.:
Percentage of foreign born residents:
| Here: | 46.3% |
| Wilmington: | 45.5% |
Percentage of people born in another U.S. state:
| Cool Spring/Tilton Park Historic District: | 45.4% |
| Wilmington: | 43.0% |
Percentage of native residents but born outside the U.S.:
| Here: | 3.1% |
| city: | 3.5% |
Percentage of foreign born residents:
| Here: | 5.2% |
| Wilmington: | 8.0% |
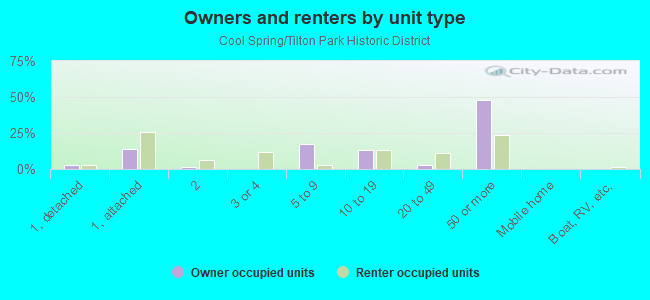
Owner-occupied
Renter-occupied

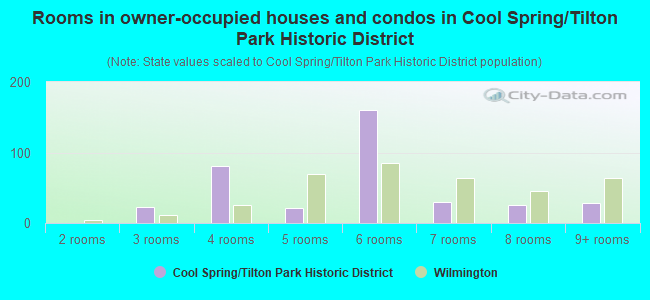
- Rooms in owner-occupied houses and condos in Cool Spring/Tilton Park Historic District
- 01 room
- 02 rooms
- 223 rooms
- 814 rooms
- 215 rooms
- 1606 rooms
- 307 rooms
- 258 rooms
- 299+ rooms
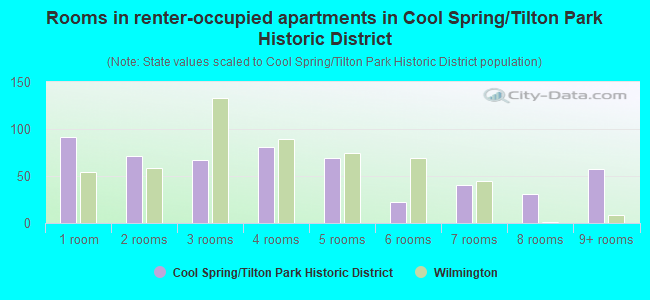
- Rooms in renter-occupied apartments in Cool Spring/Tilton Park Historic District
- 921 room
- 712 rooms
- 673 rooms
- 814 rooms
- 695 rooms
- 226 rooms
- 407 rooms
- 318 rooms
- 579+ rooms
Owner-occupied
Renter-occupied
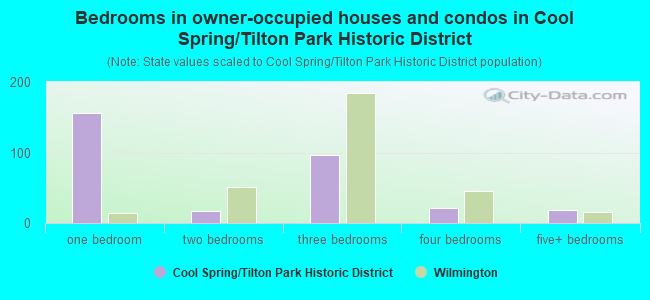
- Bedrooms in owner-occupied houses and condos in Cool Spring/Tilton Park Historic District
- 0no bedroom
- 1561 bedroom
- 172 bedrooms
- 973 bedrooms
- 214 bedrooms
- 195+ bedrooms
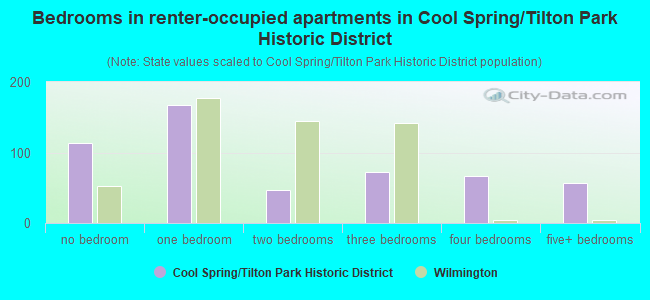
- Bedrooms in renter-occupied apartments in Cool Spring/Tilton Park Historic District
- 113no bedroom
- 1681 bedroom
- 472 bedrooms
- 723 bedrooms
- 674 bedrooms
- 575+ bedrooms
Average number of cars or other vehicles available in houses/condos:
Average number of cars or other vehicles available in apartments:
| This neighborhood: | 1.4 |
| Wilmington: | 1.6 |
Average number of cars or other vehicles available in apartments:
| Here: | 0.6 |
| city: | 0.9 |
Percentage of units with a mortgage:
| Cool Spring/Tilton Park Historic District: | 80.1% |
| Wilmington: | 67.1% |
Average estimated value of townhouses or other attached units in 2022 (29.4% of all units):
| This neighborhood: | $246,281 |
| Delaware: | $291,415 |
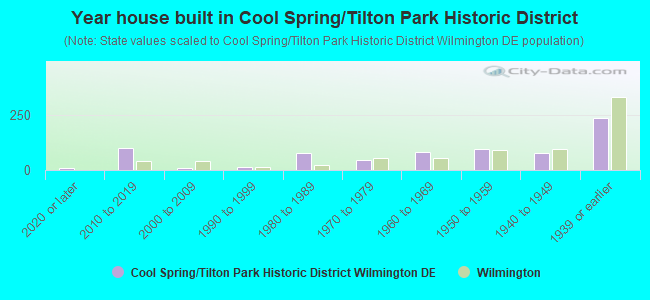
- Year house built in Cool Spring/Tilton Park Historic District
- 112020 or later
- 992010 to 2019
- 102000 to 2009
- 121990 to 1999
- 781980 to 1989
- 441970 to 1979
- 811960 to 1969
- 971950 to 1959
- 771940 to 1949
- 2351939 or earlier
City-data.com crime index for city in 2020 (higher means more crime):
| City: | 649.2 |
| U.S. average: | 219.5 |
Travel time to work (commute)
![Travel time to work (commute)]()
- 14Less than 5 minutes
- 275 to 9 minutes
- 10110 to 14 minutes
- 14915 to 19 minutes
- 5220 to 24 minutes
- 3325 to 29 minutes
- 8130 to 34 minutes
- 1335 to 39 minutes
- 240 to 44 minutes
- 445 to 59 minutes
- 1960 to 89 minutes
- 590 or more minutes

Means of transportation to work
![Means of transportation to work]()
- 74.5%287Drove a car alone
- 2.6%10Carpooled
- 2.1%8Bus
- 51.1%197Long-distance train or commuter rail
- 1.0%4Light rail, streetcar or trolley
- 10.6%41Walked
- 2.1%8Other means
- 9.6%37Worked at home

Time leaving home to go to work
![Time leaving home to go to work]()
- 412:00 a.m. to 4:59 a.m.
- 55:00 a.m. to 5:29 a.m.
- 95:30 a.m. to 5:59 a.m.
- 336:00 a.m. to 6:29 a.m.
- 226:30 a.m. to 6:59 a.m.
- 667:00 a.m. to 7:29 a.m.
- 817:30 a.m. to 7:59 a.m.
- 558:00 a.m. to 8:29 a.m.
- 108:30 a.m. to 8:59 a.m.
- 799:00 a.m. to 9:59 a.m.
- 3410:00 a.m. to 10:59 a.m.
- 711:00 a.m. to 11:59 a.m.
- 6012:00 p.m. to 3:59 p.m.
- 234:00 p.m. to 11:59 p.m.

Occupations of males:
- Percentage of males in management occupations (except farmers):
Here: 19.3% city: 8.8%
- Percentage of males in business and financial operations occupations:
Here: 2.2% city: 5.8%
- Percentage of males in computer and mathematical occupations:
Here: 8.1% city: 3.9%
- Percentage of males in life, physical, and social science occupations:
Here: 14.0% city: 1.7%
- Percentage of males in legal occupations:
Here: 1.2% city: 3.3%
- Percentage of males in education, training, and library occupations:
Here: 3.0% city: 2.6%
- Percentage of males in healthcare practitioners and technical occupations:
Here: 2.5% city: 3.8%
- Percentage of males in service occupations:
Here: 24.2% city: 18.7%
- Percentage of males in sales and office occupations:
Here: 12.4% city: 11.8%
- Percentage of males in production occupations:
Here: 4.0% city: 5.6%
- Percentage of males in transportation occupations:
Here: 4.8% city: 7.6%
- Percentage of males in material moving occupations:
Here: 2.2% city: 5.8%
Occupations of females:
- Percentage of females in management occupations (except farmers):
Here: 22.3% city: 10.8%
- Percentage of females in business and financial operations occupations:
Here: 7.3% city: 10.0%
- Percentage of females in life, physical, and social science occupations:
Here: 2.6% city: 1.4%
- Percentage of females in community and social services occupations:
Here: 10.1% city: 4.0%
- Percentage of females in education, training, and library occupations:
Here: 3.4% city: 9.1%
- Percentage of females in healthcare practitioners and technical occupations:
Here: 7.1% city: 8.1%
- Percentage of females in service occupations:
Here: 23.6% city: 21.3%
- Percentage of females in sales and office occupations:
Here: 20.1% city: 21.1%
- Percentage of females in construction, extraction, and maintenance occupations:
Here: 1.2% city: 0.5%
Percentage of people 16-64 in Armed Forces:
| Cool Spring/Tilton Park Historic District: | 0.0% |
| Wilmington: | 0.4% |
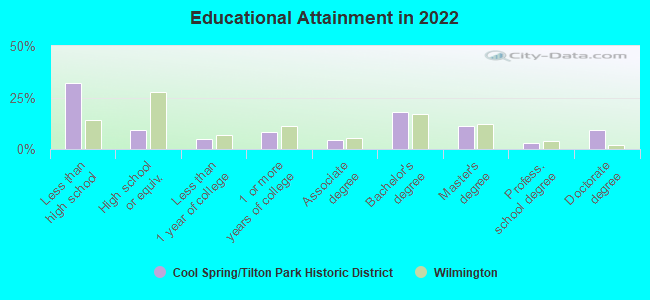
Education in this neighborhood (subdivision or community):
- Percentage of people 3 years and older in K-12 schools:
Cool Spring/Tilton Park Historic District: 41.4% Wilmington: 16.0%
- Percentage of people 3 years and older in undergraduate colleges:
Cool Spring/Tilton Park Historic District: 21.9% Wilmington: 3.1%
- Percentage of people 3 years and older in grad. or professional schools:
Cool Spring/Tilton Park Historic District: 8.8% Wilmington: 2.8%
- Percentage of students K-12 enrolled in private schools:
Cool Spring/Tilton Park Historic District: 38.5% Wilmington: 8.2%
Percentage of population below poverty level:
| Cool Spring/Tilton Park Historic District: | 27.8% |
| Wilmington: | 22.2% |
Median year owner moved in (as recorded in 2022):
| Cool Spring/Tilton Park Historic District: | 2013 |
| Wilmington: | 2010 |
Percentage of married-couple families with both working:
| Cool Spring/Tilton Park Historic District: | 108.6% |
| Wilmington: | 84.9% |
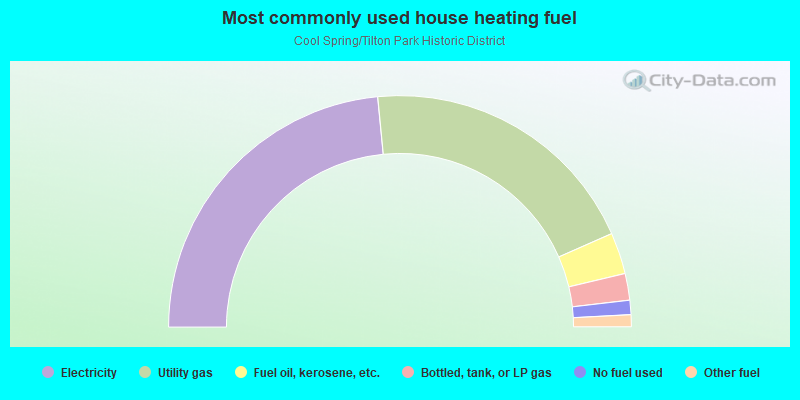
- 46.9%Electricity
- 39.8%Utility gas
- 5.8%Fuel oil, kerosene, etc.
- 3.7%Bottled, tank, or LP gas
- 2.0%No fuel used
- 1.7%Other fuel
Highways in this neighborhood:
Pennsylvania Ave (State Rd 52)
Length: 0.30 miles
Directions: E-W, SE-NW
Address range: 1000 to 1498
Directions: E-W, SE-NW
Address range: 1000 to 1498
Roads and streets:
N Franklin St
Length: 0.50 miles
Directions: N-S, SW-NE
Address range: 600 to 1199
Directions: N-S, SW-NE
Address range: 600 to 1199
N Broom St
Length: 0.42 miles
Direction: SW-NE
Address range: 700 to 1199
Direction: SW-NE
Address range: 700 to 1199
W 9th St
Length: 0.37 miles
Direction: E-W
Address range: 1000 to 1399
Direction: E-W
Address range: 1000 to 1399
W 10th St
Length: 0.37 miles
Directions: E-W, SE-NW
Address range: 1000 to 1399
Directions: E-W, SE-NW
Address range: 1000 to 1399
N Van Buren St
Length: 0.35 miles
Directions: N-S, SW-NE
Address range: 824 to 1299
Directions: N-S, SW-NE
Address range: 824 to 1299
N Jackson St
Length: 0.32 miles
Direction: SW-NE
Address range: 809 to 1299
Direction: SW-NE
Address range: 809 to 1299
N Harrison St
Length: 0.24 miles
Direction: SW-NE
Address range: 700 to 999
Direction: SW-NE
Address range: 700 to 999
W 7th St
Length: 0.21 miles
Direction: E-W
Address range: 1200 to 1399
Direction: E-W
Address range: 1200 to 1399
W 8th St
Length: 0.21 miles
Direction: E-W
Address range: 1200 to 1399
Direction: E-W
Address range: 1200 to 1399
W 11th St
Length: 0.21 miles
Directions: E-W, SE-NW
Address range: 1300 to 1499
Directions: E-W, SE-NW
Address range: 1300 to 1499
Kennett Pl
Length: 0.11 miles
Directions: N-S, SW-NE
Address range: 1100 to 1199
Directions: N-S, SW-NE
Address range: 1100 to 1199
N Rodney St
Length: 0.09 miles
Direction: SW-NE
Address range: 1100 to 1199
Direction: SW-NE
Address range: 1100 to 1199
Park Pl
Length: 0.08 miles
Directions: E-W, SE-NW
Address range: 1000 to 1099
Directions: E-W, SE-NW
Address range: 1000 to 1099
Kirk Ave
Length: 0.08 miles
Directions: E-W, SE-NW
Address range: 1000 to 1099
Directions: E-W, SE-NW
Address range: 1000 to 1099
W 6th St
Length: 0.04 miles
Directions: E-W, SE-NW
Address range: 1254 to 1299
Directions: E-W, SE-NW
Address range: 1254 to 1299