Creekside neighborhood in San Leandro, California (CA), 94577 detailed profile
Settings
X


Business Search - 14 Million verified businesses
Area: 0.182 square miles
Population: 2,173
Population density:
| Creekside: | 11,955 people per square mile |
| San Leandro: | 6,610 people per square mile |

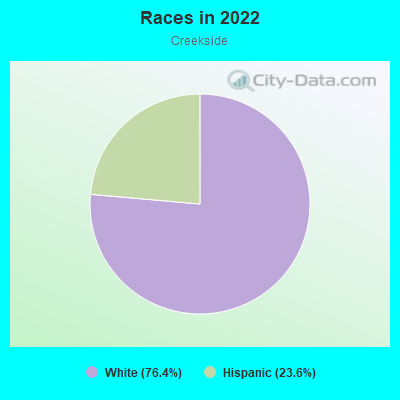
- 66229.7%Hispanic or Latino
- 56425.3%White
- 39717.8%Asian
- 34915.7%Black
- 1777.9%Two or more races
- 562.5%Some other race
- 150.7%Native Hawaiian and Other
Pacific Islander - 80.4%American Indian

Median household income in 2022:
| Creekside: | $145,812 |
| San Leandro: | $92,651 |
Distribution of median household income
![Distribution of median household income]()
- 64Less than $10,000
- 93$10,000 to $19,999
- 21$20,000 to $29,999
- 29$30,000 to $39,999
- 45$40,000 to $49,999
- 68$50,000 to $59,999
- 34$60,000 to $74,999
- 109$75,000 to $99,999
- 109$100,000 to $124,999
- 81$125,000 to $149,999
- 60$150,000 to $199,999
- 210$200,000 or more

Distribution of owner-occupied house/condo value
![Distribution of owner-occupied house/condo value]()
- 11Less than $50,000
- 19$50,000 to $99,999
- 26$200,000 to $249,999
- 15$300,000 to $399,999
- 9$400,000 to $499,999
- 12$500,000 to $749,999
- 149$750,000 to $999,999
- 146$1,000,000 or more

Distribution of rent paid by renters
![Distribution of rent paid by renters]()
- 129$200 to $299
- 39$300 to $399
- 17$500 to $599
- 9$600 to $699
- 8$700 to $799
- 16$900 to $999
- 48$1,000 to $1,249
- 28$1,250 to $1,499
- 148$1,500 to $1,999
- 303$2,000 or more

| Males: | 1,145 |
| Females: | 1,028 |
Males:
| This neighborhood: | 45.7 years |
| Whole city: | 40.3 years |
| This neighborhood: | 47.3 years |
| Whole city: | 45.2 years |
Average household size:
| Creekside: | 2.6 people |
| San Leandro: | 2.9 people |
Percentage of family households:
| Creekside: | 42.4% |
| San Leandro: | 44.4% |
| Here: | 45.3% |
| San Leandro: | 49.6% |
Percentage of married-couple families with children (among all households):
| Creekside: | 34.3% |
| San Leandro: | 26.2% |
Percentage of single-mother households (among all households):
| Creekside: | 2.2% |
| San Leandro: | 7.1% |
Percentage of never married males 15 years old and over:
Percentage of never married females 15 years old and over:
| Creekside: | 25.2% |
| San Leandro: | 18.2% |
Percentage of never married females 15 years old and over:
| Creekside: | 9.2% |
| city: | 16.0% |
Percentage of people that speak English not well or not at all:
| Creekside: | 3.4% |
| San Leandro: | 12.0% |
Percentage of people born in this state:
Percentage of people born in another U.S. state:
Percentage of native residents but born outside the U.S.:
Percentage of foreign born residents:
| Here: | 54.5% |
| San Leandro: | 44.1% |
Percentage of people born in another U.S. state:
| Creekside: | 14.2% |
| San Leandro: | 9.8% |
Percentage of native residents but born outside the U.S.:
| Here: | 2.4% |
| city: | 1.7% |
Percentage of foreign born residents:
| Here: | 28.9% |
| San Leandro: | 44.4% |
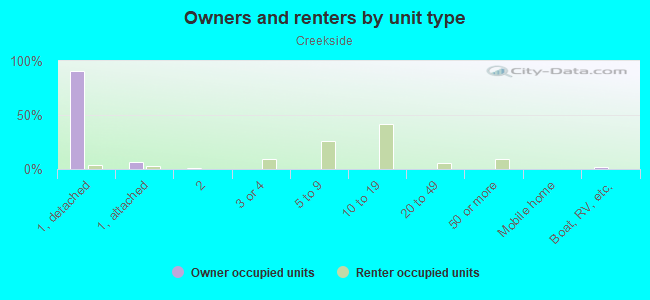
Owner-occupied
Renter-occupied

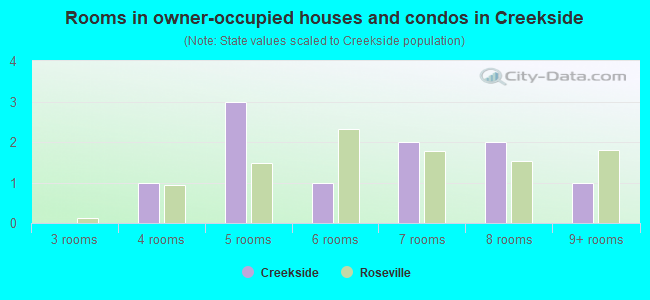
- Rooms in owner-occupied houses and condos in Creekside
- 101 room
- 02 rooms
- 253 rooms
- 124 rooms
- 275 rooms
- 646 rooms
- 737 rooms
- 728 rooms
- 509+ rooms
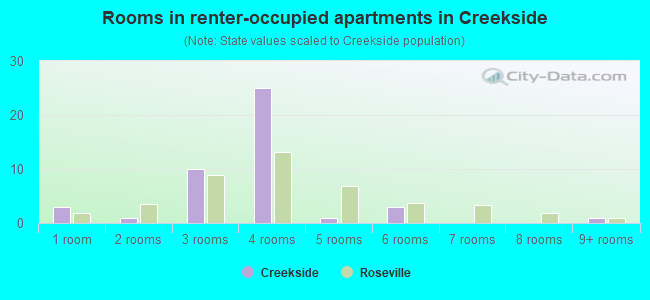
- Rooms in renter-occupied apartments in Creekside
- 861 room
- 1552 rooms
- 733 rooms
- 1354 rooms
- 495 rooms
- 776 rooms
- 567 rooms
- 108 rooms
- 159+ rooms
Owner-occupied
Renter-occupied
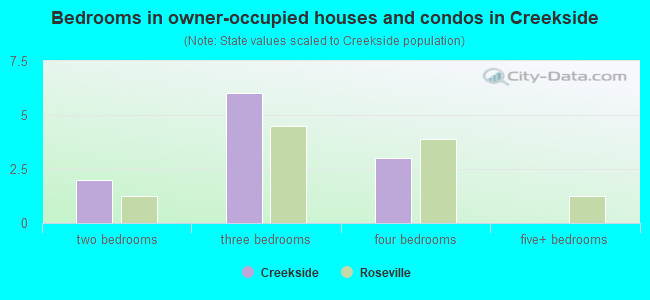
- Bedrooms in owner-occupied houses and condos in Creekside
- 10no bedroom
- 01 bedroom
- 872 bedrooms
- 1103 bedrooms
- 924 bedrooms
- 345+ bedrooms
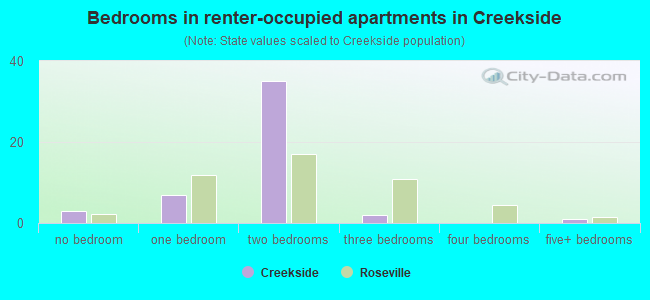
- Bedrooms in renter-occupied apartments in Creekside
- 100no bedroom
- 1771 bedroom
- 2352 bedrooms
- 433 bedrooms
- 144 bedrooms
- 35+ bedrooms
Average number of cars or other vehicles available in houses/condos:
Average number of cars or other vehicles available in apartments:
| This neighborhood: | 2.6 |
| San Leandro: | 2.2 |
Average number of cars or other vehicles available in apartments:
| Here: | 1.3 |
| city: | 1.3 |
Percentage of units with a mortgage:
| Creekside: | 85.3% |
| San Leandro: | 63.4% |
Average estimated value of detached houses in 2022 (42.4% of all units):
| Creekside: | $910,171 |
| California: | $988,808 |
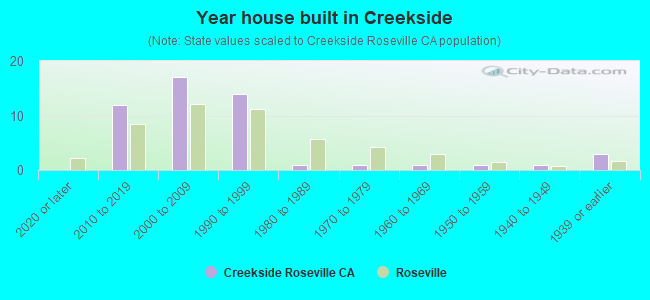
- Year house built in Creekside
- 02020 or later
- 322010 to 2019
- 442000 to 2009
- 1001990 to 1999
- 1121980 to 1989
- 881970 to 1979
- 641960 to 1969
- 1071950 to 1959
- 1731940 to 1949
- 2631939 or earlier
City-data.com crime index for city in 2020 (higher means more crime):
| City: | 374.8 |
| U.S. average: | 219.5 |
Travel time to work (commute)
![Travel time to work (commute)]()
- 6Less than 5 minutes
- 395 to 9 minutes
- 12910 to 14 minutes
- 11315 to 19 minutes
- 7620 to 24 minutes
- 6125 to 29 minutes
- 11230 to 34 minutes
- 2635 to 39 minutes
- 5740 to 44 minutes
- 24245 to 59 minutes
- 16960 to 89 minutes
- 4290 or more minutes

Means of transportation to work
![Means of transportation to work]()
- 60.5%740Drove a car alone
- 11.4%140Carpooled
- 4.3%53Bus
- 8.1%99Subway or elevated rail
- 1.6%20Long-distance train or commuter rail
- 0.6%7Light rail, streetcar or trolley
- 0.7%8Taxi
- 1.6%20Motorcycle
- 0.7%9Bicycle
- 3.8%46Walked
- 1.2%15Other means
- 8.7%107Worked at home

Time leaving home to go to work
![Time leaving home to go to work]()
- 4912:00 a.m. to 4:59 a.m.
- 85:00 a.m. to 5:29 a.m.
- 605:30 a.m. to 5:59 a.m.
- 966:00 a.m. to 6:29 a.m.
- 946:30 a.m. to 6:59 a.m.
- 1007:00 a.m. to 7:29 a.m.
- 1327:30 a.m. to 7:59 a.m.
- 568:00 a.m. to 8:29 a.m.
- 268:30 a.m. to 8:59 a.m.
- 1619:00 a.m. to 9:59 a.m.
- 4310:00 a.m. to 10:59 a.m.
- 5911:00 a.m. to 11:59 a.m.
- 4812:00 p.m. to 3:59 p.m.
- 424:00 p.m. to 11:59 p.m.

Occupations of males:
- Percentage of males in management occupations (except farmers):
Here: 13.5% city: 9.9%
- Percentage of males in business and financial operations occupations:
Here: 4.3% city: 4.3%
- Percentage of males in computer and mathematical occupations:
Here: 7.3% city: 6.7%
- Percentage of males in architecture and engineering occupations:
Here: 8.8% city: 3.6%
- Percentage of males in life, physical, and social science occupations:
Here: 2.8% city: 1.6%
- Percentage of males in community and social services occupations:
Here: 1.4% city: 1.7%
- Percentage of males in legal occupations:
Here: 3.3% city: 0.7%
- Percentage of males in education, training, and library occupations:
Here: 2.7% city: 3.0%
- Percentage of males in arts, design, entertainment, sports, and media occupations:
Here: 2.1% city: 1.5%
- Percentage of males in healthcare practitioners and technical occupations:
Here: 2.2% city: 2.2%
- Percentage of males in service occupations:
Here: 11.0% city: 14.6%
- Percentage of males in sales and office occupations:
Here: 9.8% city: 14.8%
- Percentage of males in construction, extraction, and maintenance occupations:
Here: 1.4% city: 10.0%
- Percentage of males in production occupations:
Here: 12.6% city: 7.8%
- Percentage of males in transportation occupations:
Here: 6.7% city: 7.3%
- Percentage of males in material moving occupations:
Here: 8.5% city: 6.8%
Occupations of females:
- Percentage of females in management occupations (except farmers):
Here: 19.7% city: 9.2%
- Percentage of females in business and financial operations occupations:
Here: 5.7% city: 7.3%
- Percentage of females in computer and mathematical occupations:
Here: 3.2% city: 2.3%
- Percentage of females in life, physical, and social science occupations:
Here: 2.7% city: 1.4%
- Percentage of females in community and social services occupations:
Here: 4.4% city: 1.8%
- Percentage of females in legal occupations:
Here: 2.6% city: 1.5%
- Percentage of females in education, training, and library occupations:
Here: 3.2% city: 6.9%
- Percentage of females in healthcare practitioners and technical occupations:
Here: 18.1% city: 6.5%
- Percentage of females in service occupations:
Here: 12.5% city: 23.3%
- Percentage of females in sales and office occupations:
Here: 15.3% city: 26.6%
- Percentage of females in production occupations:
Here: 5.9% city: 5.3%
- Percentage of females in material moving occupations:
Here: 5.5% city: 3.5%
Percentage of people 16-64 in Armed Forces:
| Creekside: | 0.0% |
| San Leandro: | 0.1% |
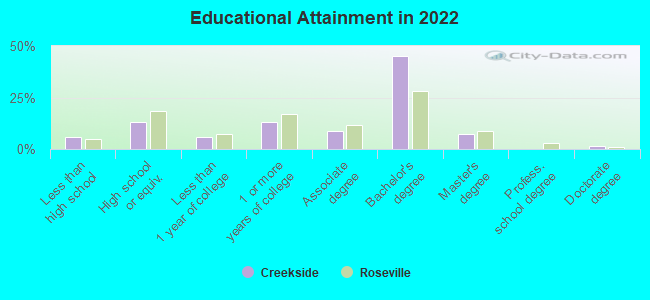
Education in this neighborhood (subdivision or community):
- Percentage of people 3 years and older in K-12 schools:
Creekside: 13.1% San Leandro: 14.4%
- Percentage of people 3 years and older in undergraduate colleges:
Creekside: 6.9% San Leandro: 5.5%
- Percentage of people 3 years and older in grad. or professional schools:
Creekside: 1.0% San Leandro: 1.6%
- Percentage of students K-12 enrolled in private schools:
Creekside: 59.3% San Leandro: 9.9%
Percentage of population below poverty level:
| Creekside: | 12.4% |
| San Leandro: | 7.4% |
Median year owner moved in (as recorded in 2022):
| Creekside: | 2004 |
| San Leandro: | 2006 |
Percentage of married-couple families with both working:
| Creekside: | 80.2% |
| San Leandro: | 62.2% |
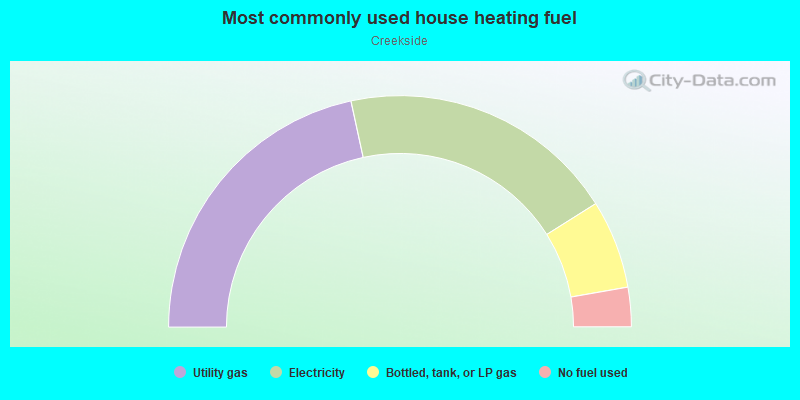
- 66.1%Utility gas
- 19.5%Electricity
- 4.7%Fuel oil, kerosene, etc.
- 2.2%No fuel used
- 2.1%Bottled, tank, or LP gas
- 2.1%Wood
- 1.9%Solar energy
- 1.5%Other fuel
Highways in this neighborhood:
State Hwy 185 (E 14th St)
Length: 0.34 miles
Direction: SE-NW
Direction: SE-NW
Roads and streets:
Dutton Ave
Length: 0.68 miles
Directions: E-W, SW-NE
Address range: 1 to 609
Directions: E-W, SW-NE
Address range: 1 to 609
Oakes Blvd
Length: 0.67 miles
Directions: E-W, SW-NE
Address range: 1 to 609
Directions: E-W, SW-NE
Address range: 1 to 609
Dutton
Length: 0.67 miles
Directions: E-W, SE-NW, SW-NE
Directions: E-W, SE-NW, SW-NE
Haas Ave
Length: 0.66 miles
Directions: E-W, SW-NE
Address range: 1 to 613
Directions: E-W, SW-NE
Address range: 1 to 613
Begier Ave
Length: 0.59 miles
Directions: E-W, SW-NE
Address range: 1 to 611
Directions: E-W, SW-NE
Address range: 1 to 611
Lee Ave
Length: 0.50 miles
Directions: E-W, N-S, SE-NW, SW-NE
Address range: 600 to 1099
Directions: E-W, N-S, SE-NW, SW-NE
Address range: 600 to 1099
Bancroft
Length: 0.34 miles
Direction: SE-NW
Direction: SE-NW
Arbor Dr
Length: 0.33 miles
Directions: N-S, SE-NW
Address range: 600 to 999
Directions: N-S, SE-NW
Address range: 600 to 999
Bancroft Ave
Length: 0.31 miles
Directions: N-S, SE-NW
Address range: 596 to 1029
Directions: N-S, SE-NW
Address range: 596 to 1029
Woodland Ave
Length: 0.27 miles
Direction: N-S
Address range: 600 to 999
Direction: N-S
Address range: 600 to 999
Glen Dr
Length: 0.17 miles
Direction: E-W
Address range: 500 to 613
Direction: E-W
Address range: 500 to 613
Pala Ave
Length: 0.16 miles
Direction: E-W
Address range: 500 to 617
Direction: E-W
Address range: 500 to 617
Karol Way
Length: 0.12 miles
Directions: E-W, N-S
Address range: 900 to 999
Directions: E-W, N-S
Address range: 900 to 999
Ramona Way
Length: 0.10 miles
Direction: N-S
Address range: 900 to 999
Direction: N-S
Address range: 900 to 999
Holman Ct
Length: 0.08 miles
Directions: N-S, SE-NW, SW-NE
Directions: N-S, SE-NW, SW-NE
Maple Ct
Length: 0.07 miles
Direction: SE-NW
Address range: 600 to 699
Direction: SE-NW
Address range: 600 to 699
Woodland Park
Length: 0.05 miles
Directions: E-W, SW-NE
Address range: 300 to 499
Directions: E-W, SW-NE
Address range: 300 to 499
Begier
Length: 0.02 miles
Directions: E-W, SW-NE
Directions: E-W, SW-NE
Other features:
San Leandro Crk
Length: 0.31 miles
Directions: E-W, N-S, SE-NW, SW-NE
Directions: E-W, N-S, SE-NW, SW-NE