Derby neighborhood in Commerce City, Colorado (CO), 80022 detailed profile
Settings
X

Business Search - 14 Million verified businesses
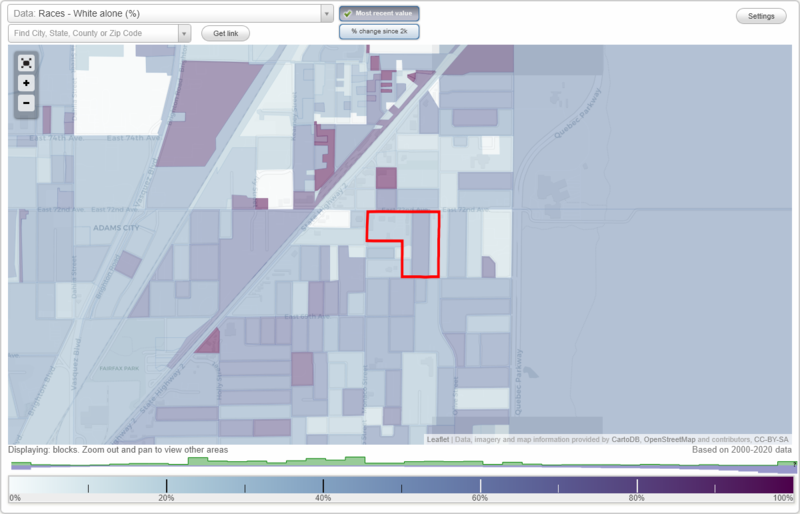
Area: 0.040 square miles
Population: 377
Population density:
| Derby: | 9,514 people per square mile |
| Commerce City: | 2,558 people per square mile |

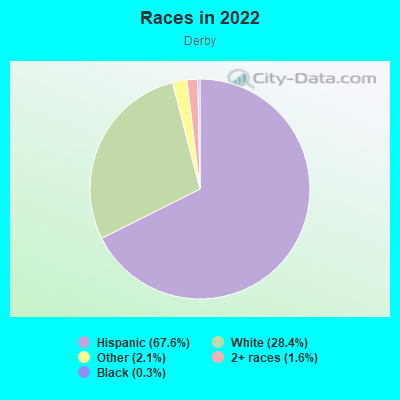
- 25567.6%Hispanic or Latino
- 10728.4%White
- 82.1%Some other race
- 61.6%Two or more races
- 10.3%Black
Median household income in 2022:
| Derby: | $46,303 |
| Commerce City: | $102,607 |
Distribution of median household income
![Distribution of median household income]()
- 3Less than $10,000
- 26$10,000 to $19,999
- 21$20,000 to $29,999
- 3$30,000 to $39,999
- 15$40,000 to $49,999
- 7$50,000 to $59,999
- 27$60,000 to $74,999
- 10$75,000 to $99,999
- 6$100,000 to $124,999
- 10$125,000 to $149,999
- 3$150,000 to $199,999
- 1$200,000 or more

Distribution of owner-occupied house/condo value
![Distribution of owner-occupied house/condo value]()
- 3Less than $50,000
- 2$100,000 to $149,999
- 8$150,000 to $199,999
- 8$200,000 to $249,999
- 12$250,000 to $299,999
- 26$300,000 to $399,999
- 3$400,000 to $499,999
- 1$500,000 to $749,999

Distribution of rent paid by renters
![Distribution of rent paid by renters]()
- 1$500 to $599
- 3$700 to $799
- 9$800 to $899
- 13$900 to $999
- 1$1,000 to $1,249
- 29$1,250 to $1,499
- 5$1,500 to $1,999
- 6$2,000 or more

Median rent in 2022:
| Derby: | $1,308 |
| Commerce City: | $1,047 |
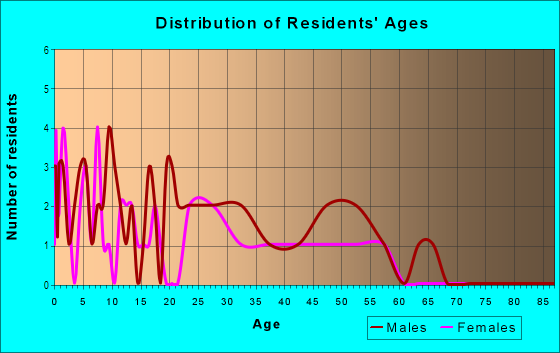
| Males: | 174 |
| Females: | 202 |
Males:
| This neighborhood: | 34.7 years |
| Whole city: | 31.6 years |
| This neighborhood: | 27.2 years |
| Whole city: | 32.2 years |
Average household size:
| Derby: | 3.1 people |
| Commerce City: | 3.1 people |
Percentage of family households:
| Derby: | 73.5% |
| Commerce City: | 72.9% |
| Here: | 70.0% |
| Commerce City: | 65.4% |
Percentage of married-couple families with children (among all households):
| Derby: | 30.3% |
| Commerce City: | 24.4% |
Percentage of single-mother households (among all households):
| Derby: | 4.4% |
| Commerce City: | 4.8% |
Percentage of never married males 15 years old and over:
Percentage of never married females 15 years old and over:
| Derby: | 9.9% |
| Commerce City: | 12.8% |
Percentage of never married females 15 years old and over:
| Derby: | 14.3% |
| city: | 9.7% |
Percentage of people that speak English not well or not at all:
| Derby: | 18.4% |
| Commerce City: | 6.5% |
Percentage of people born in this state:
Percentage of people born in another U.S. state:
Percentage of native residents but born outside the U.S.:
Percentage of foreign born residents:
| Here: | 56.5% |
| Commerce City: | 51.4% |
Percentage of people born in another U.S. state:
| Derby: | 18.8% |
| Commerce City: | 30.5% |
Percentage of native residents but born outside the U.S.:
| Here: | 2.2% |
| city: | 1.1% |
Percentage of foreign born residents:
| Here: | 22.4% |
| Commerce City: | 17.0% |
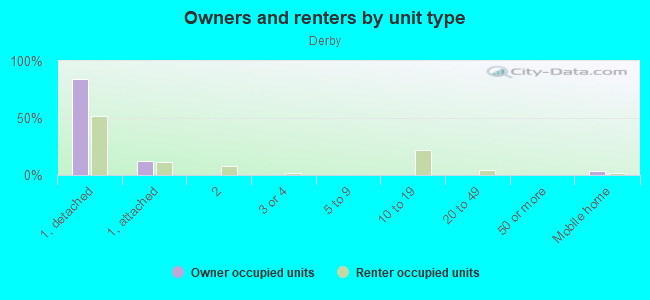
Owner-occupied
Renter-occupied

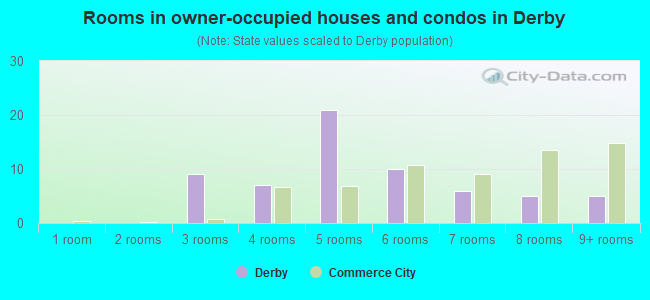
- Rooms in owner-occupied houses and condos in Derby
- 01 room
- 02 rooms
- 93 rooms
- 74 rooms
- 215 rooms
- 106 rooms
- 67 rooms
- 58 rooms
- 59+ rooms
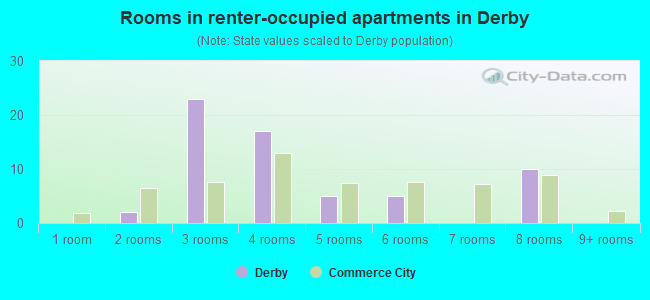
- Rooms in renter-occupied apartments in Derby
- 01 room
- 22 rooms
- 233 rooms
- 174 rooms
- 55 rooms
- 56 rooms
- 07 rooms
- 108 rooms
- 09+ rooms
Owner-occupied
Renter-occupied
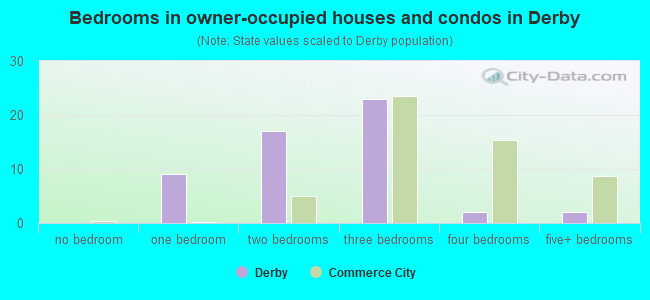
- Bedrooms in owner-occupied houses and condos in Derby
- 0no bedroom
- 91 bedroom
- 172 bedrooms
- 233 bedrooms
- 24 bedrooms
- 25+ bedrooms
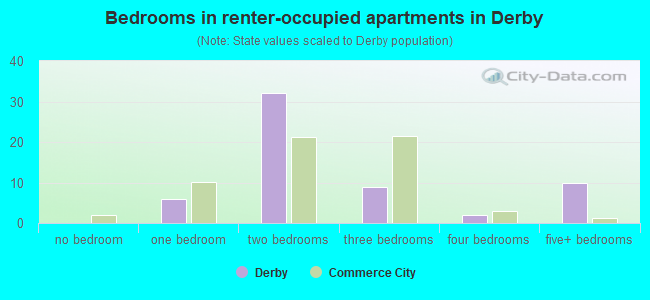
- Bedrooms in renter-occupied apartments in Derby
- 0no bedroom
- 61 bedroom
- 322 bedrooms
- 93 bedrooms
- 24 bedrooms
- 105+ bedrooms
Average number of cars or other vehicles available in houses/condos:
Average number of cars or other vehicles available in apartments:
| This neighborhood: | 2.4 |
| Commerce City: | 2.4 |
Average number of cars or other vehicles available in apartments:
| Here: | 1.8 |
| city: | 1.5 |
Percentage of units with a mortgage:
| Derby: | 64.2% |
| Commerce City: | 78.2% |
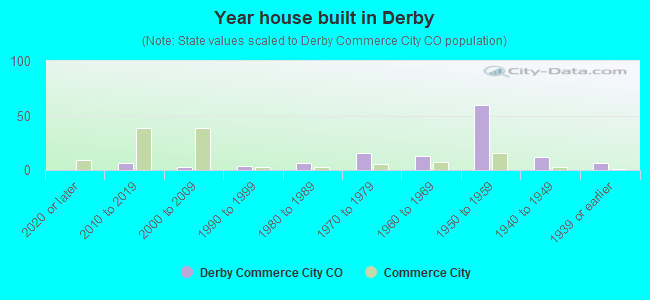
- Year house built in Derby
- 02020 or later
- 62010 to 2019
- 32000 to 2009
- 41990 to 1999
- 61980 to 1989
- 161970 to 1979
- 131960 to 1969
- 601950 to 1959
- 121940 to 1949
- 61939 or earlier
City-data.com crime index for city in 2020 (higher means more crime):
| City: | 370.1 |
| U.S. average: | 219.5 |
Travel time to work (commute)
![Travel time to work (commute)]()
- 145 to 9 minutes
- 2310 to 14 minutes
- 2615 to 19 minutes
- 2320 to 24 minutes
- 1225 to 29 minutes
- 2730 to 34 minutes
- 540 to 44 minutes
- 1345 to 59 minutes
- 860 to 89 minutes
- 490 or more minutes

Means of transportation to work
![Means of transportation to work]()
- 63.3%109Drove a car alone
- 21.5%37Carpooled
- 0.6%1Bus
- 8.1%14Light rail, streetcar or trolley
- 5.2%9Worked at home

Time leaving home to go to work
![Time leaving home to go to work]()
- 115:00 a.m. to 5:29 a.m.
- 205:30 a.m. to 5:59 a.m.
- 176:00 a.m. to 6:29 a.m.
- 306:30 a.m. to 6:59 a.m.
- 227:00 a.m. to 7:29 a.m.
- 107:30 a.m. to 7:59 a.m.
- 88:00 a.m. to 8:29 a.m.
- 78:30 a.m. to 8:59 a.m.
- 49:00 a.m. to 9:59 a.m.
- 812:00 p.m. to 3:59 p.m.
- 184:00 p.m. to 11:59 p.m.

Occupations of males:
- Percentage of males in management occupations (except farmers):
Here: 9.8% city: 10.9%
- Percentage of males in business and financial operations occupations:
Here: 1.5% city: 5.6%
- Percentage of males in computer and mathematical occupations:
Here: 1.8% city: 4.9%
- Percentage of males in architecture and engineering occupations:
Here: 2.5% city: 1.7%
- Percentage of males in education, training, and library occupations:
Here: 2.4% city: 1.4%
- Percentage of males in healthcare practitioners and technical occupations:
Here: 1.6% city: 1.2%
- Percentage of males in service occupations:
Here: 7.7% city: 10.9%
- Percentage of males in sales and office occupations:
Here: 15.0% city: 13.4%
- Percentage of males in construction, extraction, and maintenance occupations:
Here: 35.2% city: 18.4%
- Percentage of males in production occupations:
Here: 14.4% city: 6.6%
- Percentage of males in transportation occupations:
Here: 6.5% city: 7.9%
- Percentage of males in material moving occupations:
Here: 8.8% city: 7.1%
Occupations of females:
- Percentage of females in management occupations (except farmers):
Here: 2.9% city: 13.2%
- Percentage of females in business and financial operations occupations:
Here: 2.9% city: 8.3%
- Percentage of females in computer and mathematical occupations:
Here: 1.3% city: 1.3%
- Percentage of females in architecture and engineering occupations:
Here: 3.3% city: 0.4%
- Percentage of females in community and social services occupations:
Here: 1.1% city: 2.1%
- Percentage of females in education, training, and library occupations:
Here: 11.4% city: 6.6%
- Percentage of females in healthcare practitioners and technical occupations:
Here: 2.4% city: 7.6%
- Percentage of females in service occupations:
Here: 40.1% city: 18.4%
- Percentage of females in sales and office occupations:
Here: 32.8% city: 29.5%
- Percentage of females in production occupations:
Here: 3.6% city: 4.1%
- Percentage of females in material moving occupations:
Here: 7.1% city: 3.3%
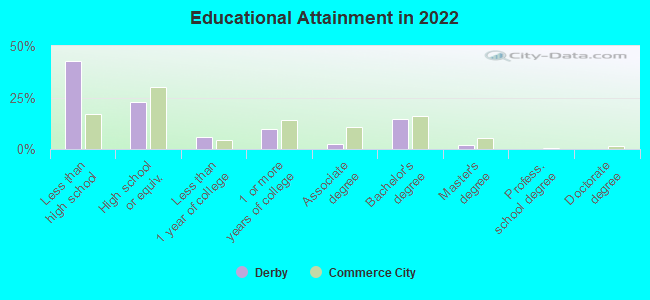
Education in this neighborhood (subdivision or community):
- Percentage of people 3 years and older in K-12 schools:
Derby: 26.2% Commerce City: 23.9%
- Percentage of people 3 years and older in undergraduate colleges:
Derby: 4.4% Commerce City: 2.7%
- Percentage of people 3 years and older in grad. or professional schools:
Derby: 1.7% Commerce City: 0.9%
- Percentage of students K-12 enrolled in private schools:
Derby: 0.0% Commerce City: 5.7%
Percentage of population below poverty level:
| Derby: | 20.7% |
| Commerce City: | 17.2% |
Median year owner moved in (as recorded in 2022):
Median year renter moved in (as recorded in 2022):
| Derby: | 2012 |
| Commerce City: | 2016 |
Median year renter moved in (as recorded in 2022):
| Derby: | 2015 |
| Commerce City: | 2015 |
Percentage of married-couple families with both working:
| Derby: | 45.0% |
| Commerce City: | 73.2% |
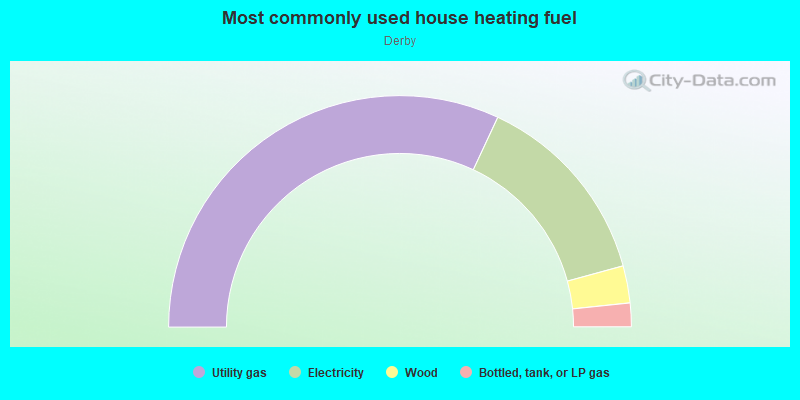
- 63.9%Utility gas
- 27.6%Electricity
- 5.2%Wood
- 3.3%Bottled, tank, or LP gas
Roads and streets:
Niagara St
Length: 0.04 miles
Direction: N-S
Address range: 7057 to 7110
Direction: N-S
Address range: 7057 to 7110