Downtown neighborhood in Lancaster, California (CA), 93534 detailed profile
Settings
X


Business Search - 14 Million verified businesses
Area: 0.477 square miles
Population: 2,973
Population density:
| Downtown: | 6,231 people per square mile |
| Lancaster: | 1,800 people per square mile |

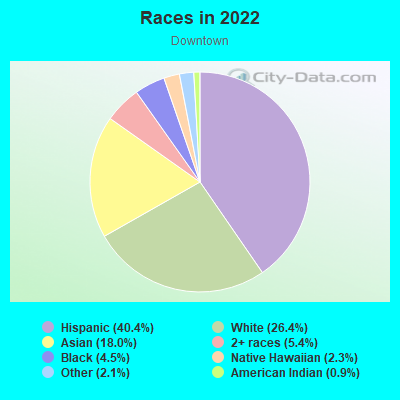
- 1,12536.6%Hispanic or Latino
- 74524.3%White
- 70222.9%Black
- 1745.7%Two or more races
- 1575.1%Some other race
- 1404.6%Asian
- 150.5%Native Hawaiian and Other
Pacific Islander - 120.4%American Indian
Median household income in 2022:
| Downtown: | $54,500 |
| Lancaster: | $79,113 |
Distribution of median household income
![Distribution of median household income]()
- 183Less than $10,000
- 400$10,000 to $19,999
- 188$20,000 to $29,999
- 90$30,000 to $39,999
- 123$40,000 to $49,999
- 51$50,000 to $59,999
- 45$60,000 to $74,999
- 191$75,000 to $99,999
- 48$100,000 to $124,999
- 52$125,000 to $149,999
- 56$150,000 to $199,999
- 18$200,000 or more

Distribution of owner-occupied house/condo value
![Distribution of owner-occupied house/condo value]()
- 85Less than $50,000
- 99$50,000 to $99,999
- 26$100,000 to $149,999
- 42$150,000 to $199,999
- 60$200,000 to $249,999
- 51$250,000 to $299,999
- 39$300,000 to $399,999
- 37$400,000 to $499,999
- 16$500,000 to $749,999
- 7$750,000 to $999,999
- 10$1,000,000 or more

Distribution of rent paid by renters
![Distribution of rent paid by renters]()
- 29Less than $100
- 11$100 to $199
- 229$200 to $299
- 92$300 to $399
- 18$400 to $499
- 69$500 to $599
- 195$600 to $699
- 220$700 to $799
- 85$800 to $899
- 94$900 to $999
- 198$1,000 to $1,249
- 139$1,250 to $1,499
- 152$1,500 to $1,999
- 32$2,000 or more

Median rent in 2022:
| Downtown: | $882 |
| Lancaster: | $1,438 |
| Males: | 1,259 |
| Females: | 1,713 |
Males:
| This neighborhood: | 34.3 years |
| Whole city: | 34.6 years |
| This neighborhood: | 38.2 years |
| Whole city: | 37.2 years |
Average household size:
| Downtown: | 2.7 people |
| Lancaster: | 3.2 people |
Percentage of family households:
| Downtown: | 26.9% |
| Lancaster: | 54.3% |
| Here: | 15.4% |
| Lancaster: | 48.2% |
Percentage of married-couple families with children (among all households):
| Downtown: | 15.1% |
| Lancaster: | 19.2% |
Percentage of single-mother households (among all households):
| Downtown: | 32.0% |
| Lancaster: | 9.0% |
Percentage of never married males 15 years old and over:
Percentage of never married females 15 years old and over:
| Downtown: | 17.5% |
| Lancaster: | 21.7% |
Percentage of never married females 15 years old and over:
| Downtown: | 30.7% |
| city: | 20.6% |
Percentage of people that speak English not well or not at all:
| Downtown: | 7.6% |
| Lancaster: | 5.4% |
Percentage of people born in this state:
Percentage of people born in another U.S. state:
Percentage of native residents but born outside the U.S.:
Percentage of foreign born residents:
| Here: | 72.6% |
| Lancaster: | 71.9% |
Percentage of people born in another U.S. state:
| Downtown: | 12.8% |
| Lancaster: | 11.5% |
Percentage of native residents but born outside the U.S.:
| Here: | 0.6% |
| city: | 0.7% |
Percentage of foreign born residents:
| Here: | 14.0% |
| Lancaster: | 15.9% |
Owner-occupied
Renter-occupied

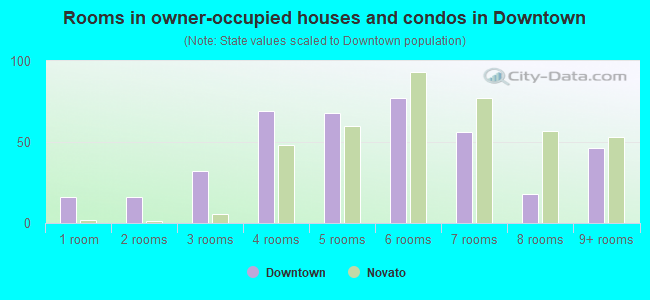
- Rooms in owner-occupied houses and condos in Downtown
- 71 room
- 182 rooms
- 133 rooms
- 534 rooms
- 315 rooms
- 266 rooms
- 437 rooms
- 488 rooms
- 39+ rooms
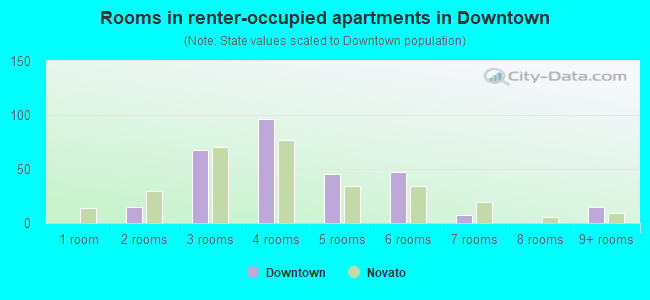
- Rooms in renter-occupied apartments in Downtown
- 2391 room
- 1092 rooms
- 3443 rooms
- 3614 rooms
- 1085 rooms
- 966 rooms
- 607 rooms
- 128 rooms
- 49+ rooms
Owner-occupied
Renter-occupied
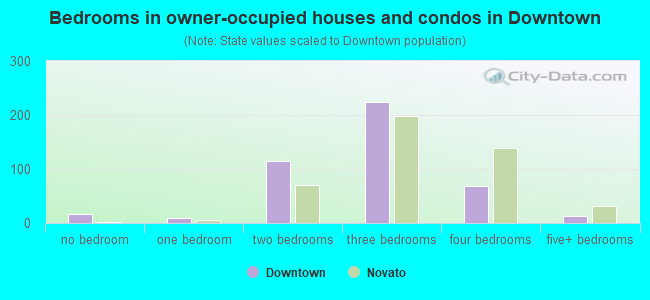
- Bedrooms in owner-occupied houses and condos in Downtown
- 8no bedroom
- 141 bedroom
- 1052 bedrooms
- 663 bedrooms
- 4544 bedrooms
- 105+ bedrooms
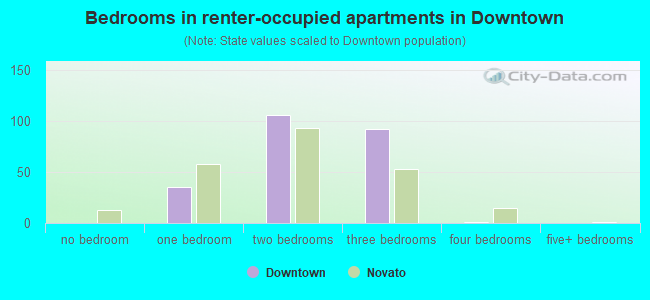
- Bedrooms in renter-occupied apartments in Downtown
- 246no bedroom
- 4091 bedroom
- 4162 bedrooms
- 2063 bedrooms
- 124 bedrooms
- 255+ bedrooms
Average number of cars or other vehicles available in houses/condos:
Average number of cars or other vehicles available in apartments:
| This neighborhood: | |
| Lancaster: |
Average number of cars or other vehicles available in apartments:
| Here: | 1.0 |
| city: | 1.7 |
Percentage of units with a mortgage:
| Downtown: | 71.6% |
| Lancaster: | 73.8% |
Average estimated value of detached houses in 2022 (32.5% of all units):
| Downtown: | $259,663 |
| California: | $988,808 |
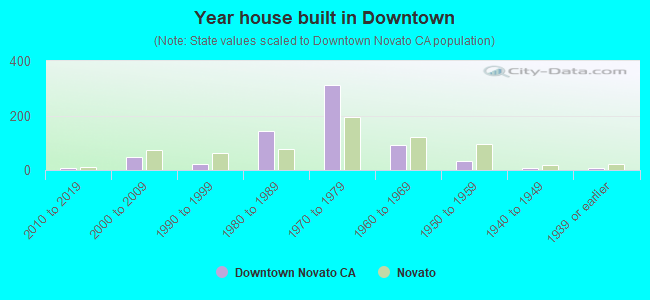
- Year house built in Downtown
- 02020 or later
- 622010 to 2019
- 2482000 to 2009
- 1551990 to 1999
- 2331980 to 1989
- 2271970 to 1979
- 1471960 to 1969
- 1191950 to 1959
- 1381940 to 1949
- 1751939 or earlier
City-data.com crime index for city in 2020 (higher means more crime):
| City: | 317.8 |
| U.S. average: | 219.5 |
Travel time to work (commute)
![Travel time to work (commute)]()
- 141Less than 5 minutes
- 715 to 9 minutes
- 19110 to 14 minutes
- 14315 to 19 minutes
- 10720 to 24 minutes
- 1625 to 29 minutes
- 1230 to 34 minutes
- 1035 to 39 minutes
- 2040 to 44 minutes
- 4745 to 59 minutes
- 6460 to 89 minutes
- 3690 or more minutes

Means of transportation to work
![Means of transportation to work]()
- 77.7%721Drove a car alone
- 6.7%62Carpooled
- 1.2%11Bus
- 11.3%105Long-distance train or commuter rail
- 0.9%8Motorcycle
- 5.3%49Bicycle
- 3.6%33Walked
- 3.0%28Other means
- 7.7%71Worked at home

Time leaving home to go to work
![Time leaving home to go to work]()
- 2912:00 a.m. to 4:59 a.m.
- 575:00 a.m. to 5:29 a.m.
- 305:30 a.m. to 5:59 a.m.
- 886:00 a.m. to 6:29 a.m.
- 426:30 a.m. to 6:59 a.m.
- 1837:00 a.m. to 7:29 a.m.
- 567:30 a.m. to 7:59 a.m.
- 1698:00 a.m. to 8:29 a.m.
- 418:30 a.m. to 8:59 a.m.
- 19:00 a.m. to 9:59 a.m.
- 2310:00 a.m. to 10:59 a.m.
- 411:00 a.m. to 11:59 a.m.
- 9912:00 p.m. to 3:59 p.m.
- 344:00 p.m. to 11:59 p.m.

Occupations of males:
- Percentage of males in management occupations (except farmers):
Here: 24.3% city: 7.2%
- Percentage of males in business and financial operations occupations:
Here: 3.6% city: 3.4%
- Percentage of males in computer and mathematical occupations:
Here: 2.2% city: 2.6%
- Percentage of males in architecture and engineering occupations:
Here: 4.8% city: 5.2%
- Percentage of males in community and social services occupations:
Here: 1.6% city: 1.7%
- Percentage of males in arts, design, entertainment, sports, and media occupations:
Here: 7.5% city: 1.7%
- Percentage of males in service occupations:
Here: 21.4% city: 18.0%
- Percentage of males in sales and office occupations:
Here: 3.8% city: 13.4%
- Percentage of males in construction, extraction, and maintenance occupations:
Here: 6.4% city: 12.7%
- Percentage of males in production occupations:
Here: 3.1% city: 8.4%
- Percentage of males in transportation occupations:
Here: 5.0% city: 7.6%
- Percentage of males in material moving occupations:
Here: 14.0% city: 4.9%
Occupations of females:
- Percentage of females in management occupations (except farmers):
Here: 1.3% city: 8.2%
- Percentage of females in community and social services occupations:
Here: 9.8% city: 4.1%
- Percentage of females in education, training, and library occupations:
Here: 5.7% city: 10.6%
- Percentage of females in service occupations:
Here: 50.4% city: 23.3%
- Percentage of females in sales and office occupations:
Here: 20.3% city: 25.3%
- Percentage of females in construction, extraction, and maintenance occupations:
Here: 3.2% city: 0.2%
- Percentage of females in production occupations:
Here: 1.1% city: 3.1%
- Percentage of females in transportation occupations:
Here: 5.3% city: 2.4%
Percentage of people 16-64 in Armed Forces:
| Downtown: | 0.4% |
| Lancaster: | 0.3% |
Education in this neighborhood (subdivision or community):
- Percentage of people 3 years and older in K-12 schools:
Downtown: 21.5% Lancaster: 21.0%
- Percentage of people 3 years and older in undergraduate colleges:
Downtown: 3.3% Lancaster: 5.4%
- Percentage of people 3 years and older in grad. or professional schools:
Downtown: 1.5% Lancaster: 1.7%
- Percentage of students K-12 enrolled in private schools:
Downtown: 17.3% Lancaster: 8.1%
Percentage of population below poverty level:
| Downtown: | 28.1% |
| Lancaster: | 15.3% |
Median year renter moved in (as recorded in 2022):
| Downtown: | 2015 |
| Lancaster: | 2018 |
Percentage of married-couple families with both working:
| Downtown: | 137.2% |
| Lancaster: | 55.8% |

- 63.6%Utility gas
- 25.3%Electricity
- 3.2%No fuel used
- 3.1%Wood
- 2.9%Solar energy
- 1.1%Bottled, tank, or LP gas
- 0.8%Other fuel
Highways in this neighborhood:
Sierra Hwy
Length: 0.64 miles
Direction: N-S
Address range: 44700 to 45199
Direction: N-S
Address range: 44700 to 45199
W Ave I
Length: 0.45 miles
Direction: E-W
Address range: 500 to 799
Direction: E-W
Address range: 500 to 799
Roads and streets:
W Lancaster Blvd
Length: 0.86 miles
Direction: E-W
Address range: 500 to 999
Direction: E-W
Address range: 500 to 999
W Jackman St
Length: 0.73 miles
Direction: E-W
Address range: 500 to 899
Direction: E-W
Address range: 500 to 899
Fern Ave
Length: 0.70 miles
Direction: N-S
Address range: 44700 to 45199
Direction: N-S
Address range: 44700 to 45199
W Newgrove Ave (W Newgrove St)
Length: 0.69 miles
Direction: E-W
Address range: 500 to 899
Direction: E-W
Address range: 500 to 899
W Milling St
Length: 0.69 miles
Direction: E-W
Address range: 500 to 899
Direction: E-W
Address range: 500 to 899
Elm Ave
Length: 0.68 miles
Direction: N-S
Address range: 44700 to 45099
Direction: N-S
Address range: 44700 to 45099
Date Ave
Length: 0.67 miles
Direction: N-S
Address range: 44700 to 45199
Direction: N-S
Address range: 44700 to 45199
Cedar Ave
Length: 0.66 miles
Direction: N-S
Address range: 44700 to 45299
Direction: N-S
Address range: 44700 to 45299
Beech Ave
Length: 0.65 miles
Direction: N-S
Address range: 44700 to 45299
Direction: N-S
Address range: 44700 to 45299
W Kettering St
Length: 0.43 miles
Direction: E-W
Address range: 524 to 799
Direction: E-W
Address range: 524 to 799
Fig Ave
Length: 0.38 miles
Direction: N-S
Address range: 44700 to 45099
Direction: N-S
Address range: 44700 to 45099
Gadsden Ave
Length: 0.29 miles
Directions: N-S, SE-NW
Address range: 44715 to 44899
Directions: N-S, SE-NW
Address range: 44715 to 44899
10th St W
Length: 0.25 miles
Direction: N-S
Address range: 44826 to 44999
Direction: N-S
Address range: 44826 to 44999
Genoa Ave
Length: 0.25 miles
Direction: N-S
Address range: 44700 to 44899
Direction: N-S
Address range: 44700 to 44899
Kildare St
Length: 0.14 miles
Directions: E-W, SE-NW
Directions: E-W, SE-NW
W Ivesbrook St
Length: 0.09 miles
Direction: E-W
Address range: 500 to 599
Direction: E-W
Address range: 500 to 599
W Kildare St
Length: 0.09 miles
Direction: E-W
Address range: 800 to 899
Direction: E-W
Address range: 800 to 899
Railroad features:
Southern Pacific RR
Length: 0.90 miles
Directions: N-S, SE-NW
Directions: N-S, SE-NW