East Main neighborhood in Bellevue, Washington (WA), 98004 detailed profile
Settings
X


Business Search - 14 Million verified businesses
Area: 0.093 square miles
Population: 782
Population density:
| East Main: | 8,384 people per square mile |
| Bellevue: | 4,968 people per square mile |

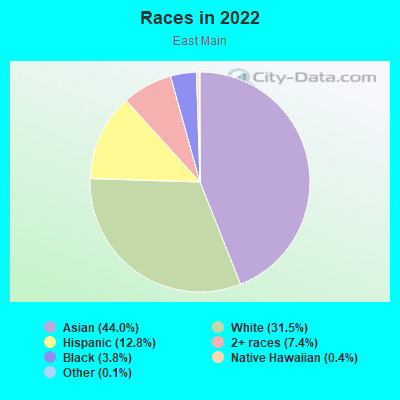
- 35044.0%Asian
- 25131.5%White
- 10212.8%Hispanic or Latino
- 597.4%Two or more races
- 303.8%Black
- 30.4%Native Hawaiian and Other
Pacific Islander - 10.1%Some other race
Median household income in 2022:
| East Main: | $142,708 |
| Bellevue: | $153,779 |
Distribution of median household income
![Distribution of median household income]()
- 8Less than $10,000
- 5$10,000 to $19,999
- 14$20,000 to $29,999
- 22$30,000 to $39,999
- 35$40,000 to $49,999
- 13$50,000 to $59,999
- 22$60,000 to $74,999
- 37$75,000 to $99,999
- 53$100,000 to $124,999
- 23$125,000 to $149,999
- 21$150,000 to $199,999
- 130$200,000 or more

Distribution of owner-occupied house/condo value
![Distribution of owner-occupied house/condo value]()
- 2Less than $50,000
- 4$200,000 to $249,999
- 2$300,000 to $399,999
- 25$400,000 to $499,999
- 10$500,000 to $749,999
- 25$750,000 to $999,999
- 96$1,000,000 or more

Distribution of rent paid by renters
![Distribution of rent paid by renters]()
- 11$900 to $999
- 5$1,000 to $1,249
- 9$1,250 to $1,499
- 59$1,500 to $1,999
- 125$2,000 or more

Median rent in 2022:
| East Main: | $2,158 |
| Bellevue: | $2,001 |
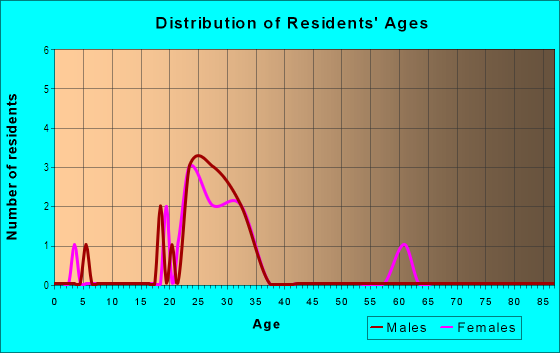
| Males: | 388 |
| Females: | 393 |
Males:
| This neighborhood: | 35.2 years |
| Whole city: | 37.5 years |
| This neighborhood: | 34.8 years |
| Whole city: | 40.9 years |
Average household size:
| East Main: | 16.3 people |
| Bellevue: | 2.4 people |
Percentage of family households:
| East Main: | 43.5% |
| Bellevue: | 51.7% |
| Here: | 46.0% |
| Bellevue: | 56.6% |
Percentage of married-couple families with children (among all households):
| East Main: | 41.9% |
| Bellevue: | 35.0% |
Percentage of single-mother households (among all households):
| East Main: | 5.2% |
| Bellevue: | 5.0% |
Percentage of never married males 15 years old and over:
Percentage of never married females 15 years old and over:
| East Main: | 18.9% |
| Bellevue: | 18.3% |
Percentage of never married females 15 years old and over:
| East Main: | 18.1% |
| city: | 11.9% |
Percentage of people that speak English not well or not at all:
| East Main: | 0.0% |
| Bellevue: | 5.7% |
Percentage of people born in this state:
Percentage of people born in another U.S. state:
Percentage of native residents but born outside the U.S.:
Percentage of foreign born residents:
| Here: | 29.2% |
| Bellevue: | 27.4% |
Percentage of people born in another U.S. state:
| East Main: | 30.4% |
| Bellevue: | 27.2% |
Percentage of native residents but born outside the U.S.:
| Here: | 1.8% |
| city: | 2.3% |
Percentage of foreign born residents:
| Here: | 38.7% |
| Bellevue: | 43.1% |
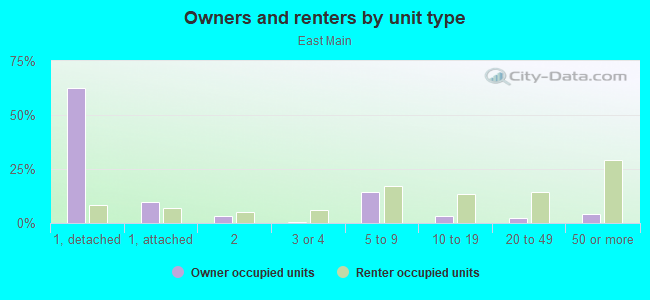
Owner-occupied
Renter-occupied

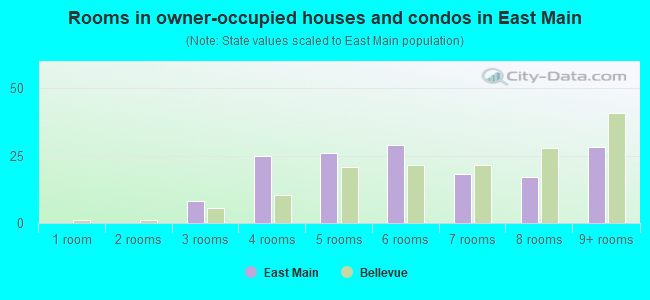
- Rooms in owner-occupied houses and condos in East Main
- 01 room
- 02 rooms
- 83 rooms
- 254 rooms
- 265 rooms
- 296 rooms
- 187 rooms
- 178 rooms
- 289+ rooms
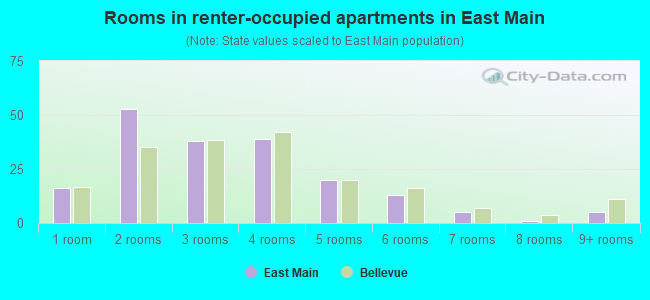
- Rooms in renter-occupied apartments in East Main
- 161 room
- 532 rooms
- 383 rooms
- 394 rooms
- 205 rooms
- 136 rooms
- 57 rooms
- 18 rooms
- 59+ rooms
Owner-occupied
Renter-occupied
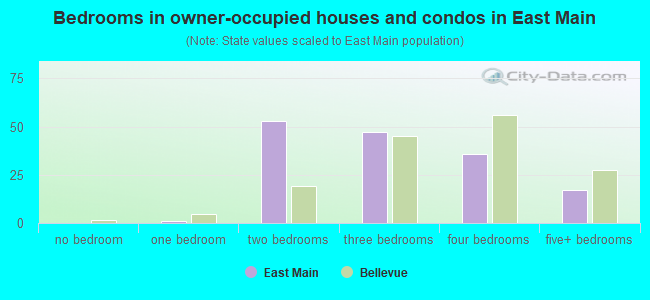
- Bedrooms in owner-occupied houses and condos in East Main
- 0no bedroom
- 11 bedroom
- 532 bedrooms
- 473 bedrooms
- 364 bedrooms
- 175+ bedrooms
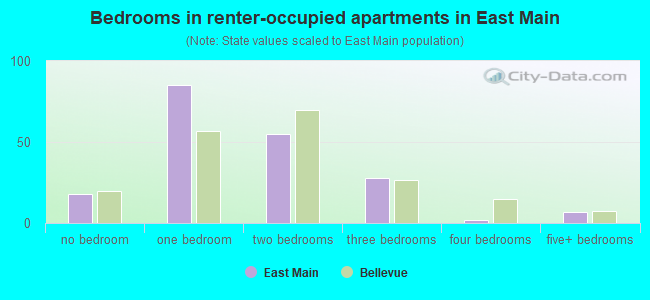
- Bedrooms in renter-occupied apartments in East Main
- 18no bedroom
- 851 bedroom
- 552 bedrooms
- 283 bedrooms
- 24 bedrooms
- 75+ bedrooms
Average number of cars or other vehicles available in houses/condos:
Average number of cars or other vehicles available in apartments:
| This neighborhood: | 1.6 |
| Bellevue: | 2.1 |
Average number of cars or other vehicles available in apartments:
| Here: | 1.3 |
| city: | 1.3 |
Percentage of units with a mortgage:
| East Main: | 64.8% |
| Bellevue: | 62.8% |
Housing prices:
- Average estimated value of detached houses in 2022 (33.6% of all units):
East Main: $1,617,969 Washington: $734,307
- Average estimated value of townhouses or other attached units in 2022 (8.2% of all units):
This neighborhood: $1,034,021 Washington: $657,697
- Average estimated '22 value of housing units in 5-or-more-unit structures (19.9% of all units):
East Main: $676,220 Washington: $503,183
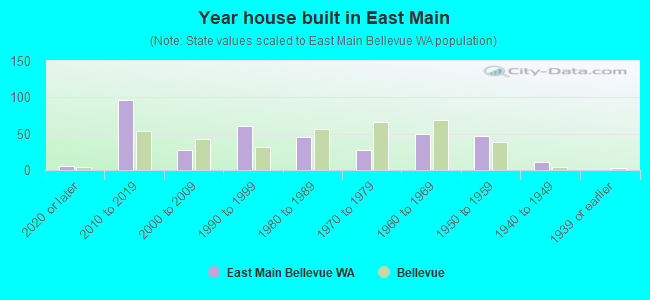
- Year house built in East Main
- 62020 or later
- 962010 to 2019
- 272000 to 2009
- 611990 to 1999
- 451980 to 1989
- 281970 to 1979
- 491960 to 1969
- 471950 to 1959
- 111940 to 1949
- 01939 or earlier
City-data.com crime index for city in 2020 (higher means more crime):
| City: | 179.9 |
| U.S. average: | 219.5 |
Travel time to work (commute)
![Travel time to work (commute)]()
- 3Less than 5 minutes
- 105 to 9 minutes
- 1210 to 14 minutes
- 2015 to 19 minutes
- 1020 to 24 minutes
- 425 to 29 minutes
- 1230 to 34 minutes
- 135 to 39 minutes
- 340 to 44 minutes
- 3145 to 59 minutes
- 460 to 89 minutes

Means of transportation to work
![Means of transportation to work]()
- 38.0%178Drove a car alone
- 13.4%63Carpooled
- 10.2%48Bus
- 2.8%13Taxi
- 2.1%10Bicycle
- 19.0%89Walked
- 26.0%122Worked at home

Time leaving home to go to work
![Time leaving home to go to work]()
- 112:00 a.m. to 4:59 a.m.
- 25:30 a.m. to 5:59 a.m.
- 16:00 a.m. to 6:29 a.m.
- 66:30 a.m. to 6:59 a.m.
- 137:00 a.m. to 7:29 a.m.
- 107:30 a.m. to 7:59 a.m.
- 208:00 a.m. to 8:29 a.m.
- 98:30 a.m. to 8:59 a.m.
- 129:00 a.m. to 9:59 a.m.
- 410:00 a.m. to 10:59 a.m.
- 212:00 p.m. to 3:59 p.m.
- 24:00 p.m. to 11:59 p.m.

Occupations of males:
- Percentage of males in management occupations (except farmers):
Here: 23.6% city: 18.0%
- Percentage of males in business and financial operations occupations:
Here: 3.8% city: 6.4%
- Percentage of males in computer and mathematical occupations:
Here: 30.1% city: 32.5%
- Percentage of males in architecture and engineering occupations:
Here: 2.8% city: 4.9%
- Percentage of males in community and social services occupations:
Here: 1.0% city: 0.6%
- Percentage of males in legal occupations:
Here: 2.7% city: 1.2%
- Percentage of males in education, training, and library occupations:
Here: 1.1% city: 2.3%
- Percentage of males in arts, design, entertainment, sports, and media occupations:
Here: 2.2% city: 1.8%
- Percentage of males in healthcare practitioners and technical occupations:
Here: 3.0% city: 3.9%
- Percentage of males in service occupations:
Here: 9.1% city: 6.2%
- Percentage of males in sales and office occupations:
Here: 7.2% city: 11.6%
- Percentage of males in construction, extraction, and maintenance occupations:
Here: 11.2% city: 2.2%
- Percentage of males in transportation occupations:
Here: 1.3% city: 1.5%
- Percentage of males in material moving occupations:
Here: 2.0% city: 2.3%
Occupations of females:
- Percentage of females in management occupations (except farmers):
Here: 17.4% city: 16.1%
- Percentage of females in business and financial operations occupations:
Here: 11.3% city: 10.5%
- Percentage of females in computer and mathematical occupations:
Here: 13.8% city: 13.9%
- Percentage of females in architecture and engineering occupations:
Here: 4.8% city: 2.1%
- Percentage of females in life, physical, and social science occupations:
Here: 2.9% city: 1.2%
- Percentage of females in community and social services occupations:
Here: 3.5% city: 1.7%
- Percentage of females in legal occupations:
Here: 2.9% city: 1.4%
- Percentage of females in education, training, and library occupations:
Here: 11.4% city: 7.5%
- Percentage of females in arts, design, entertainment, sports, and media occupations:
Here: 2.6% city: 3.2%
- Percentage of females in service occupations:
Here: 15.6% city: 12.4%
- Percentage of females in sales and office occupations:
Here: 8.3% city: 17.9%
- Percentage of females in production occupations:
Here: 2.8% city: 1.7%
- Percentage of females in material moving occupations:
Here: 1.9% city: 0.8%
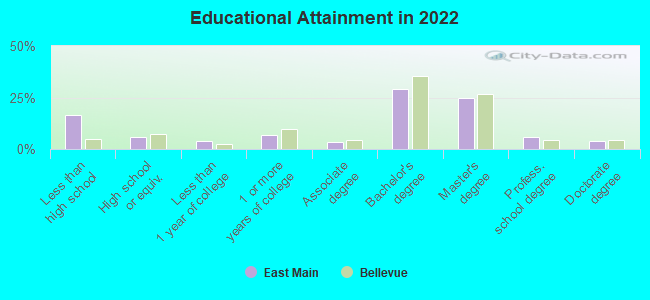
Education in this neighborhood (subdivision or community):
- Percentage of people 3 years and older in K-12 schools:
East Main: 16.0% Bellevue: 16.8%
- Percentage of people 3 years and older in undergraduate colleges:
East Main: 1.4% Bellevue: 3.2%
- Percentage of people 3 years and older in grad. or professional schools:
East Main: 2.9% Bellevue: 2.0%
- Percentage of students K-12 enrolled in private schools:
East Main: 10.6% Bellevue: 16.0%
Percentage of population below poverty level:
| East Main: | 6.2% |
| Bellevue: | 7.4% |
Median year owner moved in (as recorded in 2022):
Median year renter moved in (as recorded in 2022):
| East Main: | 2010 |
| Bellevue: | 2010 |
Median year renter moved in (as recorded in 2022):
| East Main: | 2019 |
| Bellevue: | 2021 |
Percentage of married-couple families with both working:
| East Main: | 70.2% |
| Bellevue: | 56.4% |
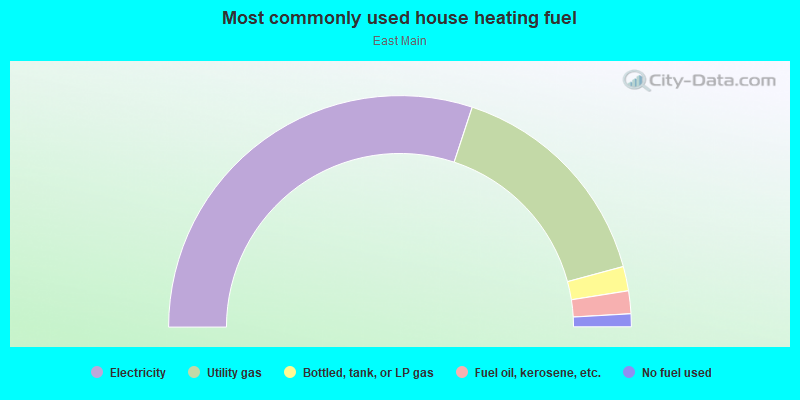
- 60.1%Electricity
- 31.5%Utility gas
- 3.4%Bottled, tank, or LP gas
- 3.2%Fuel oil, kerosene, etc.
- 1.8%No fuel used
Limited-access highways (interstate or state) in this neighborhood:
I- 405
Length: 0.39 miles
Direction: N-S
Direction: N-S
Roads and streets:
Main St
Length: 0.35 miles
Direction: E-W
Address range: 10900 to 11399
Direction: E-W
Address range: 10900 to 11399
NE 4th St
Length: 0.33 miles
Direction: E-W
Address range: 11000 to 11475
Direction: E-W
Address range: 11000 to 11475
NE 2nd St
Length: 0.30 miles
Direction: E-W
Address range: 10950 to 11199
Direction: E-W
Address range: 10950 to 11199
112th Ave NE
Length: 0.25 miles
Direction: N-S
Address range: 1 to 399
Direction: N-S
Address range: 1 to 399
110th Ave NE
Length: 0.25 miles
Direction: N-S
Address range: 1 to 299
Direction: N-S
Address range: 1 to 299
114th Ave NE
Length: 0.25 miles
Direction: N-S
Direction: N-S
NE 2nd Pl
Length: 0.12 miles
Direction: E-W
Address range: 11000 to 11335
Direction: E-W
Address range: 11000 to 11335
111th Ave NE
Length: 0.12 miles
Direction: N-S
Address range: 200 to 399
Direction: N-S
Address range: 200 to 399
NE 3rd St
Length: 0.10 miles
Direction: E-W
Address range: 11100 to 11199
Direction: E-W
Address range: 11100 to 11199
NE 3rd Pl
Length: 0.08 miles
Direction: E-W
Address range: 10800 to 11099
Direction: E-W
Address range: 10800 to 11099