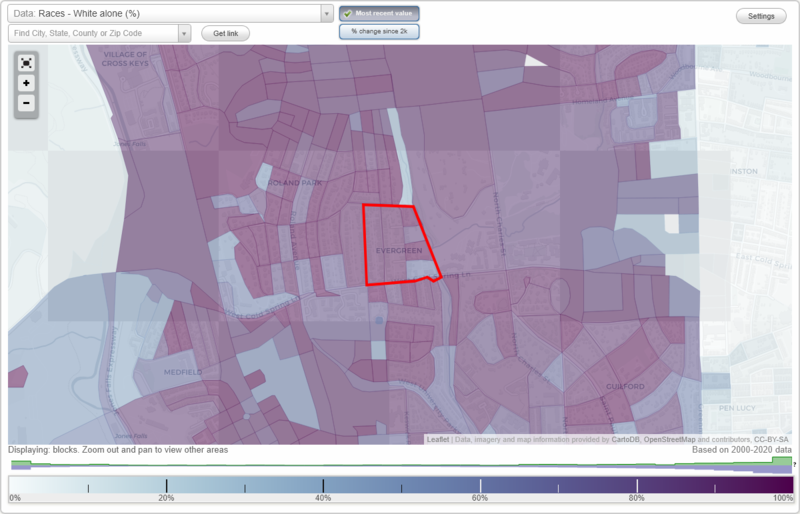
Evergreen neighborhood in Baltimore, Maryland (MD), 21210 detailed profile
Settings
X

Business Search - 14 Million verified businesses
Area: 0.056 square miles
Population: 153
Population density:
| Evergreen: | 2,711 people per square mile |
| Baltimore: | 7,053 people per square mile |

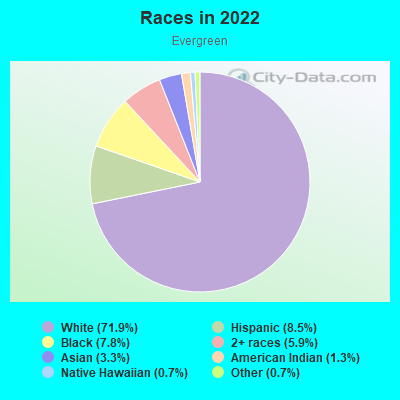
- 11071.9%White
- 138.5%Hispanic or Latino
- 127.8%Black
- 95.9%Two or more races
- 53.3%Asian
- 21.3%American Indian
- 10.7%Native Hawaiian and Other
Pacific Islander - 10.7%Some other race
Median household income in 2022:
| Evergreen: | $179,908 |
| Baltimore: | $55,198 |
Distribution of median household income
![Distribution of median household income]()
- 3Less than $10,000
- 7$10,000 to $19,999
- 2$20,000 to $29,999
- 4$30,000 to $39,999
- 10$40,000 to $49,999
- 2$50,000 to $59,999
- 7$60,000 to $74,999
- 5$75,000 to $99,999
- 4$100,000 to $124,999
- 3$125,000 to $149,999
- 8$150,000 to $199,999
- 22$200,000 or more

Distribution of owner-occupied house/condo value
![Distribution of owner-occupied house/condo value]()
- 1Less than $50,000
- 8$50,000 to $99,999
- 5$100,000 to $149,999
- 5$150,000 to $199,999
- 2$200,000 to $249,999
- 6$250,000 to $299,999
- 8$300,000 to $399,999
- 21$400,000 to $499,999
- 13$500,000 to $749,999
- 6$750,000 to $999,999
- 12$1,000,000 or more

Distribution of rent paid by renters
![Distribution of rent paid by renters]()
- 17$1,000 to $1,249
- 7$1,250 to $1,499
- 17$1,500 to $1,999
- 5$2,000 or more

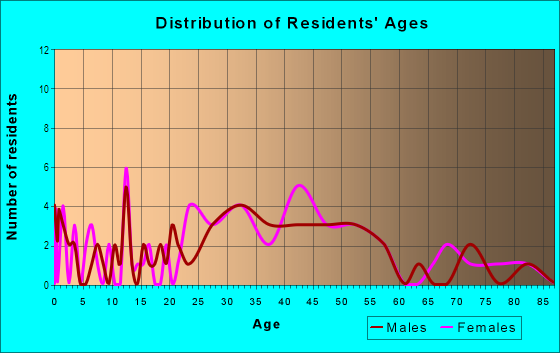
| Males: | 63 |
| Females: | 90 |
Males:
| This neighborhood: | 42.4 years |
| Whole city: | 35.0 years |
| This neighborhood: | 46.3 years |
| Whole city: | 38.2 years |
Average household size:
| Evergreen: | 2.7 people |
| Baltimore: | 2.2 people |
Percentage of family households:
| Evergreen: | 36.9% |
| Baltimore: | 34.2% |
| Here: | 59.8% |
| Baltimore: | 23.3% |
Percentage of married-couple families with children (among all households):
| Evergreen: | 33.8% |
| Baltimore: | 22.4% |
Percentage of single-mother households (among all households):
| Evergreen: | 9.2% |
| Baltimore: | 18.7% |
Percentage of never married males 15 years old and over:
Percentage of never married females 15 years old and over:
| Evergreen: | 9.9% |
| Baltimore: | 25.1% |
Percentage of never married females 15 years old and over:
| Evergreen: | 27.5% |
| city: | 27.5% |
Percentage of people that speak English not well or not at all:
| Evergreen: | 0.7% |
| Baltimore: | 2.3% |
Percentage of people born in this state:
Percentage of people born in another U.S. state:
Percentage of native residents but born outside the U.S.:
Percentage of foreign born residents:
| Here: | 38.8% |
| Baltimore: | 64.4% |
Percentage of people born in another U.S. state:
| Evergreen: | 44.5% |
| Baltimore: | 25.0% |
Percentage of native residents but born outside the U.S.:
| Here: | 3.0% |
| city: | 0.9% |
Percentage of foreign born residents:
| Here: | 13.6% |
| Baltimore: | 9.7% |
Owner-occupied
Renter-occupied

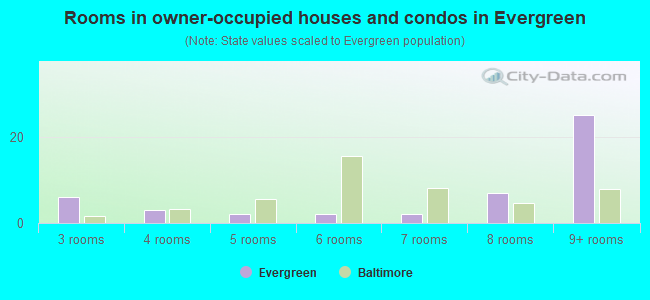
- Rooms in owner-occupied houses and condos in Evergreen
- 01 room
- 02 rooms
- 63 rooms
- 34 rooms
- 25 rooms
- 26 rooms
- 27 rooms
- 78 rooms
- 259+ rooms
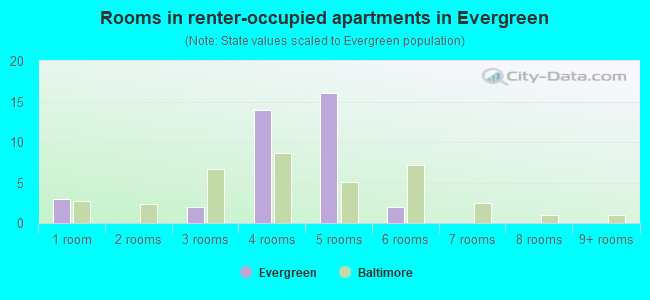
- Rooms in renter-occupied apartments in Evergreen
- 31 room
- 02 rooms
- 23 rooms
- 144 rooms
- 165 rooms
- 26 rooms
- 07 rooms
- 08 rooms
- 09+ rooms
Owner-occupied
Renter-occupied
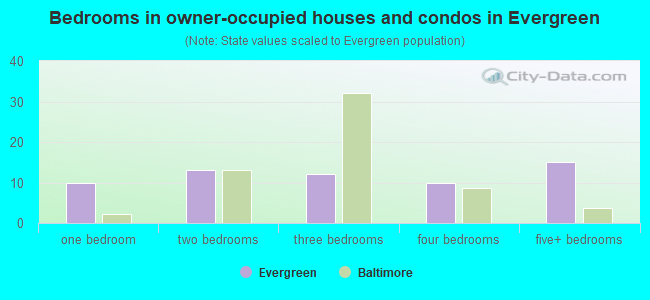
- Bedrooms in owner-occupied houses and condos in Evergreen
- 0no bedroom
- 101 bedroom
- 132 bedrooms
- 123 bedrooms
- 104 bedrooms
- 155+ bedrooms
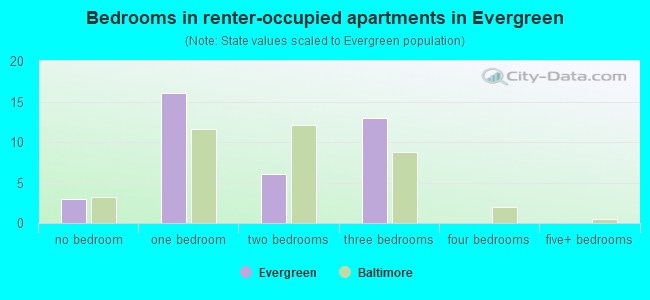
- Bedrooms in renter-occupied apartments in Evergreen
- 3no bedroom
- 161 bedroom
- 62 bedrooms
- 133 bedrooms
- 04 bedrooms
- 05+ bedrooms
Average number of cars or other vehicles available in houses/condos:
Average number of cars or other vehicles available in apartments:
| This neighborhood: | 1.8 |
| Baltimore: | 1.5 |
Average number of cars or other vehicles available in apartments:
| Here: | |
| city: |
Percentage of units with a mortgage:
| Evergreen: | 64.2% |
| Baltimore: | 64.3% |
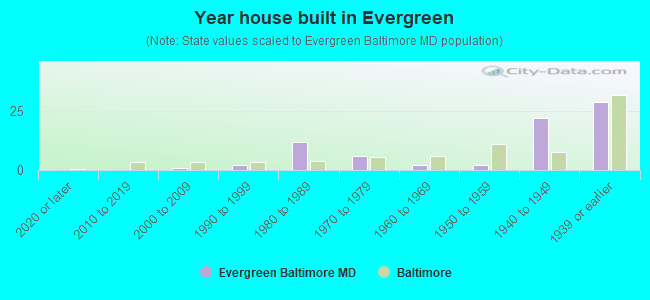
- Year house built in Evergreen
- 02020 or later
- 02010 to 2019
- 12000 to 2009
- 21990 to 1999
- 121980 to 1989
- 61970 to 1979
- 21960 to 1969
- 21950 to 1959
- 221940 to 1949
- 291939 or earlier
Travel time to work (commute)
![Travel time to work (commute)]()
- 1Less than 5 minutes
- 35 to 9 minutes
- 710 to 14 minutes
- 1815 to 19 minutes
- 1120 to 24 minutes
- 325 to 29 minutes
- 730 to 34 minutes
- 640 to 44 minutes
- 645 to 59 minutes
- 460 to 89 minutes
- 390 or more minutes

Means of transportation to work
![Means of transportation to work]()
- 52.1%30Drove a car alone
- 6.9%4Carpooled
- 6.9%4Bus
- 1.7%1Long-distance train or commuter rail
- 46.9%27Motorcycle
- 1.7%1Bicycle
- 5.2%3Walked
- 24.3%14Worked at home

Time leaving home to go to work
![Time leaving home to go to work]()
- 15:00 a.m. to 5:29 a.m.
- 25:30 a.m. to 5:59 a.m.
- 36:00 a.m. to 6:29 a.m.
- 56:30 a.m. to 6:59 a.m.
- 147:00 a.m. to 7:29 a.m.
- 57:30 a.m. to 7:59 a.m.
- 148:00 a.m. to 8:29 a.m.
- 58:30 a.m. to 8:59 a.m.
- 139:00 a.m. to 9:59 a.m.
- 410:00 a.m. to 10:59 a.m.
- 312:00 p.m. to 3:59 p.m.
- 14:00 p.m. to 11:59 p.m.

Occupations of males:
- Percentage of males in management occupations (except farmers):
Here: 8.6% city: 10.7%
- Percentage of males in business and financial operations occupations:
Here: 22.6% city: 5.9%
- Percentage of males in architecture and engineering occupations:
Here: 1.8% city: 2.9%
- Percentage of males in life, physical, and social science occupations:
Here: 12.6% city: 2.3%
- Percentage of males in legal occupations:
Here: 3.3% city: 1.8%
- Percentage of males in education, training, and library occupations:
Here: 12.4% city: 5.4%
- Percentage of males in arts, design, entertainment, sports, and media occupations:
Here: 7.2% city: 2.8%
- Percentage of males in healthcare practitioners and technical occupations:
Here: 16.2% city: 4.0%
- Percentage of males in sales and office occupations:
Here: 10.5% city: 14.2%
- Percentage of males in transportation occupations:
Here: 3.1% city: 6.8%
Occupations of females:
- Percentage of females in management occupations (except farmers):
Here: 5.2% city: 10.1%
- Percentage of females in business and financial operations occupations:
Here: 6.0% city: 6.6%
- Percentage of females in life, physical, and social science occupations:
Here: 22.2% city: 2.5%
- Percentage of females in legal occupations:
Here: 2.0% city: 1.8%
- Percentage of females in education, training, and library occupations:
Here: 18.5% city: 10.7%
- Percentage of females in arts, design, entertainment, sports, and media occupations:
Here: 6.0% city: 2.4%
- Percentage of females in healthcare practitioners and technical occupations:
Here: 20.7% city: 9.8%
- Percentage of females in service occupations:
Here: 9.6% city: 20.4%
- Percentage of females in sales and office occupations:
Here: 9.2% city: 22.3%
- Percentage of females in production occupations:
Here: 1.1% city: 2.3%
Percentage of people 16-64 in Armed Forces:
| Evergreen: | 0.4% |
| Baltimore: | 0.4% |
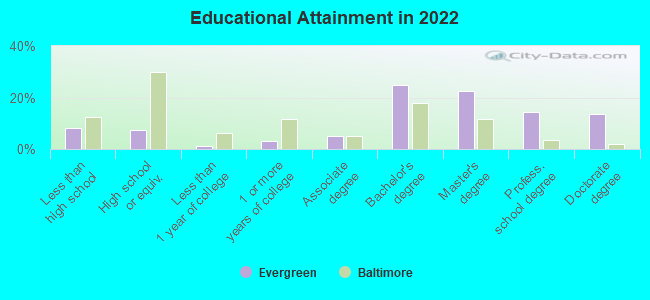
Education in this neighborhood (subdivision or community):
- Percentage of people 3 years and older in K-12 schools:
Evergreen: 16.6% Baltimore: 14.7%
- Percentage of people 3 years and older in undergraduate colleges:
Evergreen: 11.3% Baltimore: 6.0%
- Percentage of people 3 years and older in grad. or professional schools:
Evergreen: 7.3% Baltimore: 2.8%
- Percentage of students K-12 enrolled in private schools:
Evergreen: 60.0% Baltimore: 12.7%
Percentage of population below poverty level:
| Evergreen: | 5.3% |
| Baltimore: | 18.5% |
Median year owner moved in (as recorded in 2022):
| Evergreen: | 2011 |
| Baltimore: | 2009 |
Percentage of married-couple families with both working:
| Evergreen: | 85.6% |
| Baltimore: | 79.2% |
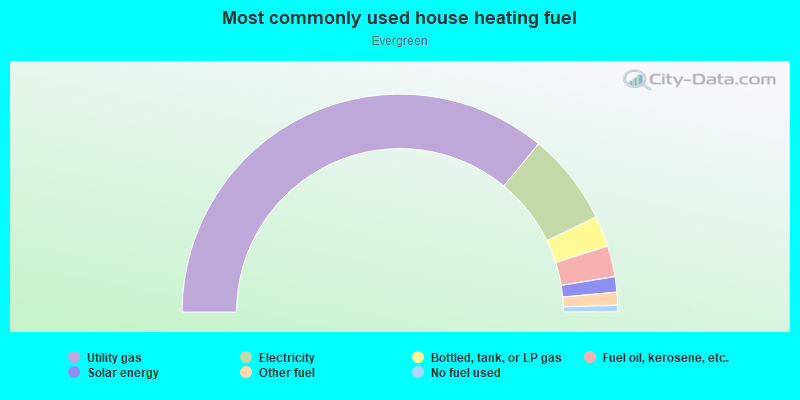
- 72.1%Utility gas
- 13.7%Electricity
- 4.6%Bottled, tank, or LP gas
- 4.6%Fuel oil, kerosene, etc.
- 2.3%Solar energy
- 1.9%Other fuel
- 1.0%No fuel used
Roads and streets:
W Cold Spring Ln
Length: 0.29 miles
Direction: E-W
Address range: 203 to 445
Direction: E-W
Address range: 203 to 445
Keswick Rd
Length: 0.20 miles
Direction: N-S
Address range: 4500 to 4600
Direction: N-S
Address range: 4500 to 4600
Wilmslow Rd
Length: 0.18 miles
Direction: N-S
Address range: 4500 to 4619
Direction: N-S
Address range: 4500 to 4619
Kendall Rd
Length: 0.13 miles
Direction: E-W
Address range: 200 to 399
Direction: E-W
Address range: 200 to 399
Alpine Rd
Length: 0.11 miles
Direction: E-W
Address range: 200 to 399
Direction: E-W
Address range: 200 to 399
Cable St
Length: 0.11 miles
Direction: E-W
Address range: 200 to 399
Direction: E-W
Address range: 200 to 399
Other features:
Stony Run
Length: 0.14 miles
Direction: SE-NW
Direction: SE-NW