Fenton (McCollam) neighborhood in San Jose, California (CA), 95127 detailed profile
Settings
X


Business Search - 14 Million verified businesses
Area: 0.137 square miles
Population: 1,065
Population density:
| Fenton (McCollam): | 7,782 people per square mile |
| San Jose: | 5,554 people per square mile |

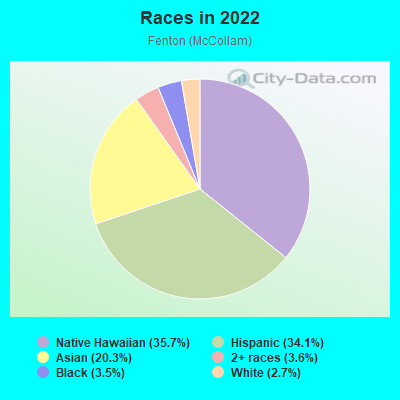
- 58935.7%Native Hawaiian and Other
Pacific Islander - 56234.1%Hispanic or Latino
- 33520.3%Asian
- 603.6%Two or more races
- 583.5%Black
- 452.7%White
- 58935.7%Native Hawaiian and Other
Median household income in 2022:
| Fenton (McCollam): | $129,316 |
| San Jose: | $133,835 |
Distribution of median household income
![Distribution of median household income]()
- 38Less than $10,000
- 74$10,000 to $19,999
- 15$20,000 to $29,999
- 23$30,000 to $39,999
- 30$40,000 to $49,999
- 27$50,000 to $59,999
- 19$60,000 to $74,999
- 27$75,000 to $99,999
- 60$100,000 to $124,999
- 27$125,000 to $149,999
- 102$150,000 to $199,999
- 46$200,000 or more

Distribution of owner-occupied house/condo value
![Distribution of owner-occupied house/condo value]()
- 2Less than $50,000
- 4$100,000 to $149,999
- 1$150,000 to $199,999
- 6$200,000 to $249,999
- 17$400,000 to $499,999
- 17$500,000 to $749,999
- 37$750,000 to $999,999
- 65$1,000,000 or more

Distribution of rent paid by renters
![Distribution of rent paid by renters]()
- 34$200 to $299
- 1$1,000 to $1,249
- 4$1,250 to $1,499
- 38$1,500 to $1,999
- 196$2,000 or more

Median rent in 2022:
| Fenton (McCollam): | $2,284 |
| San Jose: | $2,001 |
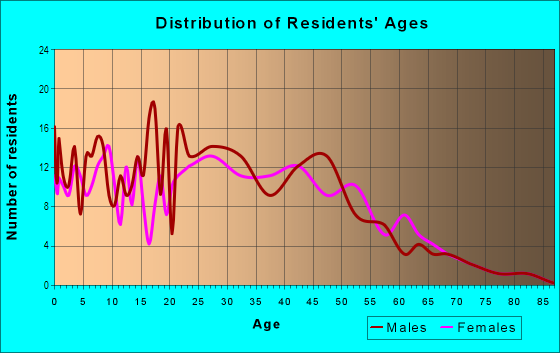
| Males: | 546 |
| Females: | 519 |
Males:
| This neighborhood: | 32.8 years |
| Whole city: | 37.6 years |
| This neighborhood: | 40.8 years |
| Whole city: | 39.1 years |
Average household size:
| Fenton (McCollam): | 3.7 people |
| San Jose: | 2.9 people |
Percentage of family households:
| Fenton (McCollam): | 50.2% |
| San Jose: | 49.9% |
| Here: | 56.3% |
| San Jose: | 53.0% |
Percentage of married-couple families with children (among all households):
| Fenton (McCollam): | 28.8% |
| San Jose: | 25.8% |
Percentage of single-mother households (among all households):
| Fenton (McCollam): | 6.2% |
| San Jose: | 5.2% |
Percentage of never married males 15 years old and over:
Percentage of never married females 15 years old and over:
| Fenton (McCollam): | 20.2% |
| San Jose: | 20.9% |
Percentage of never married females 15 years old and over:
| Fenton (McCollam): | 14.8% |
| city: | 16.7% |
Percentage of people that speak English not well or not at all:
| Fenton (McCollam): | 14.9% |
| San Jose: | 11.4% |
Percentage of people born in this state:
Percentage of people born in another U.S. state:
Percentage of native residents but born outside the U.S.:
Percentage of foreign born residents:
| Here: | 49.8% |
| San Jose: | 46.1% |
Percentage of people born in another U.S. state:
| Fenton (McCollam): | 6.0% |
| San Jose: | 10.4% |
Percentage of native residents but born outside the U.S.:
| Here: | 1.8% |
| city: | 1.7% |
Percentage of foreign born residents:
| Here: | 42.4% |
| San Jose: | 41.8% |
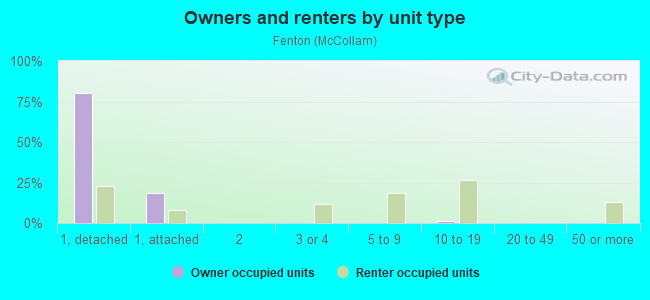
Owner-occupied
Renter-occupied

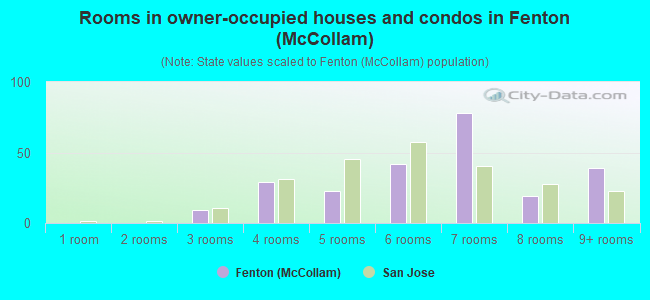
- Rooms in owner-occupied houses and condos in Fenton <
> - 01 room
- 02 rooms
- 93 rooms
- 294 rooms
- 235 rooms
- 426 rooms
- 787 rooms
- 198 rooms
- 399+ rooms
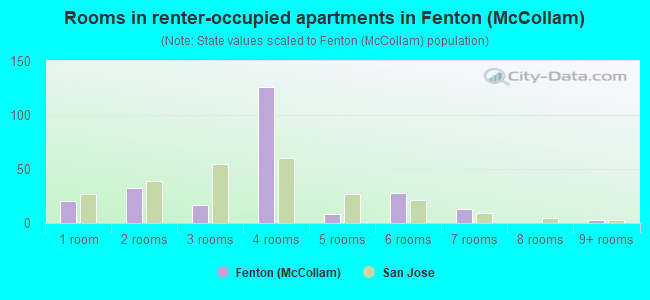
- Rooms in renter-occupied apartments in Fenton <
> - 201 room
- 322 rooms
- 173 rooms
- 1264 rooms
- 85 rooms
- 286 rooms
- 137 rooms
- 08 rooms
- 39+ rooms
Owner-occupied
Renter-occupied
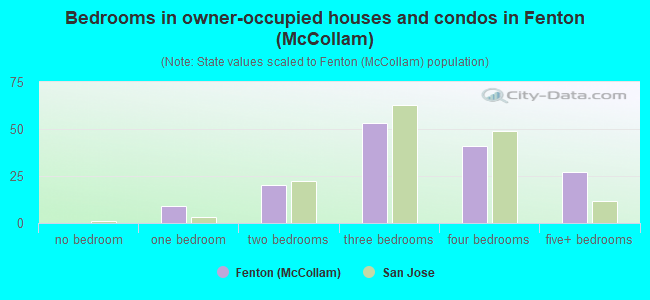
- Bedrooms in owner-occupied houses and condos in Fenton <
> - 0no bedroom
- 91 bedroom
- 202 bedrooms
- 533 bedrooms
- 414 bedrooms
- 275+ bedrooms
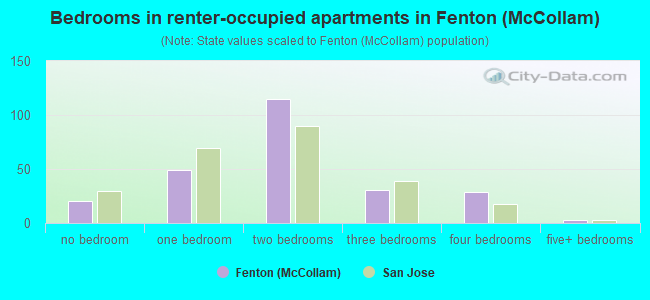
- Bedrooms in renter-occupied apartments in Fenton <
> - 20no bedroom
- 491 bedroom
- 1152 bedrooms
- 313 bedrooms
- 294 bedrooms
- 35+ bedrooms
Average number of cars or other vehicles available in houses/condos:
Average number of cars or other vehicles available in apartments:
| This neighborhood: | 2.5 |
| San Jose: | 2.3 |
Average number of cars or other vehicles available in apartments:
| Here: | 1.9 |
| city: | 1.6 |
Percentage of units with a mortgage:
| Fenton (McCollam): | 77.4% |
| San Jose: | 66.9% |
Housing prices:
- Average estimated value of detached houses in 2022 (43.7% of all units):
Fenton (McCollam): $1,022,258 San Jose: $1,532,815
- Average estimated value of townhouses or other attached units in 2022 (6.2% of all units):
This neighborhood: $481,895 city: $1,024,857
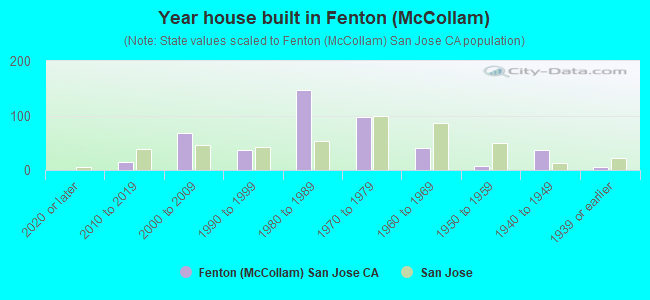
- Year house built in Fenton <
> - 02020 or later
- 152010 to 2019
- 682000 to 2009
- 371990 to 1999
- 1471980 to 1989
- 981970 to 1979
- 411960 to 1969
- 81950 to 1959
- 371940 to 1949
- 51939 or earlier
City-data.com crime index for city in 2020 (higher means more crime):
| City: | 268.4 |
| U.S. average: | 219.5 |
Travel time to work (commute)
![Travel time to work (commute)]()
- 1Less than 5 minutes
- 35 to 9 minutes
- 1910 to 14 minutes
- 5115 to 19 minutes
- 6120 to 24 minutes
- 1225 to 29 minutes
- 7130 to 34 minutes
- 235 to 39 minutes
- 1040 to 44 minutes
- 1245 to 59 minutes
- 2960 to 89 minutes
- 490 or more minutes

Means of transportation to work
![Means of transportation to work]()
- 70.6%466Drove a car alone
- 6.1%40Carpooled
- 2.9%19Bus
- 0.3%2Subway or elevated rail
- 0.9%6Light rail, streetcar or trolley
- 1.8%12Taxi
- 3.6%24Walked
- 2.4%16Other means
- 14.7%97Worked at home

Time leaving home to go to work
![Time leaving home to go to work]()
- 1512:00 a.m. to 4:59 a.m.
- 155:00 a.m. to 5:29 a.m.
- 145:30 a.m. to 5:59 a.m.
- 446:00 a.m. to 6:29 a.m.
- 306:30 a.m. to 6:59 a.m.
- 277:00 a.m. to 7:29 a.m.
- 217:30 a.m. to 7:59 a.m.
- 318:00 a.m. to 8:29 a.m.
- 68:30 a.m. to 8:59 a.m.
- 389:00 a.m. to 9:59 a.m.
- 1110:00 a.m. to 10:59 a.m.
- 311:00 a.m. to 11:59 a.m.
- 1612:00 p.m. to 3:59 p.m.
- 114:00 p.m. to 11:59 p.m.

Occupations of males:
- Percentage of males in management occupations (except farmers):
Here: 12.2% city: 13.0%
- Percentage of males in business and financial operations occupations:
Here: 4.4% city: 4.6%
- Percentage of males in computer and mathematical occupations:
Here: 11.9% city: 13.6%
- Percentage of males in architecture and engineering occupations:
Here: 6.4% city: 10.2%
- Percentage of males in education, training, and library occupations:
Here: 1.7% city: 2.8%
- Percentage of males in service occupations:
Here: 6.3% city: 12.7%
- Percentage of males in sales and office occupations:
Here: 12.6% city: 12.8%
- Percentage of males in farming, fishing, and forestry occupations:
Here: 5.2% city: 0.4%
- Percentage of males in construction, extraction, and maintenance occupations:
Here: 15.7% city: 7.8%
- Percentage of males in production occupations:
Here: 7.1% city: 5.5%
- Percentage of males in transportation occupations:
Here: 4.1% city: 3.6%
- Percentage of males in material moving occupations:
Here: 8.9% city: 3.1%
Occupations of females:
- Percentage of females in management occupations (except farmers):
Here: 4.7% city: 11.0%
- Percentage of females in business and financial operations occupations:
Here: 4.9% city: 8.6%
- Percentage of females in life, physical, and social science occupations:
Here: 3.6% city: 1.7%
- Percentage of females in education, training, and library occupations:
Here: 8.3% city: 8.1%
- Percentage of females in arts, design, entertainment, sports, and media occupations:
Here: 9.6% city: 2.0%
- Percentage of females in healthcare practitioners and technical occupations:
Here: 10.6% city: 6.8%
- Percentage of females in service occupations:
Here: 49.3% city: 21.7%
- Percentage of females in sales and office occupations:
Here: 9.1% city: 22.0%
Percentage of people 16-64 in Armed Forces:
| Fenton (McCollam): | 0.0% |
| San Jose: | 0.0% |
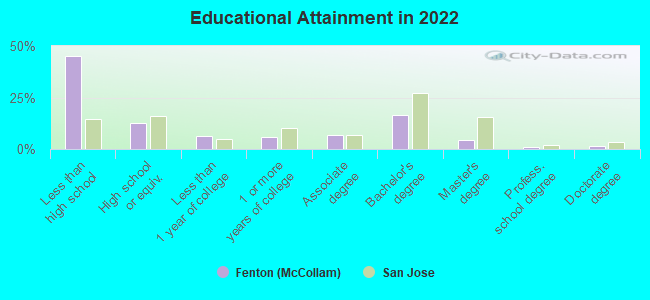
Education in this neighborhood (subdivision or community):
- Percentage of people 3 years and older in K-12 schools:
Fenton (McCollam): 51.3% San Jose: 16.1%
- Percentage of people 3 years and older in undergraduate colleges:
Fenton (McCollam): 2.6% San Jose: 6.5%
- Percentage of people 3 years and older in grad. or professional schools:
Fenton (McCollam): 1.3% San Jose: 2.0%
- Percentage of students K-12 enrolled in private schools:
Fenton (McCollam): 22.3% San Jose: 14.9%
Percentage of population below poverty level:
| Fenton (McCollam): | 4.6% |
| San Jose: | 9.0% |
Median year owner moved in (as recorded in 2022):
Median year renter moved in (as recorded in 2022):
| Fenton (McCollam): | 2003 |
| San Jose: | 2008 |
Median year renter moved in (as recorded in 2022):
| Fenton (McCollam): | 2015 |
| San Jose: | 2020 |
Percentage of married-couple families with both working:
| Fenton (McCollam): | 166.1% |
| San Jose: | 72.5% |
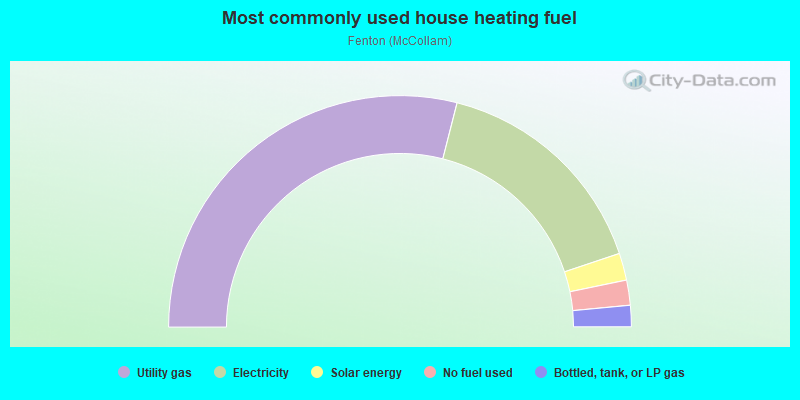
- 58.0%Utility gas
- 31.8%Electricity
- 3.8%Solar energy
- 3.5%No fuel used
- 3.0%Bottled, tank, or LP gas
Roads and streets:
Fenton St
Length: 0.37 miles
Directions: E-W, N-S, SE-NW
Address range: 300 to 688
Directions: E-W, N-S, SE-NW
Address range: 300 to 688
Novak Dr
Length: 0.28 miles
Directions: N-S, SE-NW, SW-NE
Address range: 500 to 699
Directions: N-S, SE-NW, SW-NE
Address range: 500 to 699
Youngs Cir
Length: 0.27 miles
Directions: N-S, SE-NW, SW-NE
Address range: 3400 to 3499
Directions: N-S, SE-NW, SW-NE
Address range: 3400 to 3499
Richardson Dr
Length: 0.23 miles
Direction: SW-NE
Address range: 3400 to 3499
Direction: SW-NE
Address range: 3400 to 3499
la Pala Dr
Length: 0.20 miles
Direction: SE-NW
Address range: 300 to 499
Direction: SE-NW
Address range: 300 to 499
Mc Collam Dr
Length: 0.19 miles
Directions: E-W, SE-NW, SW-NE
Address range: 500 to 599
Directions: E-W, SE-NW, SW-NE
Address range: 500 to 599
Gawain Dr
Length: 0.15 miles
Direction: SW-NE
Address range: 3328 to 3399
Direction: SW-NE
Address range: 3328 to 3399
Gridley Ct
Length: 0.14 miles
Directions: SE-NW, SW-NE
Address range: 300 to 399
Directions: SE-NW, SW-NE
Address range: 300 to 399
Mc Kee Rd
Length: 0.13 miles
Direction: SW-NE
Address range: 3700 to 3819
Direction: SW-NE
Address range: 3700 to 3819
Genine Dr
Length: 0.12 miles
Direction: SE-NW
Address range: 500 to 699
Direction: SE-NW
Address range: 500 to 699
Waterman Ct
Length: 0.10 miles
Direction: SW-NE
Address range: 3400 to 3499
Direction: SW-NE
Address range: 3400 to 3499
Lucian Ave
Length: 0.09 miles
Direction: SW-NE
Address range: 3350 to 3399
Direction: SW-NE
Address range: 3350 to 3399
Toyon Ave
Length: 0.08 miles
Direction: SE-NW
Address range: 561 to 628
Direction: SE-NW
Address range: 561 to 628
Evco Ct
Length: 0.06 miles
Directions: E-W, SW-NE
Address range: 3200 to 3299
Directions: E-W, SW-NE
Address range: 3200 to 3299
Gridley St
Length: 0.06 miles
Direction: SE-NW
Address range: 370 to 391
Direction: SE-NW
Address range: 370 to 391
Youngs Ct
Length: 0.06 miles
Direction: SE-NW
Address range: 600 to 699
Direction: SE-NW
Address range: 600 to 699
Stonemag Way
Length: 0.05 miles
Direction: SE-NW
Address range: 600 to 699
Direction: SE-NW
Address range: 600 to 699
Faith Ct
Length: 0.05 miles
Directions: E-W, SW-NE
Address range: 3200 to 3299
Directions: E-W, SW-NE
Address range: 3200 to 3299
la Pala Ct
Length: 0.05 miles
Direction: SW-NE
Address range: 3300 to 3399
Direction: SW-NE
Address range: 3300 to 3399
Perkins Ct
Length: 0.05 miles
Directions: N-S, SE-NW
Address range: 600 to 699
Directions: N-S, SE-NW
Address range: 600 to 699
Genine Ct
Length: 0.04 miles
Direction: SW-NE
Address range: 600 to 699
Direction: SW-NE
Address range: 600 to 699
la Palla Pl
Length: 0.02 miles
Direction: SW-NE
Address range: 392 to 418
Direction: SW-NE
Address range: 392 to 418