Fremont Park neighborhood in Stockton, California (CA), 95202 detailed profile
Settings
X


Business Search - 14 Million verified businesses
Area: 0.235 square miles
Population: 3,773
Population density:
| Fremont Park: | 16,076 people per square mile |
| Stockton: | 5,882 people per square mile |

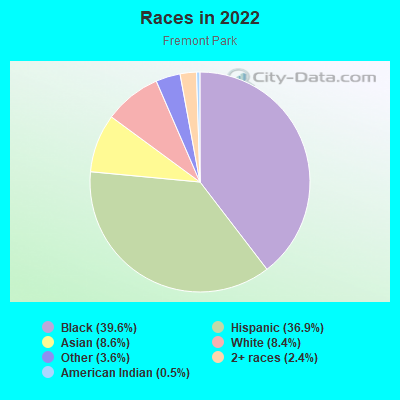
- 1,54139.6%Black
- 1,43836.9%Hispanic or Latino
- 3338.6%Asian
- 3278.4%White
- 1413.6%Some other race
- 952.4%Two or more races
- 180.5%American Indian
Distribution of median household income
![Distribution of median household income]()
- 341Less than $10,000
- 350$10,000 to $19,999
- 164$20,000 to $29,999
- 77$30,000 to $39,999
- 67$40,000 to $49,999
- 148$50,000 to $59,999
- 133$60,000 to $74,999
- 195$75,000 to $99,999
- 35$100,000 to $124,999
- 26$125,000 to $149,999
- 27$150,000 to $199,999
- 35$200,000 or more

Distribution of owner-occupied house/condo value
![Distribution of owner-occupied house/condo value]()
- 8Less than $50,000
- 8$100,000 to $149,999
- 44$150,000 to $199,999
- 22$200,000 to $249,999
- 111$250,000 to $299,999
- 33$300,000 to $399,999
- 27$400,000 to $499,999
- 60$500,000 to $749,999

Distribution of rent paid by renters
![Distribution of rent paid by renters]()
- 6Less than $100
- 15$100 to $199
- 205$200 to $299
- 171$300 to $399
- 16$400 to $499
- 94$500 to $599
- 100$600 to $699
- 81$700 to $799
- 345$800 to $899
- 308$900 to $999
- 179$1,000 to $1,249
- 185$1,250 to $1,499
- 121$1,500 to $1,999
- 27$2,000 or more

Median rent in 2022:
| Fremont Park: | $862 |
| Stockton: | $1,215 |
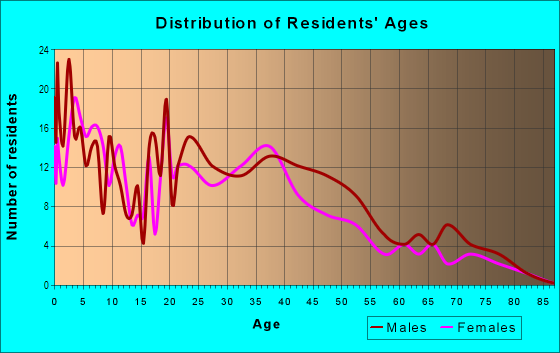
| Males: | 1,907 |
| Females: | 1,866 |
Males:
| This neighborhood: | 31.7 years |
| Whole city: | 33.4 years |
| This neighborhood: | 35.6 years |
| Whole city: | 35.2 years |
Average household size:
| Fremont Park: | 2.4 people |
| Stockton: | 3.2 people |
Percentage of family households:
| Fremont Park: | 39.0% |
| Stockton: | 51.0% |
| Here: | 14.1% |
| Stockton: | 42.0% |
Percentage of married-couple families with children (among all households):
| Fremont Park: | 24.8% |
| Stockton: | 19.2% |
Percentage of single-mother households (among all households):
| Fremont Park: | 8.2% |
| Stockton: | 9.1% |
Percentage of never married males 15 years old and over:
Percentage of never married females 15 years old and over:
| Fremont Park: | 26.0% |
| Stockton: | 21.6% |
Percentage of never married females 15 years old and over:
| Fremont Park: | 28.5% |
| city: | 19.3% |
Percentage of people that speak English not well or not at all:
| Fremont Park: | 8.2% |
| Stockton: | 12.0% |
Percentage of people born in this state:
Percentage of people born in another U.S. state:
Percentage of native residents but born outside the U.S.:
Percentage of foreign born residents:
| Here: | 76.9% |
| Stockton: | 66.1% |
Percentage of people born in another U.S. state:
| Fremont Park: | 12.9% |
| Stockton: | 7.2% |
Percentage of native residents but born outside the U.S.:
| Here: | 0.7% |
| city: | 1.5% |
Percentage of foreign born residents:
| Here: | 9.5% |
| Stockton: | 25.2% |
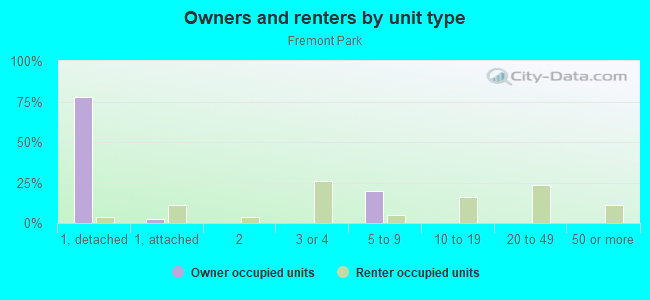
Owner-occupied
Renter-occupied

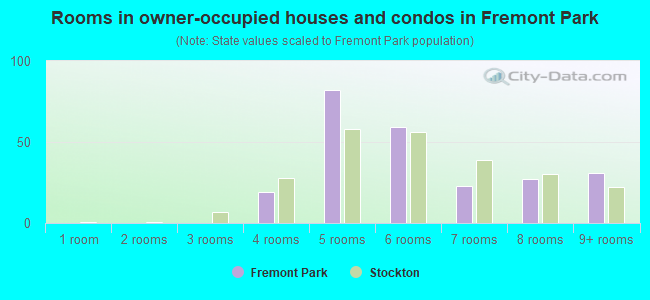
- Rooms in owner-occupied houses and condos in Fremont Park
- 01 room
- 02 rooms
- 03 rooms
- 194 rooms
- 825 rooms
- 596 rooms
- 237 rooms
- 278 rooms
- 319+ rooms
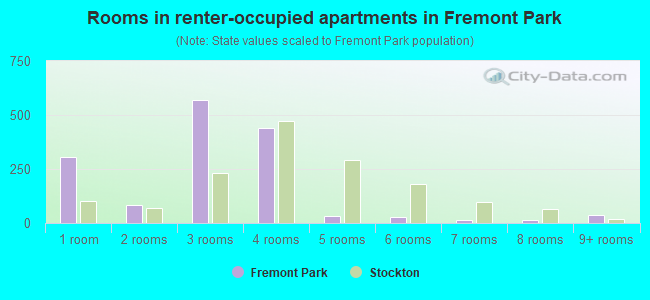
- Rooms in renter-occupied apartments in Fremont Park
- 3071 room
- 822 rooms
- 5713 rooms
- 4414 rooms
- 335 rooms
- 266 rooms
- 167 rooms
- 168 rooms
- 359+ rooms
Owner-occupied
Renter-occupied
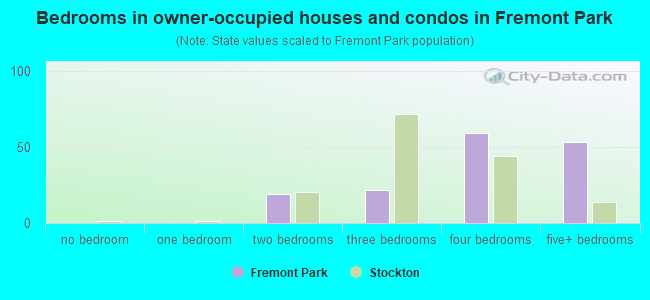
- Bedrooms in owner-occupied houses and condos in Fremont Park
- 0no bedroom
- 01 bedroom
- 192 bedrooms
- 223 bedrooms
- 594 bedrooms
- 535+ bedrooms
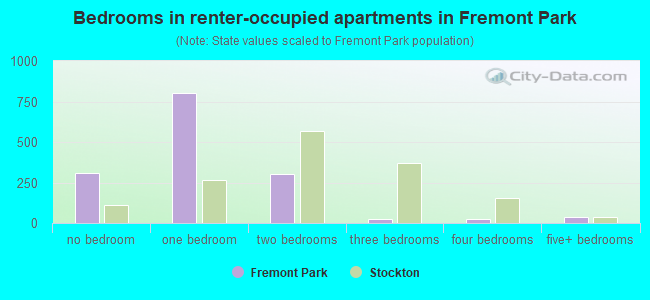
- Bedrooms in renter-occupied apartments in Fremont Park
- 307no bedroom
- 8051 bedroom
- 3042 bedrooms
- 263 bedrooms
- 244 bedrooms
- 395+ bedrooms
Average number of cars or other vehicles available in houses/condos:
Average number of cars or other vehicles available in apartments:
| This neighborhood: | 3.2 |
| Stockton: | 2.3 |
Average number of cars or other vehicles available in apartments:
| Here: | 0.7 |
| city: | 1.6 |
Percentage of units with a mortgage:
| Fremont Park: | 47.5% |
| Stockton: | 70.5% |
Average estimated value of detached houses in 2022 (7.0% of all units):
| Fremont Park: | $316,961 |
| California: | $988,808 |
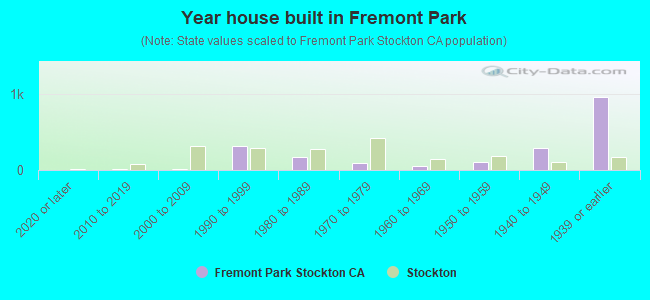
- Year house built in Fremont Park
- 02020 or later
- 142010 to 2019
- 112000 to 2009
- 3221990 to 1999
- 1691980 to 1989
- 921970 to 1979
- 571960 to 1969
- 991950 to 1959
- 2871940 to 1949
- 9571939 or earlier
City-data.com crime index for city in 2020 (higher means more crime):
| City: | 505.2 |
| U.S. average: | 219.5 |
Travel time to work (commute)
![Travel time to work (commute)]()
- 10Less than 5 minutes
- 555 to 9 minutes
- 9510 to 14 minutes
- 6215 to 19 minutes
- 9120 to 24 minutes
- 1725 to 29 minutes
- 5230 to 34 minutes
- 1435 to 39 minutes
- 1740 to 44 minutes
- 20145 to 59 minutes
- 4360 to 89 minutes
- 3590 or more minutes

Means of transportation to work
![Means of transportation to work]()
- 64.6%747Drove a car alone
- 9.3%108Carpooled
- 0.9%10Bus
- 1.0%12Subway or elevated rail
- 1.0%11Bicycle
- 1.0%11Walked
- 7.2%83Other means
- 27.2%314Worked at home

Time leaving home to go to work
![Time leaving home to go to work]()
- 1612:00 a.m. to 4:59 a.m.
- 275:00 a.m. to 5:29 a.m.
- 45:30 a.m. to 5:59 a.m.
- 766:00 a.m. to 6:29 a.m.
- 396:30 a.m. to 6:59 a.m.
- 1107:00 a.m. to 7:29 a.m.
- 507:30 a.m. to 7:59 a.m.
- 1178:00 a.m. to 8:29 a.m.
- 418:30 a.m. to 8:59 a.m.
- 109:00 a.m. to 9:59 a.m.
- 2110:00 a.m. to 10:59 a.m.
- 511:00 a.m. to 11:59 a.m.
- 2512:00 p.m. to 3:59 p.m.
- 314:00 p.m. to 11:59 p.m.

Occupations of males:
- Percentage of males in management occupations (except farmers):
Here: 14.5% city: 6.6%
- Percentage of males in business and financial operations occupations:
Here: 1.6% city: 2.1%
- Percentage of males in architecture and engineering occupations:
Here: 5.8% city: 1.6%
- Percentage of males in healthcare practitioners and technical occupations:
Here: 1.2% city: 2.7%
- Percentage of males in service occupations:
Here: 8.6% city: 16.9%
- Percentage of males in sales and office occupations:
Here: 10.3% city: 13.8%
- Percentage of males in farming, fishing, and forestry occupations:
Here: 10.4% city: 4.6%
- Percentage of males in transportation occupations:
Here: 38.0% city: 9.6%
- Percentage of males in material moving occupations:
Here: 8.9% city: 10.7%
Occupations of females:
- Percentage of females in management occupations (except farmers):
Here: 8.8% city: 5.9%
- Percentage of females in business and financial operations occupations:
Here: 18.7% city: 5.2%
- Percentage of females in community and social services occupations:
Here: 10.9% city: 2.9%
- Percentage of females in service occupations:
Here: 22.9% city: 24.4%
- Percentage of females in sales and office occupations:
Here: 19.7% city: 26.5%
- Percentage of females in farming, fishing, and forestry occupations:
Here: 10.3% city: 2.1%
- Percentage of females in production occupations:
Here: 3.0% city: 4.6%
- Percentage of females in material moving occupations:
Here: 5.5% city: 6.3%
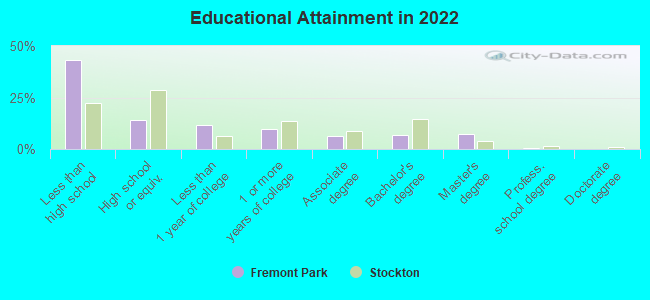
Education in this neighborhood (subdivision or community):
- Percentage of people 3 years and older in K-12 schools:
Fremont Park: 16.4% Stockton: 20.8%
- Percentage of people 3 years and older in undergraduate colleges:
Fremont Park: 1.9% Stockton: 5.2%
- Percentage of people 3 years and older in grad. or professional schools:
Fremont Park: 5.2% Stockton: 1.3%
- Percentage of students K-12 enrolled in private schools:
Fremont Park: 8.3% Stockton: 4.2%
Percentage of population below poverty level:
| Fremont Park: | 30.3% |
| Stockton: | 14.8% |
Median year renter moved in (as recorded in 2022):
| Fremont Park: | 2016 |
| Stockton: | 2018 |
Percentage of married-couple families with both working:
| Fremont Park: | 39.3% |
| Stockton: | 67.8% |
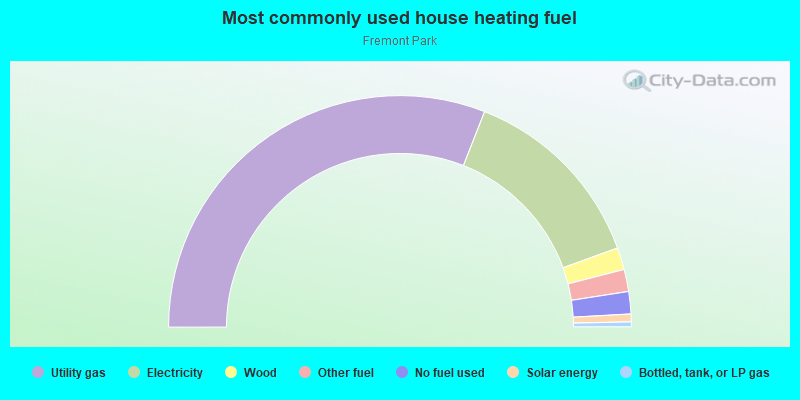
- 62.0%Utility gas
- 27.0%Electricity
- 3.1%Wood
- 3.1%Other fuel
- 3.1%No fuel used
- 1.1%Solar energy
- 0.7%Bottled, tank, or LP gas
Roads and streets:
E Fremont St
Length: 0.55 miles
Directions: E-W, SW-NE
Address range: 1 to 599
Directions: E-W, SW-NE
Address range: 1 to 599
E Lindsay St
Length: 0.55 miles
Direction: E-W
Address range: 1 to 599
Direction: E-W
Address range: 1 to 599
E Miner Ave
Length: 0.55 miles
Direction: E-W
Address range: 1 to 599
Direction: E-W
Address range: 1 to 599
E Oak St
Length: 0.55 miles
Direction: E-W
Address range: 1 to 599
Direction: E-W
Address range: 1 to 599
Flora St
Length: 0.55 miles
Direction: E-W
Address range: 1 to 599
Direction: E-W
Address range: 1 to 599
E Park St
Length: 0.55 miles
Direction: E-W
Address range: 1 to 599
Direction: E-W
Address range: 1 to 599
N el Dorado St
Length: 0.46 miles
Directions: N-S, SE-NW
Address range: 130 to 799
Directions: N-S, SE-NW
Address range: 130 to 799
N Hunter St
Length: 0.46 miles
Direction: N-S
Address range: 121 to 799
Direction: N-S
Address range: 121 to 799
Channel St
Length: 0.46 miles
Direction: E-W
Address range: 1 to 599
Direction: E-W
Address range: 1 to 599
Center St
Length: 0.43 miles
Directions: N-S, SE-NW
Address range: 200 to 799
Directions: N-S, SE-NW
Address range: 200 to 799
N San Joaquin St
Length: 0.43 miles
Direction: N-S
Address range: 200 to 799
Direction: N-S
Address range: 200 to 799
California St
Length: 0.43 miles
Direction: N-S
Address range: 200 to 799
Direction: N-S
Address range: 200 to 799
N Sutter St
Length: 0.43 miles
Direction: N-S
Address range: 200 to 799
Direction: N-S
Address range: 200 to 799
American St
Length: 0.43 miles
Direction: N-S
Address range: 200 to 799
Direction: N-S
Address range: 200 to 799
Bridge Pl
Length: 0.09 miles
Direction: E-W
Address range: 100 to 199
Direction: E-W
Address range: 100 to 199
Civic Ct
Length: 0.09 miles
Direction: E-W
Address range: 1 to 99
Direction: E-W
Address range: 1 to 99