Gililland neighborhood in Tempe, Arizona (AZ), 85281 detailed profile
Settings
X


Business Search - 14 Million verified businesses
Area: 0.251 square miles
Population: 2,008
Population density:
| Gililland: | 7,990 people per square mile |
| Tempe: | 4,641 people per square mile |

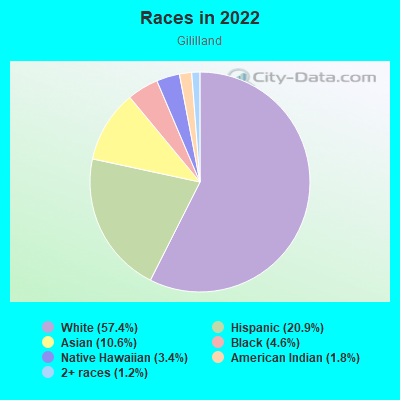
- 1,18257.4%White
- 43020.9%Hispanic or Latino
- 21910.6%Asian
- 954.6%Black
- 713.4%Native Hawaiian and Other
Pacific Islander - 381.8%American Indian
- 251.2%Two or more races
Median household income in 2022:
| Gililland: | $54,141 |
| Tempe: | $76,007 |
Distribution of median household income
![Distribution of median household income]()
- 87Less than $10,000
- 41$10,000 to $19,999
- 127$20,000 to $29,999
- 195$30,000 to $39,999
- 69$40,000 to $49,999
- 58$50,000 to $59,999
- 40$60,000 to $74,999
- 108$75,000 to $99,999
- 101$100,000 to $124,999
- 16$125,000 to $149,999
- 49$150,000 to $199,999
- 48$200,000 or more

Distribution of owner-occupied house/condo value
![Distribution of owner-occupied house/condo value]()
- 52Less than $50,000
- 17$150,000 to $199,999
- 10$200,000 to $249,999
- 18$250,000 to $299,999
- 129$300,000 to $399,999
- 68$400,000 to $499,999
- 63$500,000 to $749,999

Distribution of rent paid by renters
![Distribution of rent paid by renters]()
- 9$500 to $599
- 55$600 to $699
- 43$700 to $799
- 45$800 to $899
- 73$900 to $999
- 134$1,000 to $1,249
- 86$1,250 to $1,499
- 94$1,500 to $1,999
- 46$2,000 or more

Median rent in 2022:
| Gililland: | $1,207 |
| Tempe: | $1,566 |
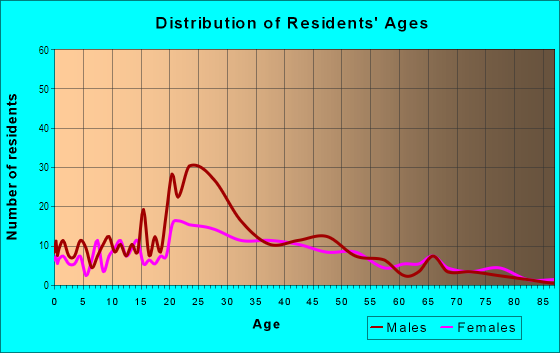
| Males: | 1,218 |
| Females: | 789 |
Males:
| This neighborhood: | 28.4 years |
| Whole city: | 28.9 years |
| This neighborhood: | 38.1 years |
| Whole city: | 30.5 years |
Average household size:
| Gililland: | 2.5 people |
| Tempe: | 2.3 people |
Percentage of family households:
| Gililland: | 41.4% |
| Tempe: | 36.3% |
| Here: | 28.9% |
| Tempe: | 32.6% |
Percentage of married-couple families with children (among all households):
| Gililland: | 8.5% |
| Tempe: | 26.9% |
Percentage of single-mother households (among all households):
| Gililland: | 30.9% |
| Tempe: | 8.3% |
Percentage of never married males 15 years old and over:
Percentage of never married females 15 years old and over:
| Gililland: | 36.1% |
| Tempe: | 32.9% |
Percentage of never married females 15 years old and over:
| Gililland: | 17.5% |
| city: | 21.7% |
Percentage of people that speak English not well or not at all:
| Gililland: | 1.1% |
| Tempe: | 2.0% |
Percentage of people born in this state:
Percentage of people born in another U.S. state:
Percentage of native residents but born outside the U.S.:
Percentage of foreign born residents:
| Here: | 44.4% |
| Tempe: | 39.3% |
Percentage of people born in another U.S. state:
| Gililland: | 43.5% |
| Tempe: | 46.0% |
Percentage of native residents but born outside the U.S.:
| Here: | 2.2% |
| city: | 1.8% |
Percentage of foreign born residents:
| Here: | 9.9% |
| Tempe: | 12.9% |
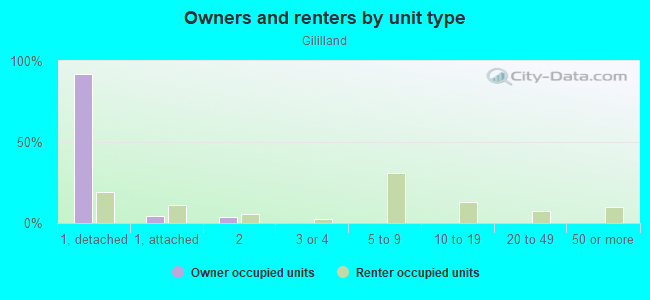
Owner-occupied
Renter-occupied

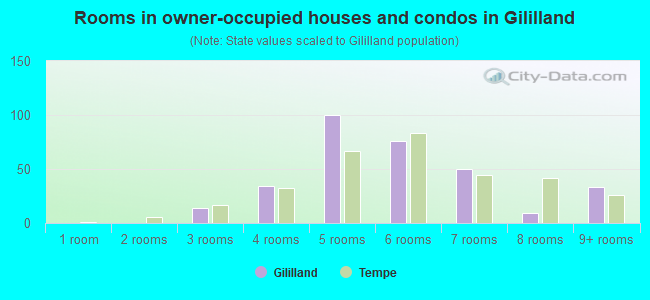
- Rooms in owner-occupied houses and condos in Gililland
- 01 room
- 02 rooms
- 143 rooms
- 344 rooms
- 1005 rooms
- 766 rooms
- 507 rooms
- 98 rooms
- 339+ rooms
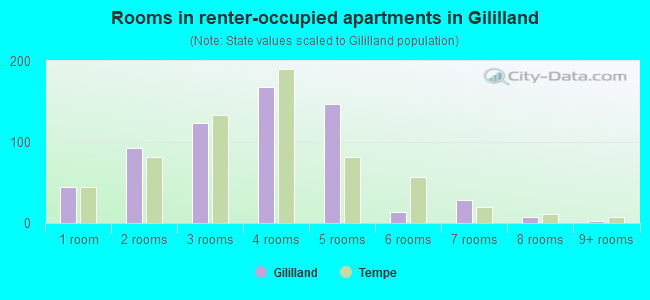
- Rooms in renter-occupied apartments in Gililland
- 441 room
- 922 rooms
- 1233 rooms
- 1684 rooms
- 1475 rooms
- 146 rooms
- 287 rooms
- 88 rooms
- 39+ rooms
Owner-occupied
Renter-occupied
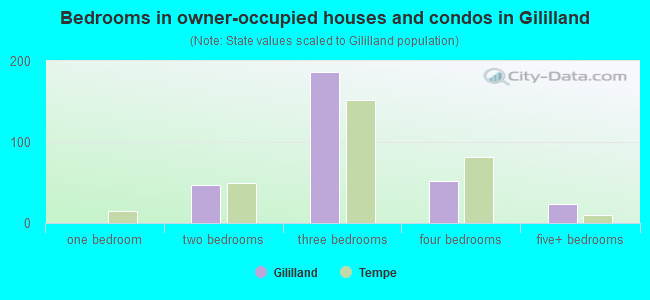
- Bedrooms in owner-occupied houses and condos in Gililland
- 0no bedroom
- 01 bedroom
- 472 bedrooms
- 1863 bedrooms
- 524 bedrooms
- 235+ bedrooms
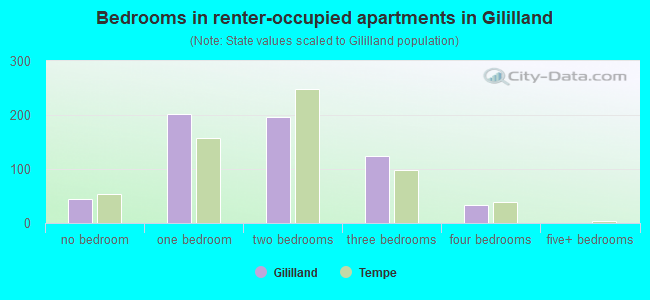
- Bedrooms in renter-occupied apartments in Gililland
- 44no bedroom
- 2011 bedroom
- 1962 bedrooms
- 1253 bedrooms
- 344 bedrooms
- 05+ bedrooms
Average number of cars or other vehicles available in houses/condos:
Average number of cars or other vehicles available in apartments:
| This neighborhood: | 2.0 |
| Tempe: | 2.0 |
Average number of cars or other vehicles available in apartments:
| Here: | 1.6 |
| city: | 1.6 |
Percentage of units with a mortgage:
| Gililland: | 87.9% |
| Tempe: | 69.2% |
Average estimated value of detached houses in 2022 (57.1% of all units):
| Gililland: | $375,612 |
| Tempe: | $535,475 |
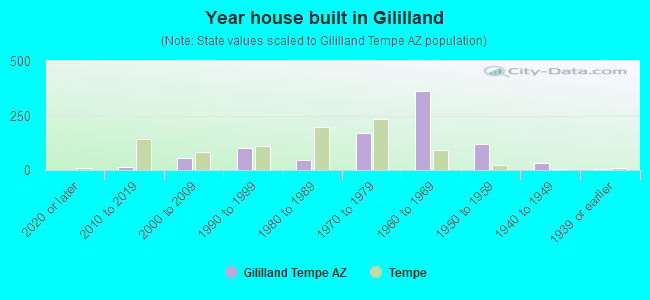
- Year house built in Gililland
- 02020 or later
- 142010 to 2019
- 552000 to 2009
- 1011990 to 1999
- 461980 to 1989
- 1711970 to 1979
- 3611960 to 1969
- 1171950 to 1959
- 311940 to 1949
- 41939 or earlier
City-data.com crime index for city in 2020 (higher means more crime):
| City: | 347.1 |
| U.S. average: | 219.5 |
Travel time to work (commute)
![Travel time to work (commute)]()
- 11Less than 5 minutes
- 1055 to 9 minutes
- 8410 to 14 minutes
- 14015 to 19 minutes
- 16420 to 24 minutes
- 9725 to 29 minutes
- 7330 to 34 minutes
- 1835 to 39 minutes
- 1040 to 44 minutes
- 4745 to 59 minutes
- 1260 to 89 minutes
- 1590 or more minutes

Means of transportation to work
![Means of transportation to work]()
- 53.0%616Drove a car alone
- 11.7%136Carpooled
- 4.2%49Bus
- 0.6%7Taxi
- 2.2%25Motorcycle
- 4.3%50Bicycle
- 8.1%94Walked
- 0.5%6Other means
- 20.7%241Worked at home

Time leaving home to go to work
![Time leaving home to go to work]()
- 3312:00 a.m. to 4:59 a.m.
- 115:00 a.m. to 5:29 a.m.
- 525:30 a.m. to 5:59 a.m.
- 516:00 a.m. to 6:29 a.m.
- 206:30 a.m. to 6:59 a.m.
- 1467:00 a.m. to 7:29 a.m.
- 787:30 a.m. to 7:59 a.m.
- 468:00 a.m. to 8:29 a.m.
- 848:30 a.m. to 8:59 a.m.
- 619:00 a.m. to 9:59 a.m.
- 2010:00 a.m. to 10:59 a.m.
- 2311:00 a.m. to 11:59 a.m.
- 6312:00 p.m. to 3:59 p.m.
- 564:00 p.m. to 11:59 p.m.

Occupations of males:
- Percentage of males in management occupations (except farmers):
Here: 5.0% city: 10.2%
- Percentage of males in business and financial operations occupations:
Here: 3.7% city: 6.5%
- Percentage of males in computer and mathematical occupations:
Here: 1.3% city: 8.4%
- Percentage of males in architecture and engineering occupations:
Here: 10.2% city: 5.0%
- Percentage of males in life, physical, and social science occupations:
Here: 3.3% city: 1.9%
- Percentage of males in education, training, and library occupations:
Here: 3.9% city: 6.1%
- Percentage of males in arts, design, entertainment, sports, and media occupations:
Here: 4.0% city: 2.8%
- Percentage of males in service occupations:
Here: 14.7% city: 14.4%
- Percentage of males in sales and office occupations:
Here: 21.2% city: 19.0%
- Percentage of males in construction, extraction, and maintenance occupations:
Here: 6.3% city: 5.1%
- Percentage of males in production occupations:
Here: 4.9% city: 4.4%
- Percentage of males in transportation occupations:
Here: 10.9% city: 3.9%
- Percentage of males in material moving occupations:
Here: 8.4% city: 3.5%
Occupations of females:
- Percentage of females in management occupations (except farmers):
Here: 1.5% city: 7.5%
- Percentage of females in business and financial operations occupations:
Here: 20.5% city: 9.3%
- Percentage of females in computer and mathematical occupations:
Here: 5.1% city: 3.3%
- Percentage of females in life, physical, and social science occupations:
Here: 2.4% city: 1.5%
- Percentage of females in community and social services occupations:
Here: 6.3% city: 3.4%
- Percentage of females in legal occupations:
Here: 2.5% city: 1.4%
- Percentage of females in education, training, and library occupations:
Here: 12.9% city: 12.0%
- Percentage of females in arts, design, entertainment, sports, and media occupations:
Here: 2.8% city: 3.1%
- Percentage of females in healthcare practitioners and technical occupations:
Here: 1.3% city: 7.4%
- Percentage of females in service occupations:
Here: 24.6% city: 18.9%
- Percentage of females in sales and office occupations:
Here: 18.9% city: 26.9%
- Percentage of females in production occupations:
Here: 1.5% city: 1.5%
- Percentage of females in material moving occupations:
Here: 1.6% city: 1.4%
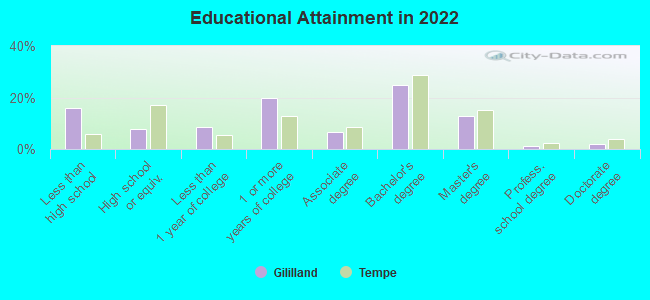
Education in this neighborhood (subdivision or community):
- Percentage of people 3 years and older in K-12 schools:
Gililland: 15.8% Tempe: 12.5%
- Percentage of people 3 years and older in undergraduate colleges:
Gililland: 13.0% Tempe: 15.4%
- Percentage of people 3 years and older in grad. or professional schools:
Gililland: 3.8% Tempe: 6.3%
- Percentage of students K-12 enrolled in private schools:
Gililland: 16.5% Tempe: 9.2%
Percentage of population below poverty level:
| Gililland: | 20.2% |
| Tempe: | 15.0% |
Median year owner moved in (as recorded in 2022):
| Gililland: | 2004 |
| Tempe: | 2013 |
Percentage of married-couple families with both working:
| Gililland: | 108.1% |
| Tempe: | 77.6% |
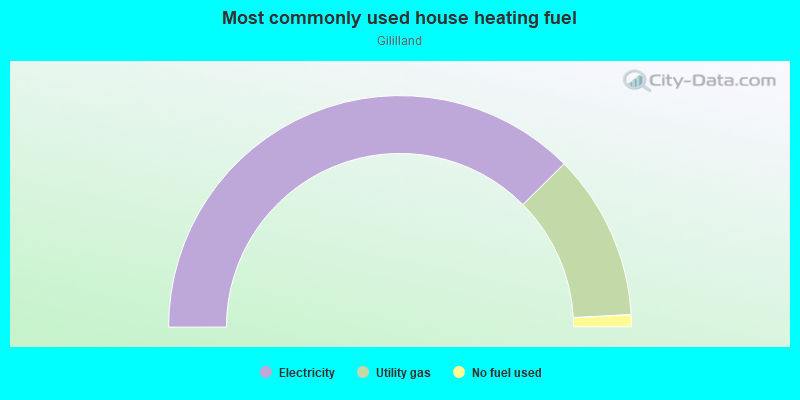
- 75.1%Electricity
- 23.2%Utility gas
- 1.7%No fuel used
Roads and streets:
W 13th St
Length: 0.55 miles
Direction: E-W
Address range: 902 to 1367
Direction: E-W
Address range: 902 to 1367
W 9th St
Length: 0.50 miles
Direction: E-W
Address range: 1000 to 1399
Direction: E-W
Address range: 1000 to 1399
S Beck Ave
Length: 0.45 miles
Direction: N-S
Address range: 900 to 1299
Direction: N-S
Address range: 900 to 1299
W Laird St
Length: 0.44 miles
Direction: E-W
Address range: 1000 to 1299
Direction: E-W
Address range: 1000 to 1299
W Elna Rae St
Length: 0.44 miles
Direction: E-W
Address range: 1000 to 1299
Direction: E-W
Address range: 1000 to 1299
W 10th St
Length: 0.44 miles
Direction: E-W
Address range: 1000 to 1299
Direction: E-W
Address range: 1000 to 1299
W 12th Pl
Length: 0.44 miles
Directions: E-W, SE-NW
Address range: 1000 to 1299
Directions: E-W, SE-NW
Address range: 1000 to 1299
S Margo Dr
Length: 0.39 miles
Directions: N-S, SE-NW
Address range: 900 to 1299
Directions: N-S, SE-NW
Address range: 900 to 1299
W 12th St
Length: 0.30 miles
Direction: E-W
Address range: 1000 to 1199
Direction: E-W
Address range: 1000 to 1199
W Howe St
Length: 0.22 miles
Directions: E-W, SE-NW, SW-NE
Address range: 1000 to 1299
Directions: E-W, SE-NW, SW-NE
Address range: 1000 to 1299
W 10th Pl
Length: 0.22 miles
Directions: E-W, SW-NE
Address range: 1000 to 1299
Directions: E-W, SW-NE
Address range: 1000 to 1299
W 11th St
Length: 0.14 miles
Direction: E-W
Address range: 1200 to 1299
Direction: E-W
Address range: 1200 to 1299
S Parkside Dr
Length: 0.10 miles
Directions: N-S, SW-NE
Address range: 1000 to 1099
Directions: N-S, SW-NE
Address range: 1000 to 1099
S Darrow Dr
Length: 0.05 miles
Directions: N-S, SE-NW
Address range: 1200 to 1299
Directions: N-S, SE-NW
Address range: 1200 to 1299
S Westfall Dr
Length: 0.05 miles
Direction: N-S
Address range: 900 to 999
Direction: N-S
Address range: 900 to 999