Gordy neighborhood in San Jose, California (CA), 95131 detailed profile
Settings
X

Business Search - 14 Million verified businesses
Area: 0.067 square miles
Population: 527
Population density:
| Gordy: | 7,854 people per square mile |
| San Jose: | 5,554 people per square mile |

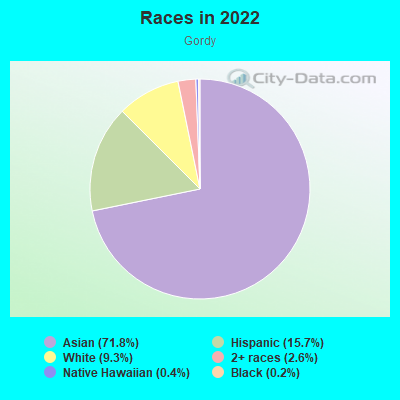
- 38071.8%Asian
- 8315.7%Hispanic or Latino
- 499.3%White
- 142.6%Two or more races
- 20.4%Native Hawaiian and Other
Pacific Islander - 10.2%Black
Median household income in 2022:
| Gordy: | $156,466 |
| San Jose: | $133,835 |
Distribution of median household income
![Distribution of median household income]()
- 2Less than $10,000
- 3$10,000 to $19,999
- 5$20,000 to $29,999
- 3$30,000 to $39,999
- 2$40,000 to $49,999
- 8$50,000 to $59,999
- 8$60,000 to $74,999
- 22$75,000 to $99,999
- 19$100,000 to $124,999
- 16$125,000 to $149,999
- 37$150,000 to $199,999
- 48$200,000 or more

Distribution of owner-occupied house/condo value
![Distribution of owner-occupied house/condo value]()
- 4$100,000 to $149,999
- 3$500,000 to $749,999
- 23$750,000 to $999,999
- 113$1,000,000 or more

Distribution of rent paid by renters
![Distribution of rent paid by renters]()
- 2$1,000 to $1,249
- 7$1,500 to $1,999
- 13$2,000 or more

Median rent in 2022:
| Gordy: | $3,039 |
| San Jose: | $2,001 |
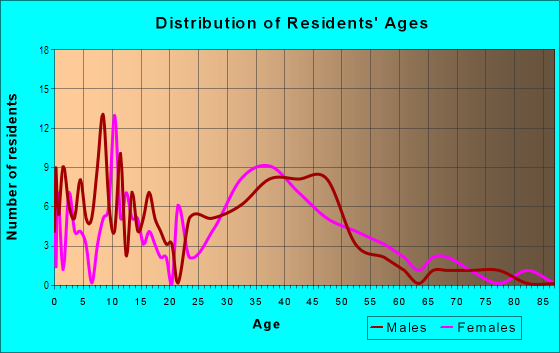
| Males: | 262 |
| Females: | 265 |
Males:
| This neighborhood: | 41.2 years |
| Whole city: | 37.6 years |
| This neighborhood: | 51.1 years |
| Whole city: | 39.1 years |
Average household size:
| Gordy: | 3.3 people |
| San Jose: | 2.9 people |
Percentage of family households:
| Gordy: | 52.0% |
| San Jose: | 49.9% |
| Here: | 63.9% |
| San Jose: | 53.0% |
Percentage of married-couple families with children (among all households):
| Gordy: | 26.1% |
| San Jose: | 25.8% |
Percentage of single-mother households (among all households):
| Gordy: | 3.9% |
| San Jose: | 5.2% |
Percentage of never married males 15 years old and over:
Percentage of never married females 15 years old and over:
| Gordy: | 20.0% |
| San Jose: | 20.9% |
Percentage of never married females 15 years old and over:
| Gordy: | 16.5% |
| city: | 16.7% |
Percentage of people that speak English not well or not at all:
| Gordy: | 15.6% |
| San Jose: | 11.4% |
Percentage of people born in this state:
Percentage of people born in another U.S. state:
Percentage of native residents but born outside the U.S.:
Percentage of foreign born residents:
| Here: | 36.4% |
| San Jose: | 46.1% |
Percentage of people born in another U.S. state:
| Gordy: | 13.6% |
| San Jose: | 10.4% |
Percentage of native residents but born outside the U.S.:
| Here: | 2.1% |
| city: | 1.7% |
Percentage of foreign born residents:
| Here: | 47.9% |
| San Jose: | 41.8% |
Owner-occupied
Renter-occupied

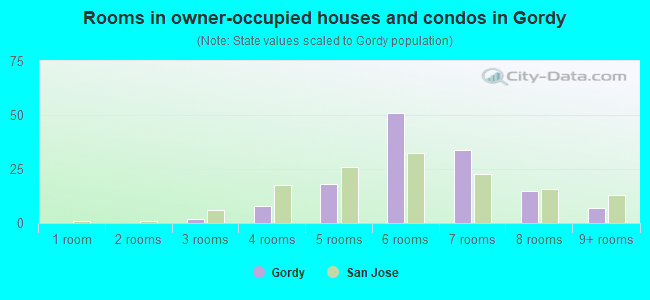
- Rooms in owner-occupied houses and condos in Gordy
- 01 room
- 02 rooms
- 23 rooms
- 84 rooms
- 185 rooms
- 516 rooms
- 347 rooms
- 158 rooms
- 79+ rooms
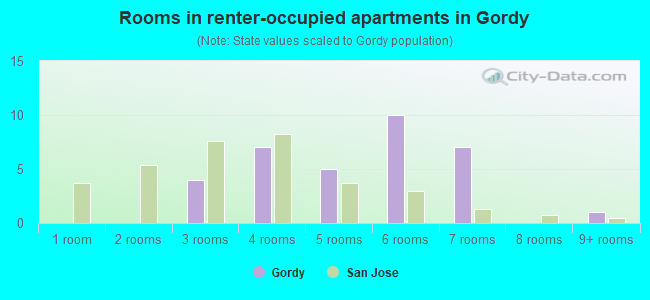
- Rooms in renter-occupied apartments in Gordy
- 01 room
- 02 rooms
- 43 rooms
- 74 rooms
- 55 rooms
- 106 rooms
- 77 rooms
- 08 rooms
- 19+ rooms
Owner-occupied
Renter-occupied
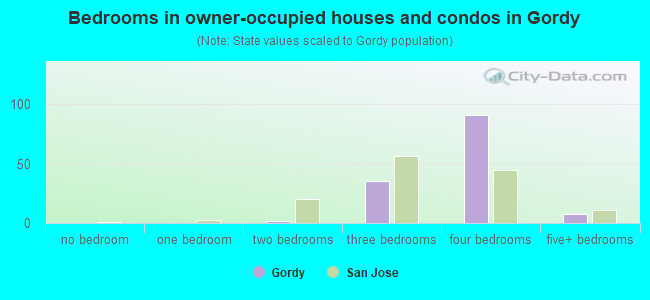
- Bedrooms in owner-occupied houses and condos in Gordy
- 0no bedroom
- 01 bedroom
- 22 bedrooms
- 353 bedrooms
- 914 bedrooms
- 85+ bedrooms
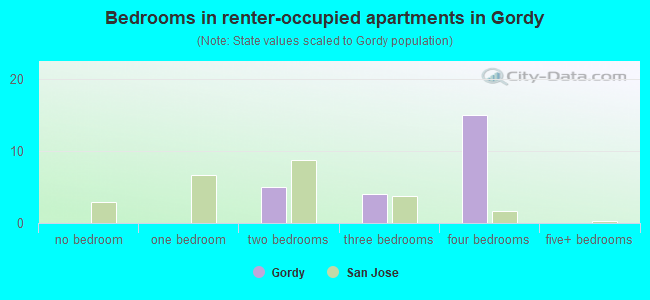
- Bedrooms in renter-occupied apartments in Gordy
- 0no bedroom
- 01 bedroom
- 52 bedrooms
- 43 bedrooms
- 154 bedrooms
- 05+ bedrooms
Average number of cars or other vehicles available in houses/condos:
Average number of cars or other vehicles available in apartments:
| This neighborhood: | 2.6 |
| San Jose: | 2.3 |
Average number of cars or other vehicles available in apartments:
| Here: | 2.9 |
| city: | 1.6 |
Percentage of units with a mortgage:
| Gordy: | 71.7% |
| San Jose: | 66.9% |
Housing prices:
- Average estimated value of detached houses in 2022 (97.8% of all units):
Gordy: $1,201,545 San Jose: $1,532,815
- Average estimated value of townhouses or other attached units in 2022 (1.7% of all units):
This neighborhood: $1,431,676 city: $1,024,857
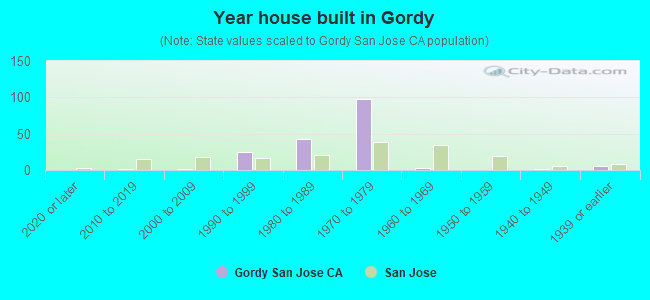
- Year house built in Gordy
- 02020 or later
- 22010 to 2019
- 22000 to 2009
- 251990 to 1999
- 421980 to 1989
- 981970 to 1979
- 31960 to 1969
- 01950 to 1959
- 21940 to 1949
- 61939 or earlier
City-data.com crime index for city in 2020 (higher means more crime):
| City: | 268.4 |
| U.S. average: | 219.5 |
Travel time to work (commute)
![Travel time to work (commute)]()
- 1Less than 5 minutes
- 65 to 9 minutes
- 2010 to 14 minutes
- 3515 to 19 minutes
- 4520 to 24 minutes
- 1625 to 29 minutes
- 8330 to 34 minutes
- 435 to 39 minutes
- 2140 to 44 minutes
- 1845 to 59 minutes
- 2260 to 89 minutes
- 1590 or more minutes

Means of transportation to work
![Means of transportation to work]()
- 72.5%207Drove a car alone
- 8.4%24Carpooled
- 1.4%4Bus
- 2.1%6Subway or elevated rail
- 1.8%5Long-distance train or commuter rail
- 1.4%4Walked
- 13.7%39Worked at home

Time leaving home to go to work
![Time leaving home to go to work]()
- 412:00 a.m. to 4:59 a.m.
- 155:00 a.m. to 5:29 a.m.
- 75:30 a.m. to 5:59 a.m.
- 246:00 a.m. to 6:29 a.m.
- 96:30 a.m. to 6:59 a.m.
- 267:00 a.m. to 7:29 a.m.
- 347:30 a.m. to 7:59 a.m.
- 368:00 a.m. to 8:29 a.m.
- 388:30 a.m. to 8:59 a.m.
- 509:00 a.m. to 9:59 a.m.
- 1410:00 a.m. to 10:59 a.m.
- 711:00 a.m. to 11:59 a.m.
- 2612:00 p.m. to 3:59 p.m.
- 104:00 p.m. to 11:59 p.m.

Occupations of males:
- Percentage of males in management occupations (except farmers):
Here: 11.7% city: 13.0%
- Percentage of males in business and financial operations occupations:
Here: 2.0% city: 4.6%
- Percentage of males in computer and mathematical occupations:
Here: 18.3% city: 13.6%
- Percentage of males in architecture and engineering occupations:
Here: 23.3% city: 10.2%
- Percentage of males in education, training, and library occupations:
Here: 4.6% city: 2.8%
- Percentage of males in arts, design, entertainment, sports, and media occupations:
Here: 3.1% city: 1.8%
- Percentage of males in service occupations:
Here: 6.8% city: 12.7%
- Percentage of males in sales and office occupations:
Here: 13.3% city: 12.8%
- Percentage of males in construction, extraction, and maintenance occupations:
Here: 2.0% city: 7.8%
- Percentage of males in production occupations:
Here: 8.5% city: 5.5%
- Percentage of males in transportation occupations:
Here: 1.4% city: 3.6%
- Percentage of males in material moving occupations:
Here: 6.2% city: 3.1%
Occupations of females:
- Percentage of females in management occupations (except farmers):
Here: 6.9% city: 11.0%
- Percentage of females in business and financial operations occupations:
Here: 1.5% city: 8.6%
- Percentage of females in computer and mathematical occupations:
Here: 4.3% city: 5.4%
- Percentage of females in architecture and engineering occupations:
Here: 10.8% city: 2.8%
- Percentage of females in community and social services occupations:
Here: 4.3% city: 1.8%
- Percentage of females in legal occupations:
Here: 5.6% city: 1.3%
- Percentage of females in education, training, and library occupations:
Here: 1.5% city: 8.1%
- Percentage of females in arts, design, entertainment, sports, and media occupations:
Here: 9.0% city: 2.0%
- Percentage of females in healthcare practitioners and technical occupations:
Here: 17.4% city: 6.8%
- Percentage of females in service occupations:
Here: 17.5% city: 21.7%
- Percentage of females in sales and office occupations:
Here: 16.0% city: 22.0%
- Percentage of females in production occupations:
Here: 5.2% city: 4.0%
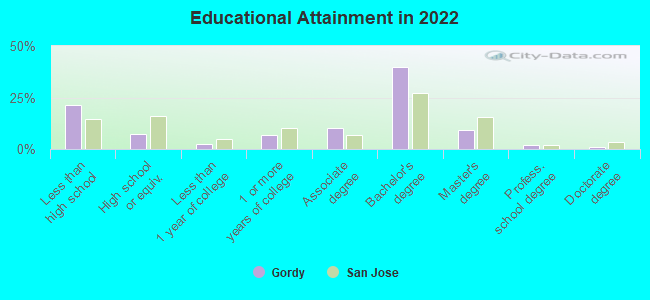
Education in this neighborhood (subdivision or community):
- Percentage of people 3 years and older in K-12 schools:
Gordy: 14.0% San Jose: 16.1%
- Percentage of people 3 years and older in undergraduate colleges:
Gordy: 5.8% San Jose: 6.5%
- Percentage of people 3 years and older in grad. or professional schools:
Gordy: 1.0% San Jose: 2.0%
- Percentage of students K-12 enrolled in private schools:
Gordy: 25.0% San Jose: 14.9%
Percentage of population below poverty level:
| Gordy: | 2.6% |
| San Jose: | 9.0% |
Median year owner moved in (as recorded in 2022):
Median year renter moved in (as recorded in 2022):
| Gordy: | 2002 |
| San Jose: | 2008 |
Median year renter moved in (as recorded in 2022):
| Gordy: | 2009 |
| San Jose: | 2020 |
Percentage of married-couple families with both working:
| Gordy: | 83.7% |
| San Jose: | 72.5% |
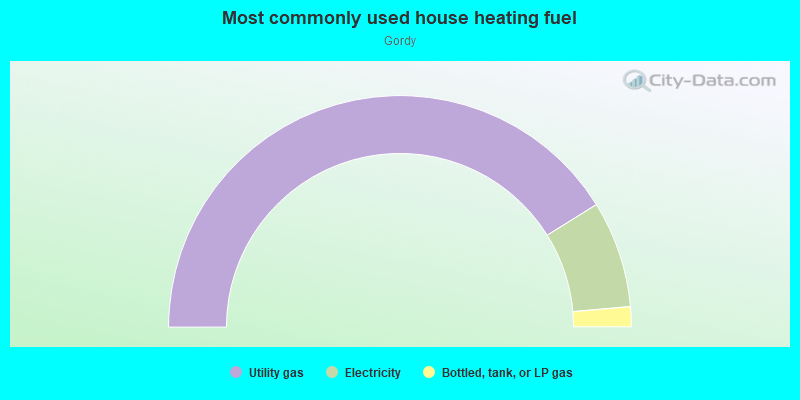
- 82.2%Utility gas
- 14.9%Electricity
- 2.8%Bottled, tank, or LP gas
Roads and streets:
Gordy Dr
Length: 0.32 miles
Directions: E-W, N-S, SE-NW, SW-NE
Address range: 1437 to 1599
Directions: E-W, N-S, SE-NW, SW-NE
Address range: 1437 to 1599
Prelude Dr
Length: 0.19 miles
Directions: E-W, N-S, SE-NW
Address range: 1300 to 1499
Directions: E-W, N-S, SE-NW
Address range: 1300 to 1499
Williamsport Dr
Length: 0.15 miles
Directions: E-W, SW-NE
Address range: 1500 to 1571
Directions: E-W, SW-NE
Address range: 1500 to 1571
Cleo Springs Dr
Length: 0.11 miles
Directions: E-W, N-S, SW-NE
Address range: 1600 to 1699
Directions: E-W, N-S, SW-NE
Address range: 1600 to 1699
New Bedford Ct
Length: 0.10 miles
Directions: E-W, N-S, SE-NW, SW-NE
Address range: 1500 to 1599
Directions: E-W, N-S, SE-NW, SW-NE
Address range: 1500 to 1599
Greensboro Ct
Length: 0.07 miles
Directions: N-S, SW-NE
Address range: 1500 to 1599
Directions: N-S, SW-NE
Address range: 1500 to 1599
Tersini Ct
Length: 0.06 miles
Directions: N-S, SW-NE
Address range: 1800 to 1899
Directions: N-S, SW-NE
Address range: 1800 to 1899
Lindsay Ann Ter
Length: 0.05 miles
Directions: N-S, SE-NW
Directions: N-S, SE-NW
Cleo Springs Ct
Length: 0.04 miles
Directions: N-S, SE-NW, SW-NE
Address range: 1600 to 1699
Directions: N-S, SE-NW, SW-NE
Address range: 1600 to 1699
Jonesboro Ct
Length: 0.04 miles
Direction: E-W
Address range: 1501 to 1599
Direction: E-W
Address range: 1501 to 1599
Asheboro Ct
Length: 0.03 miles
Direction: E-W
Address range: 1465 to 1479
Direction: E-W
Address range: 1465 to 1479
Railroad features:
Union Pacific RR
Length: 0.36 miles
Direction: N-S
Direction: N-S