Harrington neighborhood in Oakland, California (CA), 94601 detailed profile
Settings
X

Business Search - 14 Million verified businesses
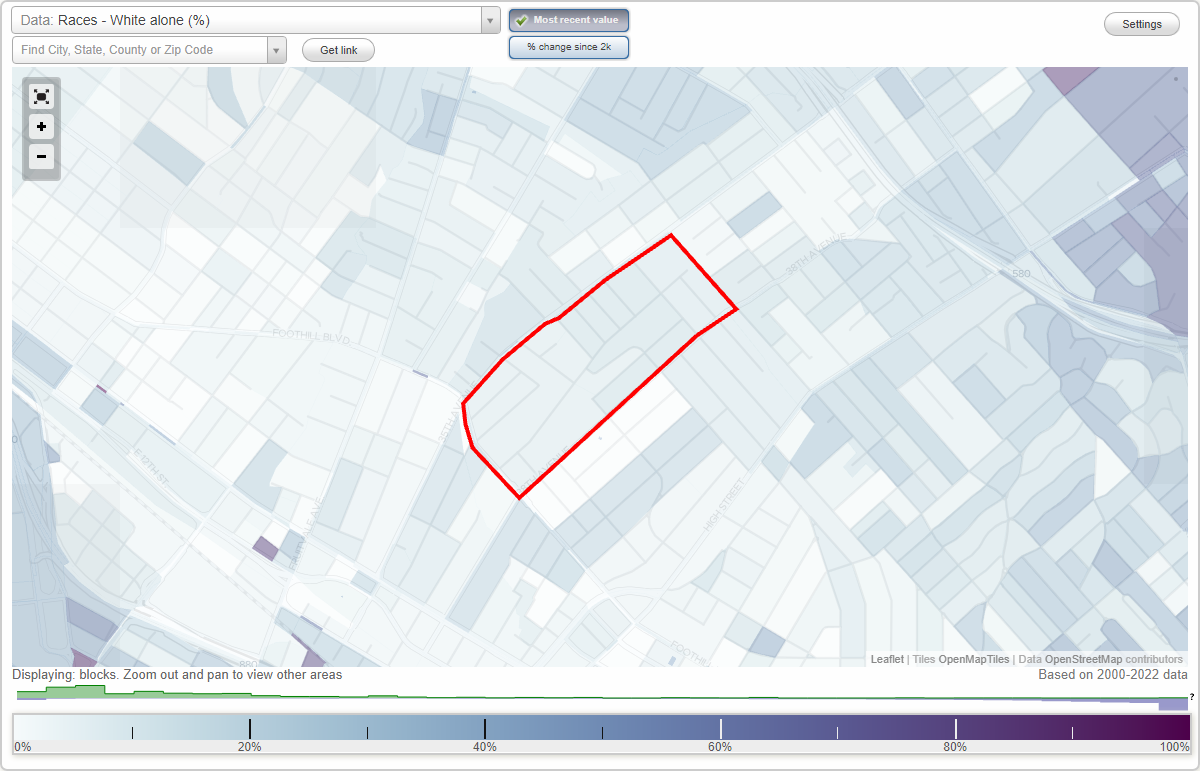
Area: 0.166 square miles
Population: 4,548
Population density:
| Harrington: | 27,366 people per square mile |
| Oakland: | 7,680 people per square mile |

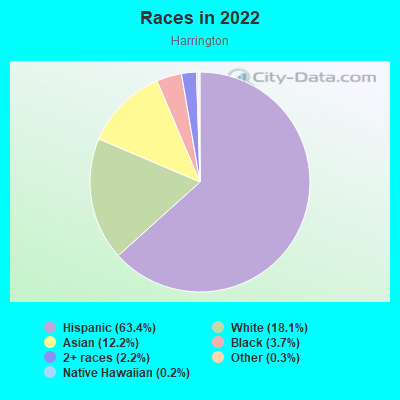
- 2,91963.4%Hispanic or Latino
- 83218.1%White
- 56312.2%Asian
- 1693.7%Black
- 992.2%Two or more races
- 140.3%Some other race
- 80.2%Native Hawaiian and Other
Pacific Islander
Median household income in 2022:
| Harrington: | $61,872 |
| Oakland: | $93,146 |
Distribution of median household income
![Distribution of median household income]()
- 160Less than $10,000
- 204$10,000 to $19,999
- 163$20,000 to $29,999
- 121$30,000 to $39,999
- 119$40,000 to $49,999
- 81$50,000 to $59,999
- 259$60,000 to $74,999
- 137$75,000 to $99,999
- 95$100,000 to $124,999
- 150$125,000 to $149,999
- 88$150,000 to $199,999
- 39$200,000 or more

Distribution of owner-occupied house/condo value
![Distribution of owner-occupied house/condo value]()
- 68Less than $50,000
- 12$50,000 to $99,999
- 11$250,000 to $299,999
- 31$300,000 to $399,999
- 105$400,000 to $499,999
- 125$500,000 to $749,999
- 162$750,000 to $999,999
- 1$1,000,000 or more

Distribution of rent paid by renters
![Distribution of rent paid by renters]()
- 64$100 to $199
- 17$300 to $399
- 34$500 to $599
- 26$600 to $699
- 9$700 to $799
- 73$900 to $999
- 201$1,000 to $1,249
- 295$1,250 to $1,499
- 217$1,500 to $1,999
- 235$2,000 or more

Median rent in 2022:
| Harrington: | $1,517 |
| Oakland: | $1,741 |
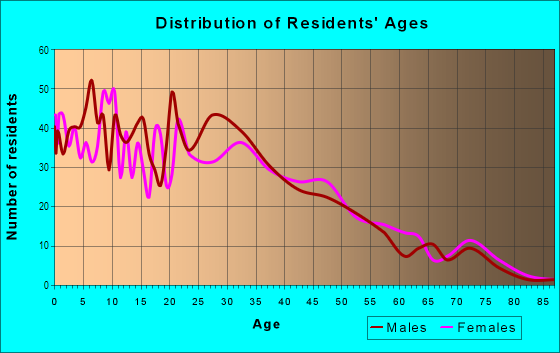
| Males: | 2,240 |
| Females: | 2,307 |
Males:
| This neighborhood: | 32.1 years |
| Whole city: | 38.3 years |
| This neighborhood: | 33.9 years |
| Whole city: | 39.1 years |
Average household size:
| Harrington: | 17.6 people |
| Oakland: | 2.4 people |
Percentage of family households:
| Harrington: | 57.4% |
| Oakland: | 37.1% |
| Here: | 45.7% |
| Oakland: | 34.9% |
Percentage of married-couple families with children (among all households):
| Harrington: | 20.6% |
| Oakland: | 28.3% |
Percentage of single-mother households (among all households):
| Harrington: | 6.4% |
| Oakland: | 9.9% |
Percentage of never married males 15 years old and over:
Percentage of never married females 15 years old and over:
| Harrington: | 24.4% |
| Oakland: | 24.6% |
Percentage of never married females 15 years old and over:
| Harrington: | 18.1% |
| city: | 21.9% |
Percentage of people that speak English not well or not at all:
| Harrington: | 16.4% |
| Oakland: | 10.6% |
Percentage of people born in this state:
Percentage of people born in another U.S. state:
Percentage of native residents but born outside the U.S.:
Percentage of foreign born residents:
| Here: | 43.4% |
| Oakland: | 49.9% |
Percentage of people born in another U.S. state:
| Harrington: | 4.9% |
| Oakland: | 22.3% |
Percentage of native residents but born outside the U.S.:
| Here: | 2.0% |
| city: | 1.6% |
Percentage of foreign born residents:
| Here: | 49.7% |
| Oakland: | 26.2% |
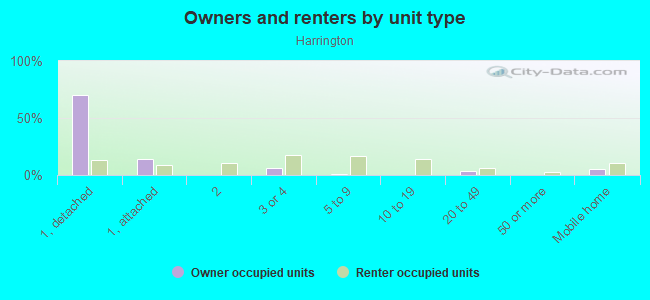
Owner-occupied
Renter-occupied

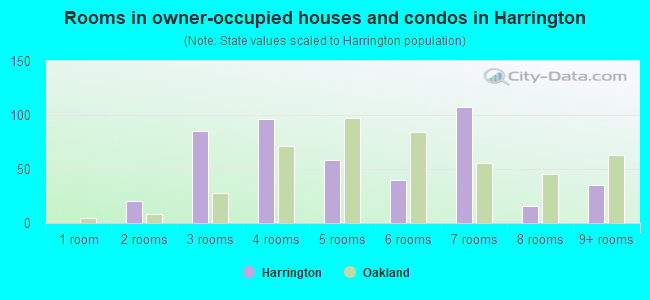
- Rooms in owner-occupied houses and condos in Harrington
- 01 room
- 202 rooms
- 853 rooms
- 964 rooms
- 585 rooms
- 406 rooms
- 1077 rooms
- 168 rooms
- 359+ rooms
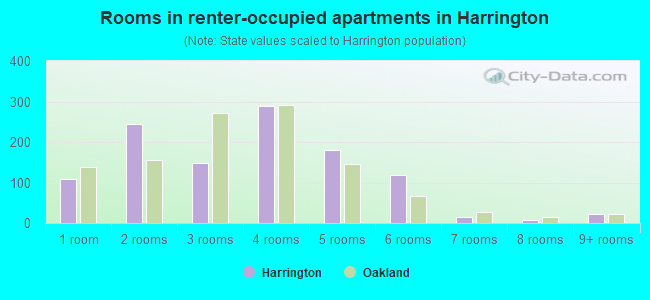
- Rooms in renter-occupied apartments in Harrington
- 1081 room
- 2442 rooms
- 1473 rooms
- 2904 rooms
- 1815 rooms
- 1186 rooms
- 167 rooms
- 78 rooms
- 229+ rooms
Owner-occupied
Renter-occupied
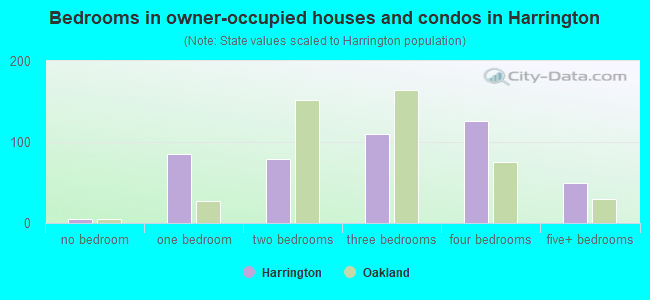
- Bedrooms in owner-occupied houses and condos in Harrington
- 5no bedroom
- 851 bedroom
- 792 bedrooms
- 1103 bedrooms
- 1264 bedrooms
- 495+ bedrooms
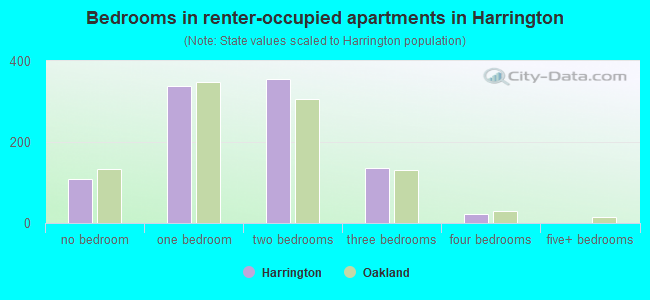
- Bedrooms in renter-occupied apartments in Harrington
- 108no bedroom
- 3391 bedroom
- 3562 bedrooms
- 1363 bedrooms
- 224 bedrooms
- 05+ bedrooms
Average number of cars or other vehicles available in houses/condos:
Average number of cars or other vehicles available in apartments:
| This neighborhood: | 2.6 |
| Oakland: | 1.8 |
Average number of cars or other vehicles available in apartments:
| Here: | 1.2 |
| city: | 1.1 |
Percentage of units with a mortgage:
| Harrington: | 59.1% |
| Oakland: | 71.2% |
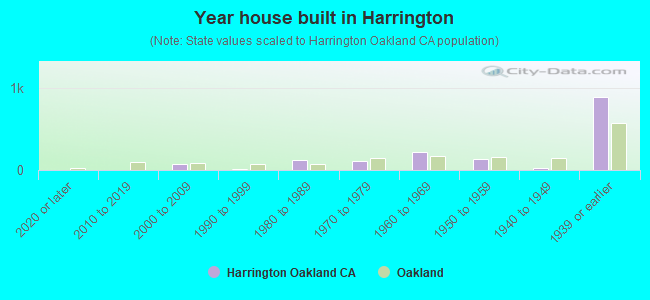
- Year house built in Harrington
- 02020 or later
- 02010 to 2019
- 682000 to 2009
- 71990 to 1999
- 1181980 to 1989
- 1111970 to 1979
- 2141960 to 1969
- 1401950 to 1959
- 271940 to 1949
- 8861939 or earlier
City-data.com crime index for city in 2020 (higher means more crime):
| City: | 691.6 |
| U.S. average: | 219.5 |
Travel time to work (commute)
![Travel time to work (commute)]()
- 18Less than 5 minutes
- 175 to 9 minutes
- 33410 to 14 minutes
- 20915 to 19 minutes
- 34420 to 24 minutes
- 11125 to 29 minutes
- 31330 to 34 minutes
- 7735 to 39 minutes
- 9440 to 44 minutes
- 17145 to 59 minutes
- 23960 to 89 minutes
- 5690 or more minutes

Means of transportation to work
![Means of transportation to work]()
- 47.4%1,049Drove a car alone
- 13.8%306Carpooled
- 4.2%93Bus
- 14.6%323Subway or elevated rail
- 3.1%68Long-distance train or commuter rail
- 5.3%118Ferryboat
- 3.7%82Bicycle
- 6.0%133Walked
- 1.9%41Other means
- 8.2%181Worked at home

Time leaving home to go to work
![Time leaving home to go to work]()
- 7712:00 a.m. to 4:59 a.m.
- 1095:00 a.m. to 5:29 a.m.
- 595:30 a.m. to 5:59 a.m.
- 2036:00 a.m. to 6:29 a.m.
- 156:30 a.m. to 6:59 a.m.
- 2207:00 a.m. to 7:29 a.m.
- 2077:30 a.m. to 7:59 a.m.
- 3558:00 a.m. to 8:29 a.m.
- 908:30 a.m. to 8:59 a.m.
- 2139:00 a.m. to 9:59 a.m.
- 9310:00 a.m. to 10:59 a.m.
- 6511:00 a.m. to 11:59 a.m.
- 14912:00 p.m. to 3:59 p.m.
- 1184:00 p.m. to 11:59 p.m.

Occupations of males:
- Percentage of males in management occupations (except farmers):
Here: 12.1% city: 13.5%
- Percentage of males in business and financial operations occupations:
Here: 1.6% city: 6.0%
- Percentage of males in computer and mathematical occupations:
Here: 1.2% city: 7.3%
- Percentage of males in architecture and engineering occupations:
Here: 2.2% city: 3.8%
- Percentage of males in life, physical, and social science occupations:
Here: 1.7% city: 2.0%
- Percentage of males in community and social services occupations:
Here: 2.6% city: 1.5%
- Percentage of males in arts, design, entertainment, sports, and media occupations:
Here: 2.9% city: 4.7%
- Percentage of males in service occupations:
Here: 14.0% city: 12.9%
- Percentage of males in sales and office occupations:
Here: 21.2% city: 13.4%
- Percentage of males in construction, extraction, and maintenance occupations:
Here: 23.3% city: 8.3%
- Percentage of males in production occupations:
Here: 2.8% city: 4.2%
- Percentage of males in transportation occupations:
Here: 4.1% city: 5.6%
- Percentage of males in material moving occupations:
Here: 9.3% city: 4.5%
Occupations of females:
- Percentage of females in management occupations (except farmers):
Here: 23.8% city: 15.1%
- Percentage of females in business and financial operations occupations:
Here: 1.0% city: 8.2%
- Percentage of females in computer and mathematical occupations:
Here: 1.4% city: 3.0%
- Percentage of females in community and social services occupations:
Here: 5.7% city: 3.7%
- Percentage of females in legal occupations:
Here: 1.4% city: 2.5%
- Percentage of females in education, training, and library occupations:
Here: 5.3% city: 8.4%
- Percentage of females in arts, design, entertainment, sports, and media occupations:
Here: 1.4% city: 4.8%
- Percentage of females in healthcare practitioners and technical occupations:
Here: 4.3% city: 6.7%
- Percentage of females in service occupations:
Here: 26.1% city: 17.8%
- Percentage of females in sales and office occupations:
Here: 13.4% city: 20.0%
- Percentage of females in construction, extraction, and maintenance occupations:
Here: 3.9% city: 0.3%
- Percentage of females in production occupations:
Here: 8.5% city: 2.4%
- Percentage of females in material moving occupations:
Here: 3.8% city: 1.7%
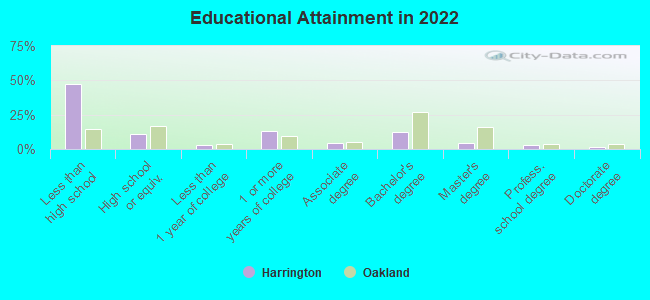
Education in this neighborhood (subdivision or community):
- Percentage of people 3 years and older in K-12 schools:
Harrington: 21.8% Oakland: 13.0%
- Percentage of people 3 years and older in undergraduate colleges:
Harrington: 5.0% Oakland: 4.3%
- Percentage of people 3 years and older in grad. or professional schools:
Harrington: 0.7% Oakland: 1.8%
- Percentage of students K-12 enrolled in private schools:
Harrington: 13.8% Oakland: 15.8%
Percentage of population below poverty level:
| Harrington: | 23.0% |
| Oakland: | 13.9% |
Median year owner moved in (as recorded in 2022):
Median year renter moved in (as recorded in 2022):
| Harrington: | 1993 |
| Oakland: | 2010 |
Median year renter moved in (as recorded in 2022):
| Harrington: | 2013 |
| Oakland: | 2018 |
Percentage of married-couple families with both working:
| Harrington: | 55.6% |
| Oakland: | 73.2% |
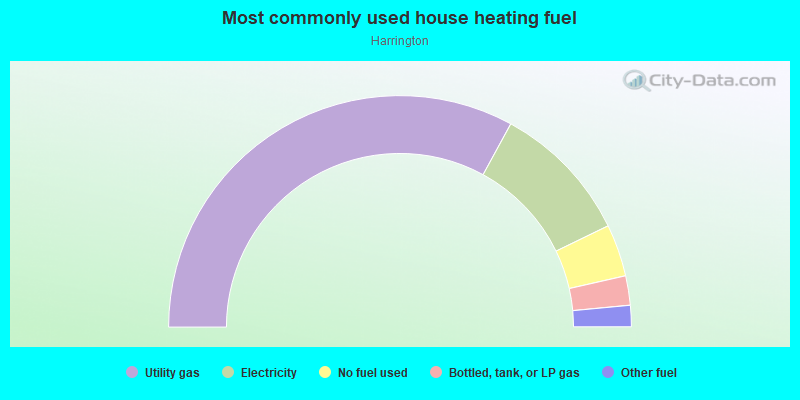
- 65.9%Utility gas
- 19.7%Electricity
- 7.3%No fuel used
- 4.1%Bottled, tank, or LP gas
- 3.0%Other fuel
Roads and streets:
38th
Length: 0.78 miles
Directions: E-W, N-S, SW-NE
Directions: E-W, N-S, SW-NE
Harrington Ave
Length: 0.73 miles
Direction: SW-NE
Address range: 1900 to 2599
Direction: SW-NE
Address range: 1900 to 2599
38th Ave
Length: 0.64 miles
Directions: E-W, SW-NE
Address range: 1896 to 2599
Directions: E-W, SW-NE
Address range: 1896 to 2599
Ransom Ave
Length: 0.33 miles
Direction: SW-NE
Address range: 2100 to 2499
Direction: SW-NE
Address range: 2100 to 2499
Santa Rita St
Length: 0.26 miles
Directions: E-W, SE-NW, SW-NE
Address range: 2100 to 3799
Directions: E-W, SE-NW, SW-NE
Address range: 2100 to 3799
Foothill Blvd
Length: 0.24 miles
Directions: N-S, SE-NW
Address range: 3527 to 3799
Directions: N-S, SE-NW
Address range: 3527 to 3799
Foothill
Length: 0.24 miles
Directions: N-S, SE-NW
Directions: N-S, SE-NW
36th Ave
Length: 0.23 miles
Directions: E-W, N-S, SW-NE
Address range: 1884 to 2099
Directions: E-W, N-S, SW-NE
Address range: 1884 to 2099
Crosby Ave
Length: 0.19 miles
Direction: SW-NE
Address range: 1900 to 2099
Direction: SW-NE
Address range: 1900 to 2099
Nevil St
Length: 0.15 miles
Direction: SE-NW
Address range: 3600 to 3799
Direction: SE-NW
Address range: 3600 to 3799
Lyon Ave
Length: 0.15 miles
Direction: SE-NW
Address range: 3600 to 3793
Direction: SE-NW
Address range: 3600 to 3793
Galindo St
Length: 0.12 miles
Direction: SE-NW
Address range: 3537 to 3599
Direction: SE-NW
Address range: 3537 to 3599
Brookdale Ave
Length: 0.11 miles
Direction: SE-NW
Address range: 3700 to 3799
Direction: SE-NW
Address range: 3700 to 3799
Gray St
Length: 0.10 miles
Direction: SE-NW
Address range: 3522 to 3599
Direction: SE-NW
Address range: 3522 to 3599
San Juan St
Length: 0.09 miles
Direction: SE-NW
Address range: 3700 to 3799
Direction: SE-NW
Address range: 3700 to 3799
Carrington Way
Length: 0.07 miles
Direction: SE-NW
Address range: 3600 to 3699
Direction: SE-NW
Address range: 3600 to 3699
Carrington St
Length: 0.07 miles
Direction: SE-NW
Address range: 3600 to 3799
Direction: SE-NW
Address range: 3600 to 3799
Baxter St
Length: 0.06 miles
Direction: SW-NE
Address range: 2100 to 2199
Direction: SW-NE
Address range: 2100 to 2199
Harper St
Length: 0.06 miles
Directions: N-S, SE-NW
Address range: 3541 to 3599
Directions: N-S, SE-NW
Address range: 3541 to 3599
Bridge Ave
Length: 0.00 miles
Direction: SW-NE
Address range: 1896 to 1899
Direction: SW-NE
Address range: 1896 to 1899