Hillside Park neighborhood in Durham, North Carolina (NC), 27707 detailed profile
Settings
X


Business Search - 14 Million verified businesses
Area: 0.173 square miles
Population: 437
Population density:
| Hillside Park: | 2,529 people per square mile |
| Durham: | 3,084 people per square mile |

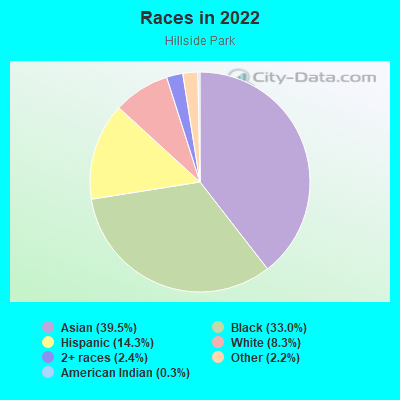
- 28539.5%Asian
- 23833.0%Black
- 10314.3%Hispanic or Latino
- 608.3%White
- 172.4%Two or more races
- 162.2%Some other race
- 20.3%American Indian
Median household income in 2022:
| Hillside Park: | $70,011 |
| Durham: | $78,105 |
Distribution of median household income
![Distribution of median household income]()
- 5Less than $10,000
- 24$10,000 to $19,999
- 26$20,000 to $29,999
- 20$30,000 to $39,999
- 42$40,000 to $49,999
- 24$50,000 to $59,999
- 24$60,000 to $74,999
- 21$75,000 to $99,999
- 5$100,000 to $124,999
- 18$125,000 to $149,999
- 12$150,000 to $199,999
- 4$200,000 or more

Distribution of owner-occupied house/condo value
![Distribution of owner-occupied house/condo value]()
- 6Less than $50,000
- 14$50,000 to $99,999
- 28$100,000 to $149,999
- 23$150,000 to $199,999
- 9$200,000 to $249,999
- 5$250,000 to $299,999
- 17$300,000 to $399,999
- 2$400,000 to $499,999
- 15$1,000,000 or more

Distribution of rent paid by renters
![Distribution of rent paid by renters]()
- 10$200 to $299
- 11$300 to $399
- 19$400 to $499
- 11$500 to $599
- 9$600 to $699
- 13$700 to $799
- 12$800 to $899
- 22$900 to $999
- 15$1,000 to $1,249
- 6$1,250 to $1,499
- 2$1,500 to $1,999
- 6$2,000 or more

Median rent in 2022:
| Hillside Park: | $780 |
| Durham: | $1,246 |
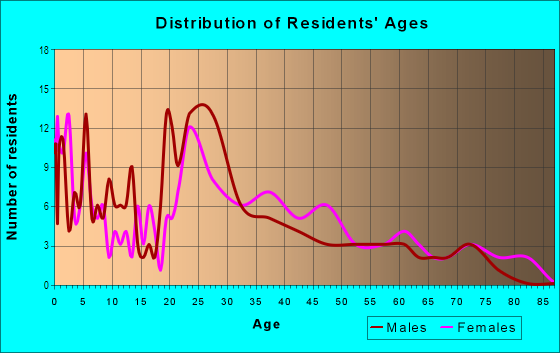
| Males: | 203 |
| Females: | 233 |
Males:
| This neighborhood: | 32.8 years |
| Whole city: | 34.3 years |
| This neighborhood: | 30.9 years |
| Whole city: | 35.8 years |
Average household size:
| Hillside Park: | 2.5 people |
| Durham: | 2.3 people |
Percentage of family households:
| Hillside Park: | 34.0% |
| Durham: | 41.2% |
| Here: | 11.6% |
| Durham: | 36.4% |
Percentage of married-couple families with children (among all households):
| Hillside Park: | 1.3% |
| Durham: | 27.1% |
Percentage of single-mother households (among all households):
| Hillside Park: | 25.7% |
| Durham: | 12.7% |
Percentage of never married males 15 years old and over:
Percentage of never married females 15 years old and over:
| Hillside Park: | 36.4% |
| Durham: | 20.9% |
Percentage of never married females 15 years old and over:
| Hillside Park: | 38.8% |
| city: | 23.2% |
Percentage of people that speak English not well or not at all:
| Hillside Park: | 7.2% |
| Durham: | 4.9% |
Percentage of people born in this state:
Percentage of people born in another U.S. state:
Percentage of native residents but born outside the U.S.:
Percentage of foreign born residents:
| Here: | 64.8% |
| Durham: | 45.4% |
Percentage of people born in another U.S. state:
| Hillside Park: | 21.7% |
| Durham: | 38.2% |
Percentage of native residents but born outside the U.S.:
| Here: | 1.2% |
| city: | 1.6% |
Percentage of foreign born residents:
| Here: | 12.3% |
| Durham: | 14.8% |
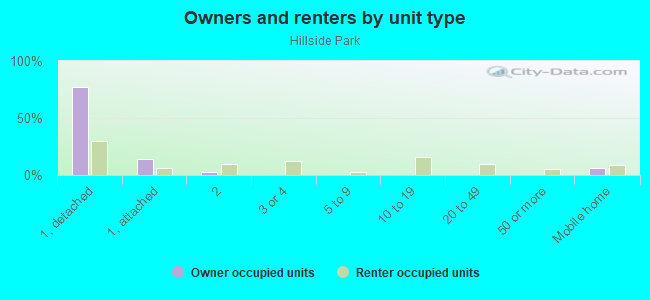
Owner-occupied
Renter-occupied

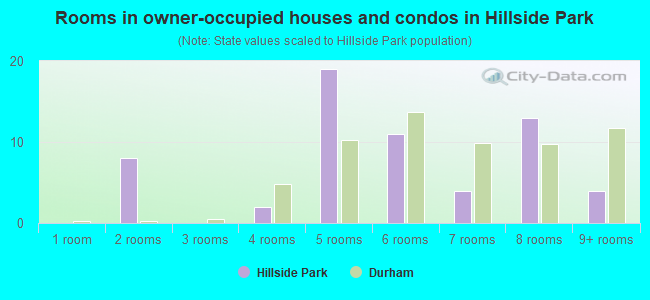
- Rooms in owner-occupied houses and condos in Hillside Park
- 01 room
- 82 rooms
- 03 rooms
- 24 rooms
- 195 rooms
- 116 rooms
- 47 rooms
- 138 rooms
- 49+ rooms
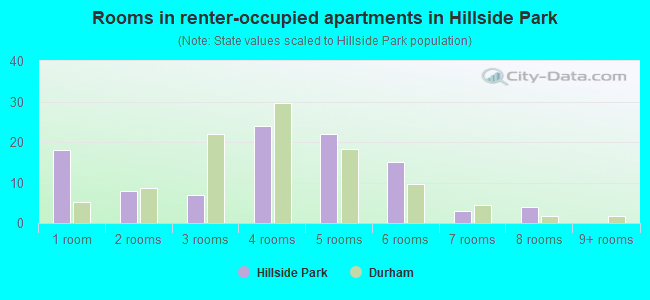
- Rooms in renter-occupied apartments in Hillside Park
- 181 room
- 82 rooms
- 73 rooms
- 244 rooms
- 225 rooms
- 156 rooms
- 37 rooms
- 48 rooms
- 09+ rooms
Owner-occupied
Renter-occupied
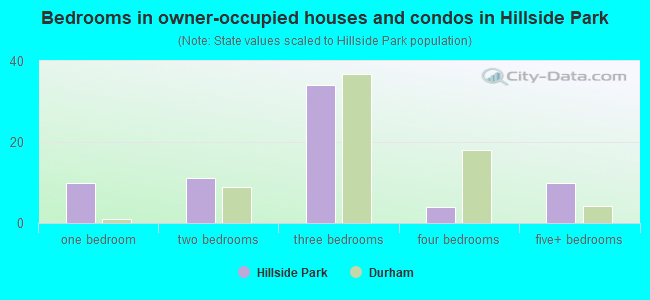
- Bedrooms in owner-occupied houses and condos in Hillside Park
- 0no bedroom
- 101 bedroom
- 112 bedrooms
- 343 bedrooms
- 44 bedrooms
- 105+ bedrooms
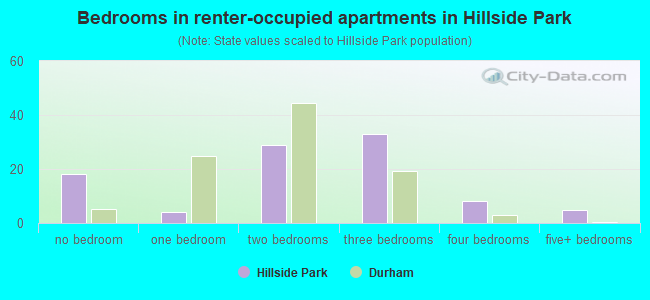
- Bedrooms in renter-occupied apartments in Hillside Park
- 18no bedroom
- 41 bedroom
- 292 bedrooms
- 333 bedrooms
- 84 bedrooms
- 55+ bedrooms
Average number of cars or other vehicles available in houses/condos:
Average number of cars or other vehicles available in apartments:
| This neighborhood: | 1.6 |
| Durham: | 1.9 |
Average number of cars or other vehicles available in apartments:
| Here: | 1.4 |
| city: | 1.3 |
Percentage of units with a mortgage:
| Hillside Park: | 32.2% |
| Durham: | 74.8% |
Average estimated value of detached houses in 2022 (71.9% of all units):
| Hillside Park: | $286,008 |
| Durham: | $359,544 |
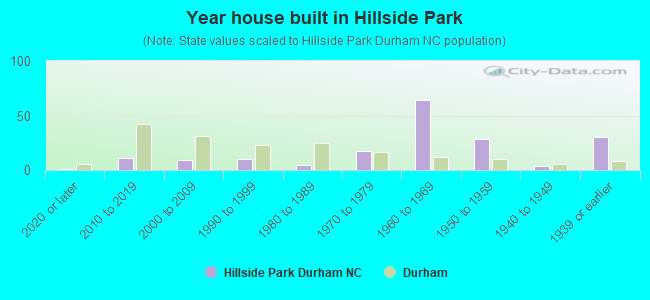
- Year house built in Hillside Park
- 12020 or later
- 112010 to 2019
- 92000 to 2009
- 101990 to 1999
- 51980 to 1989
- 171970 to 1979
- 641960 to 1969
- 281950 to 1959
- 41940 to 1949
- 301939 or earlier
City-data.com crime index for city in 2020 (higher means more crime):
| City: | 425.9 |
| U.S. average: | 219.5 |
Travel time to work (commute)
![Travel time to work (commute)]()
- 3Less than 5 minutes
- 175 to 9 minutes
- 2510 to 14 minutes
- 4615 to 19 minutes
- 3520 to 24 minutes
- 225 to 29 minutes
- 6530 to 34 minutes
- 935 to 39 minutes
- 1440 to 44 minutes
- 745 to 59 minutes
- 1460 to 89 minutes
- 1790 or more minutes

Means of transportation to work
![Means of transportation to work]()
- 53.8%95Drove a car alone
- 15.8%28Carpooled
- 1.1%2Bus
- 31.1%55Taxi
- 5.1%9Motorcycle
- 4.5%8Bicycle
- 17.5%31Walked
- 2.3%4Other means
- 2.8%5Worked at home

Time leaving home to go to work
![Time leaving home to go to work]()
- 1012:00 a.m. to 4:59 a.m.
- 105:00 a.m. to 5:29 a.m.
- 85:30 a.m. to 5:59 a.m.
- 116:00 a.m. to 6:29 a.m.
- 136:30 a.m. to 6:59 a.m.
- 427:00 a.m. to 7:29 a.m.
- 187:30 a.m. to 7:59 a.m.
- 358:00 a.m. to 8:29 a.m.
- 88:30 a.m. to 8:59 a.m.
- 139:00 a.m. to 9:59 a.m.
- 610:00 a.m. to 10:59 a.m.
- 411:00 a.m. to 11:59 a.m.
- 4912:00 p.m. to 3:59 p.m.
- 164:00 p.m. to 11:59 p.m.

Occupations of males:
- Percentage of males in business and financial operations occupations:
Here: 9.2% city: 6.2%
- Percentage of males in computer and mathematical occupations:
Here: 5.1% city: 9.2%
- Percentage of males in architecture and engineering occupations:
Here: 1.8% city: 2.7%
- Percentage of males in healthcare practitioners and technical occupations:
Here: 2.7% city: 5.3%
- Percentage of males in service occupations:
Here: 23.7% city: 13.7%
- Percentage of males in sales and office occupations:
Here: 15.3% city: 12.9%
- Percentage of males in construction, extraction, and maintenance occupations:
Here: 23.8% city: 8.8%
- Percentage of males in production occupations:
Here: 1.1% city: 3.9%
- Percentage of males in transportation occupations:
Here: 3.6% city: 3.3%
- Percentage of males in material moving occupations:
Here: 2.1% city: 4.1%
Occupations of females:
- Percentage of females in management occupations (except farmers):
Here: 3.8% city: 11.0%
- Percentage of females in business and financial operations occupations:
Here: 1.9% city: 8.1%
- Percentage of females in computer and mathematical occupations:
Here: 1.5% city: 2.8%
- Percentage of females in architecture and engineering occupations:
Here: 2.2% city: 0.8%
- Percentage of females in community and social services occupations:
Here: 1.8% city: 3.3%
- Percentage of females in education, training, and library occupations:
Here: 16.7% city: 11.8%
- Percentage of females in healthcare practitioners and technical occupations:
Here: 7.2% city: 13.6%
- Percentage of females in service occupations:
Here: 22.0% city: 16.8%
- Percentage of females in sales and office occupations:
Here: 32.5% city: 19.6%
- Percentage of females in construction, extraction, and maintenance occupations:
Here: 8.3% city: 0.3%
- Percentage of females in material moving occupations:
Here: 2.7% city: 1.3%
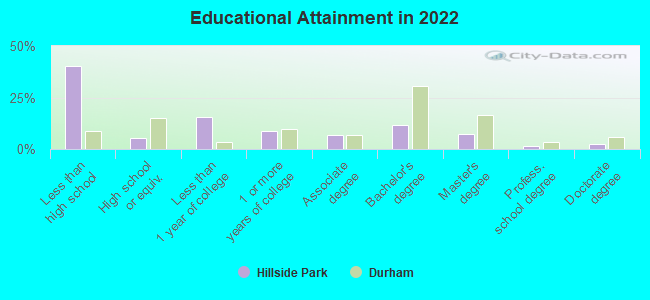
Education in this neighborhood (subdivision or community):
- Percentage of people 3 years and older in K-12 schools:
Hillside Park: 21.2% Durham: 14.4%
- Percentage of people 3 years and older in undergraduate colleges:
Hillside Park: 242.4% Durham: 5.8%
- Percentage of people 3 years and older in grad. or professional schools:
Hillside Park: 0.9% Durham: 4.6%
- Percentage of students K-12 enrolled in private schools:
Hillside Park: 3.3% Durham: 16.9%
Percentage of population below poverty level:
| Hillside Park: | 27.1% |
| Durham: | 11.2% |
Median year owner moved in (as recorded in 2022):
Median year renter moved in (as recorded in 2022):
| Hillside Park: | 1989 |
| Durham: | 2013 |
Median year renter moved in (as recorded in 2022):
| Hillside Park: | 2015 |
| Durham: | 2020 |
Percentage of married-couple families with both working:
| Hillside Park: | 100.0% |
| Durham: | 68.9% |
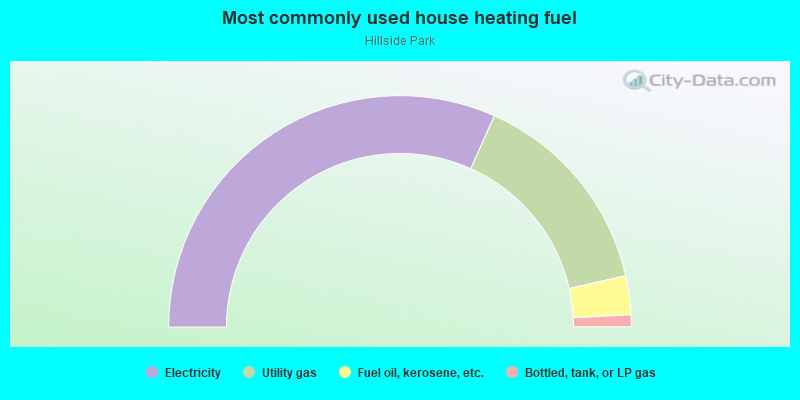
- 63.4%Electricity
- 29.5%Utility gas
- 5.4%Fuel oil, kerosene, etc.
- 1.7%Bottled, tank, or LP gas
Roads and streets:
E Pilot St
Length: 0.47 miles
Directions: N-S, SE-NW
Address range: 100 to 599
Directions: N-S, SE-NW
Address range: 100 to 599
E Weaver St
Length: 0.34 miles
Direction: SW-NE
Address range: 2500 to 2699
Direction: SW-NE
Address range: 2500 to 2699
Atlantic St
Length: 0.19 miles
Direction: SW-NE
Address range: 2700 to 2899
Direction: SW-NE
Address range: 2700 to 2899
Janet St
Length: 0.19 miles
Direction: SW-NE
Address range: 2500 to 2599
Direction: SW-NE
Address range: 2500 to 2599
Wyeth Ave
Length: 0.16 miles
Directions: E-W, SW-NE
Address range: 2800 to 2899
Directions: E-W, SW-NE
Address range: 2800 to 2899
Otis St
Length: 0.15 miles
Direction: SW-NE
Address range: 2500 to 2599
Direction: SW-NE
Address range: 2500 to 2599
Habitat Ln
Length: 0.15 miles
Directions: E-W, SW-NE
Directions: E-W, SW-NE
E Alton St
Length: 0.14 miles
Directions: N-S, SE-NW
Address range: 200 to 399
Directions: N-S, SE-NW
Address range: 200 to 399
Fayetteville Rd (State Rd 1118)
Length: 0.12 miles
Direction: SW-NE
Address range: 3000 to 3148
Direction: SW-NE
Address range: 3000 to 3148
Jesmond St
Length: 0.10 miles
Directions: N-S, SE-NW
Address range: 300 to 399
Directions: N-S, SE-NW
Address range: 300 to 399
Wayne Cir
Length: 0.08 miles
Directions: N-S, SE-NW
Address range: 300 to 399
Directions: N-S, SE-NW
Address range: 300 to 399
Red Oak Ave
Length: 0.05 miles
Directions: E-W, SE-NW
Directions: E-W, SE-NW
Railroad features:
American Tobacco Co Spur RR
Length: 0.13 miles
Direction: N-S
Direction: N-S