Hunter Park neighborhood in Lansing, Michigan (MI), 48912 detailed profile
Settings
X


Business Search - 14 Million verified businesses
Area: 0.147 square miles
Population: 1,016
Population density:
| Hunter Park: | 6,902 people per square mile |
| Lansing: | 3,223 people per square mile |

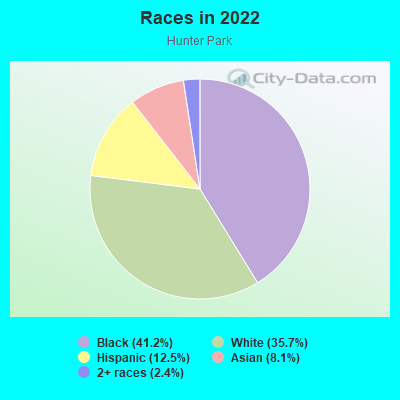
- 45541.2%Black
- 39435.7%White
- 13812.5%Hispanic or Latino
- 898.1%Asian
- 272.4%Two or more races
- 10.09%American Indian
Median household income in 2022:
| Hunter Park: | $44,923 |
| Lansing: | $48,962 |
Distribution of median household income
![Distribution of median household income]()
- 16Less than $10,000
- 89$10,000 to $19,999
- 49$20,000 to $29,999
- 78$30,000 to $39,999
- 36$40,000 to $49,999
- 32$50,000 to $59,999
- 20$60,000 to $74,999
- 24$75,000 to $99,999
- 11$100,000 to $124,999
- 42$125,000 to $149,999
- 9$150,000 to $199,999
- 9$200,000 or more

Distribution of owner-occupied house/condo value
![Distribution of owner-occupied house/condo value]()
- 72Less than $50,000
- 97$50,000 to $99,999
- 84$100,000 to $149,999
- 46$150,000 to $199,999
- 7$200,000 to $249,999
- 21$250,000 to $299,999
- 8$300,000 to $399,999
- 4$750,000 to $999,999

Distribution of rent paid by renters
![Distribution of rent paid by renters]()
- 8Less than $100
- 69$300 to $399
- 36$400 to $499
- 14$500 to $599
- 45$600 to $699
- 40$700 to $799
- 56$800 to $899
- 47$900 to $999
- 55$1,000 to $1,249
- 21$1,250 to $1,499
- 8$1,500 to $1,999

Median rent in 2022:
| Hunter Park: | $838 |
| Lansing: | $773 |
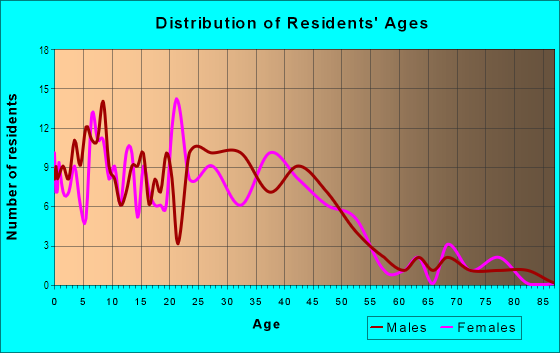
| Males: | 565 |
| Females: | 451 |
Males:
| This neighborhood: | 28.3 years |
| Whole city: | 33.0 years |
| This neighborhood: | 28.3 years |
| Whole city: | 34.5 years |
Average household size:
| Hunter Park: | 2.1 people |
| Lansing: | 2.1 people |
Percentage of family households:
| Hunter Park: | 49.2% |
| Lansing: | 33.9% |
| Here: | 21.6% |
| Lansing: | 27.4% |
Percentage of married-couple families with children (among all households):
| Hunter Park: | 3.9% |
| Lansing: | 23.0% |
Percentage of single-mother households (among all households):
| Hunter Park: | 25.7% |
| Lansing: | 14.1% |
Percentage of never married males 15 years old and over:
Percentage of never married females 15 years old and over:
| Hunter Park: | 34.8% |
| Lansing: | 24.9% |
Percentage of never married females 15 years old and over:
| Hunter Park: | 22.5% |
| city: | 21.6% |
Percentage of people that speak English not well or not at all:
| Hunter Park: | 8.4% |
| Lansing: | 2.3% |
Percentage of people born in this state:
Percentage of people born in another U.S. state:
Percentage of native residents but born outside the U.S.:
Percentage of foreign born residents:
| Here: | 66.8% |
| Lansing: | 72.5% |
Percentage of people born in another U.S. state:
| Hunter Park: | 20.4% |
| Lansing: | 19.1% |
Percentage of native residents but born outside the U.S.:
| Here: | 0.5% |
| city: | 0.8% |
Percentage of foreign born residents:
| Here: | 12.4% |
| Lansing: | 7.6% |
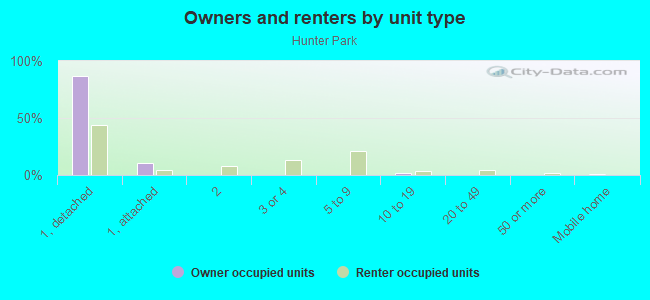
Owner-occupied
Renter-occupied

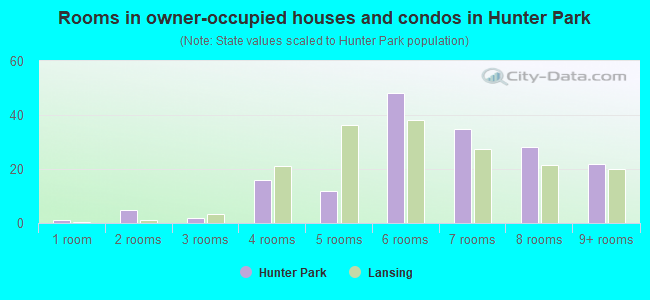
- Rooms in owner-occupied houses and condos in Hunter Park
- 11 room
- 52 rooms
- 23 rooms
- 164 rooms
- 125 rooms
- 486 rooms
- 357 rooms
- 288 rooms
- 229+ rooms
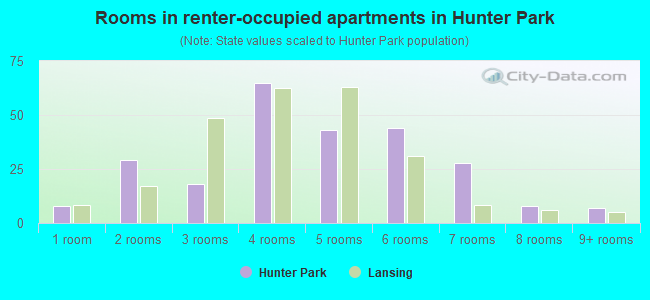
- Rooms in renter-occupied apartments in Hunter Park
- 81 room
- 292 rooms
- 183 rooms
- 654 rooms
- 435 rooms
- 446 rooms
- 287 rooms
- 88 rooms
- 79+ rooms
Owner-occupied
Renter-occupied
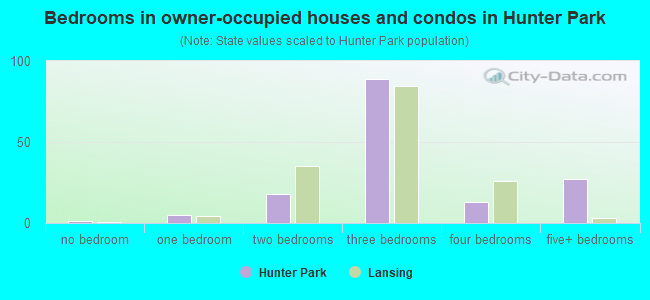
- Bedrooms in owner-occupied houses and condos in Hunter Park
- 1no bedroom
- 51 bedroom
- 182 bedrooms
- 893 bedrooms
- 134 bedrooms
- 275+ bedrooms
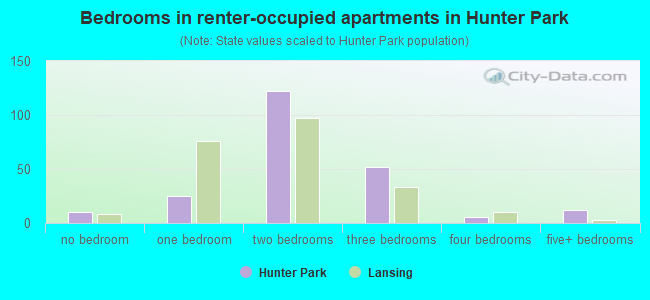
- Bedrooms in renter-occupied apartments in Hunter Park
- 10no bedroom
- 251 bedroom
- 1222 bedrooms
- 523 bedrooms
- 64 bedrooms
- 125+ bedrooms
Average number of cars or other vehicles available in houses/condos:
Average number of cars or other vehicles available in apartments:
| This neighborhood: | 1.6 |
| Lansing: | 1.7 |
Average number of cars or other vehicles available in apartments:
| Here: | 1.3 |
| city: | 1.1 |
Percentage of units with a mortgage:
| Hunter Park: | 61.8% |
| Lansing: | 65.6% |
Average estimated value of detached houses in 2022 (84.6% of all units):
| Hunter Park: | $114,690 |
| Lansing: | $121,378 |
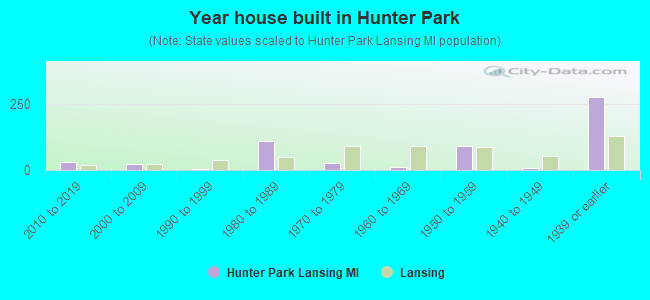
- Year house built in Hunter Park
- 02020 or later
- 312010 to 2019
- 242000 to 2009
- 51990 to 1999
- 1101980 to 1989
- 261970 to 1979
- 131960 to 1969
- 891950 to 1959
- 71940 to 1949
- 2741939 or earlier
City-data.com crime index for city in 2020 (higher means more crime):
| City: | 553.0 |
| U.S. average: | 219.5 |
Travel time to work (commute)
![Travel time to work (commute)]()
- 33Less than 5 minutes
- 515 to 9 minutes
- 7910 to 14 minutes
- 9615 to 19 minutes
- 3820 to 24 minutes
- 725 to 29 minutes
- 430 to 34 minutes
- 735 to 39 minutes
- 540 to 44 minutes
- 1945 to 59 minutes
- 5560 to 89 minutes
- 490 or more minutes

Means of transportation to work
![Means of transportation to work]()
- 61.5%233Drove a car alone
- 19.3%73Carpooled
- 2.6%10Bus
- 12.9%49Taxi
- 1.8%7Motorcycle
- 4.2%16Bicycle
- 1.6%6Walked
- 3.2%12Other means
- 6.9%26Worked at home

Time leaving home to go to work
![Time leaving home to go to work]()
- 2912:00 a.m. to 4:59 a.m.
- 15:00 a.m. to 5:29 a.m.
- 205:30 a.m. to 5:59 a.m.
- 356:00 a.m. to 6:29 a.m.
- 316:30 a.m. to 6:59 a.m.
- 77:00 a.m. to 7:29 a.m.
- 487:30 a.m. to 7:59 a.m.
- 498:00 a.m. to 8:29 a.m.
- 248:30 a.m. to 8:59 a.m.
- 259:00 a.m. to 9:59 a.m.
- 810:00 a.m. to 10:59 a.m.
- 1811:00 a.m. to 11:59 a.m.
- 1312:00 p.m. to 3:59 p.m.
- 314:00 p.m. to 11:59 p.m.

Occupations of males:
- Percentage of males in business and financial operations occupations:
Here: 10.7% city: 4.1%
- Percentage of males in computer and mathematical occupations:
Here: 4.1% city: 6.1%
- Percentage of males in life, physical, and social science occupations:
Here: 1.4% city: 1.9%
- Percentage of males in education, training, and library occupations:
Here: 12.5% city: 4.9%
- Percentage of males in healthcare practitioners and technical occupations:
Here: 7.8% city: 2.5%
- Percentage of males in service occupations:
Here: 17.9% city: 17.2%
- Percentage of males in sales and office occupations:
Here: 19.6% city: 13.3%
- Percentage of males in construction, extraction, and maintenance occupations:
Here: 6.6% city: 6.5%
- Percentage of males in production occupations:
Here: 7.1% city: 9.4%
- Percentage of males in transportation occupations:
Here: 12.3% city: 6.7%
Occupations of females:
- Percentage of females in management occupations (except farmers):
Here: 2.2% city: 6.9%
- Percentage of females in business and financial operations occupations:
Here: 5.7% city: 6.7%
- Percentage of females in life, physical, and social science occupations:
Here: 2.1% city: 1.6%
- Percentage of females in education, training, and library occupations:
Here: 3.3% city: 8.7%
- Percentage of females in healthcare practitioners and technical occupations:
Here: 4.3% city: 6.7%
- Percentage of females in service occupations:
Here: 53.8% city: 25.0%
- Percentage of females in sales and office occupations:
Here: 25.3% city: 25.9%
- Percentage of females in production occupations:
Here: 5.3% city: 5.6%
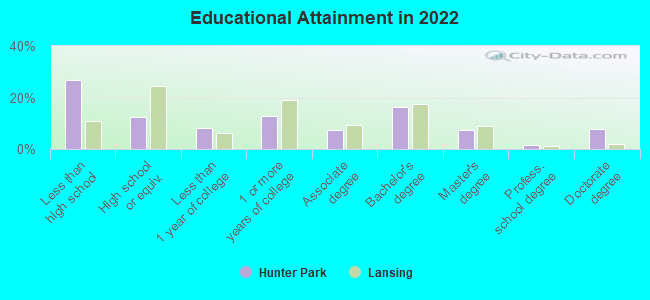
Education in this neighborhood (subdivision or community):
- Percentage of people 3 years and older in K-12 schools:
Hunter Park: 29.2% Lansing: 14.3%
- Percentage of people 3 years and older in undergraduate colleges:
Hunter Park: 4.2% Lansing: 4.6%
- Percentage of people 3 years and older in grad. or professional schools:
Hunter Park: 1.6% Lansing: 2.6%
- Percentage of students K-12 enrolled in private schools:
Hunter Park: 15.3% Lansing: 7.9%
Percentage of population below poverty level:
| Hunter Park: | 25.0% |
| Lansing: | 22.2% |
Median year owner moved in (as recorded in 2022):
Median year renter moved in (as recorded in 2022):
| Hunter Park: | 2008 |
| Lansing: | 2012 |
Median year renter moved in (as recorded in 2022):
| Hunter Park: | 2018 |
| Lansing: | 2020 |
Percentage of married-couple families with both working:
| Hunter Park: | 33.4% |
| Lansing: | 59.6% |
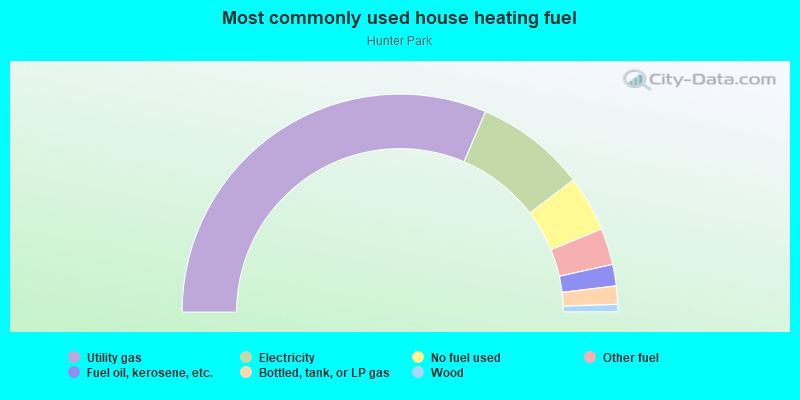
- 62.8%Utility gas
- 16.4%Electricity
- 8.3%No fuel used
- 5.4%Other fuel
- 3.2%Fuel oil, kerosene, etc.
- 2.7%Bottled, tank, or LP gas
- 1.1%Wood
Limited-access highways (interstate or state) in this neighborhood:
I- 496
Length: 0.03 miles
Direction: E-W
Direction: E-W
Roads and streets:
Hickory St
Length: 0.34 miles
Direction: E-W
Address range: 1000 to 1299
Direction: E-W
Address range: 1000 to 1299
Elizabeth St
Length: 0.31 miles
Direction: E-W
Address range: 1400 to 1699
Direction: E-W
Address range: 1400 to 1699
Marcus St
Length: 0.28 miles
Direction: E-W
Address range: 1400 to 1699
Direction: E-W
Address range: 1400 to 1699
Lathrop St
Length: 0.22 miles
Directions: E-W, N-S
Address range: 500 to 699
Directions: E-W, N-S
Address range: 500 to 699
S Holmes St
Length: 0.21 miles
Direction: N-S
Address range: 400 to 699
Direction: N-S
Address range: 400 to 699
Larned St
Length: 0.20 miles
Direction: E-W
Address range: 1100 to 1299
Direction: E-W
Address range: 1100 to 1299
Shepard St
Length: 0.20 miles
Direction: N-S
Address range: 500 to 799
Direction: N-S
Address range: 500 to 799
Jones St
Length: 0.18 miles
Direction: N-S
Address range: 400 to 699
Direction: N-S
Address range: 400 to 699
Allen St
Length: 0.18 miles
Directions: E-W, N-S, SW-NE
Address range: 500 to 699
Directions: E-W, N-S, SW-NE
Address range: 500 to 699
Clifford St
Length: 0.14 miles
Direction: N-S
Address range: 500 to 699
Direction: N-S
Address range: 500 to 699
E Kalamazoo St
Length: 0.13 miles
Direction: E-W
Address range: 1200 to 1299
Direction: E-W
Address range: 1200 to 1299
Bement St
Length: 0.13 miles
Direction: E-W
Address range: 1200 to 1299
Direction: E-W
Address range: 1200 to 1299
Fuller St
Length: 0.13 miles
Directions: E-W, SW-NE
Address range: 1400 to 1499
Directions: E-W, SW-NE
Address range: 1400 to 1499
Heald Pl
Length: 0.07 miles
Direction: E-W
Address range: 1058 to 1087
Direction: E-W
Address range: 1058 to 1087