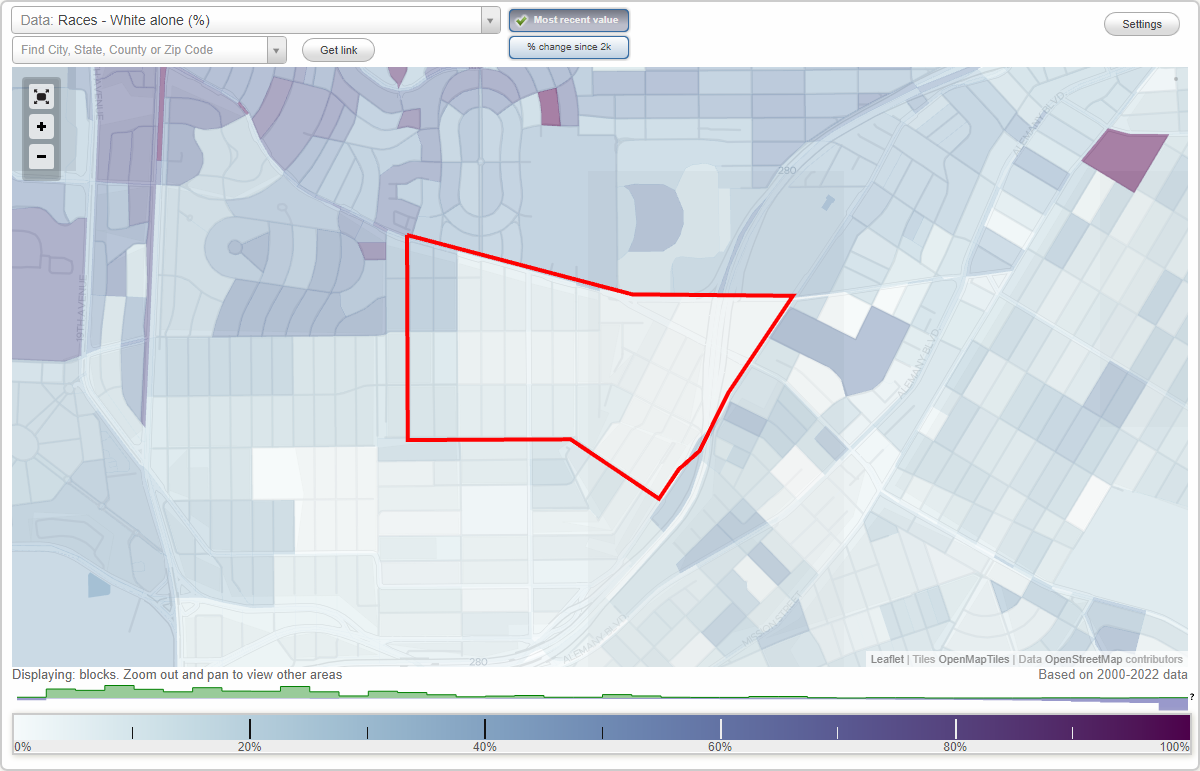
Ingleside neighborhood in San Francisco, California (CA), 94112 detailed profile
Settings
X

Business Search - 14 Million verified businesses
Area: 0.329 square miles
Population: 5,348
Population density:
| Ingleside: | 16,250 people per square mile |
| San Francisco: | 17,313 people per square mile |

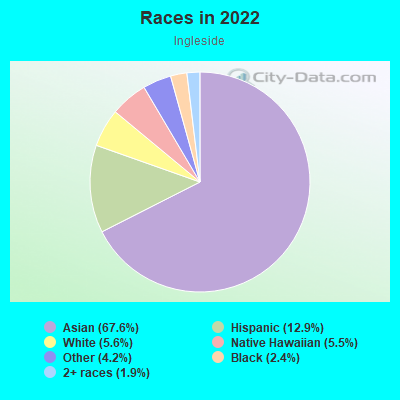
- 3,88567.6%Asian
- 74412.9%Hispanic or Latino
- 3245.6%White
- 3145.5%Native Hawaiian and Other
Pacific Islander - 2394.2%Some other race
- 1362.4%Black
- 1081.9%Two or more races
Distribution of median household income
![Distribution of median household income]()
- 77Less than $10,000
- 82$10,000 to $19,999
- 62$20,000 to $29,999
- 287$30,000 to $39,999
- 51$40,000 to $49,999
- 91$50,000 to $59,999
- 28$60,000 to $74,999
- 167$75,000 to $99,999
- 69$100,000 to $124,999
- 153$125,000 to $149,999
- 222$150,000 to $199,999
- 334$200,000 or more

Distribution of owner-occupied house/condo value
![Distribution of owner-occupied house/condo value]()
- 28Less than $50,000
- 62$100,000 to $149,999
- 20$150,000 to $199,999
- 8$250,000 to $299,999
- 72$300,000 to $399,999
- 88$400,000 to $499,999
- 73$500,000 to $749,999
- 295$750,000 to $999,999
- 479$1,000,000 or more

Distribution of rent paid by renters
![Distribution of rent paid by renters]()
- 30$200 to $299
- 79$400 to $499
- 124$700 to $799
- 32$800 to $899
- 193$900 to $999
- 128$1,000 to $1,249
- 97$1,250 to $1,499
- 83$1,500 to $1,999
- 277$2,000 or more

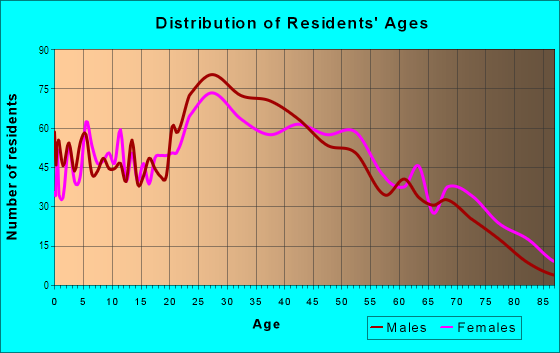
| Males: | 2,565 |
| Females: | 2,783 |
Males:
| This neighborhood: | 41.5 years |
| Whole city: | 40.3 years |
| This neighborhood: | 50.6 years |
| Whole city: | 40.5 years |
Average household size:
| Ingleside: | 3.2 people |
| San Francisco: | 2.2 people |
Percentage of family households:
| Ingleside: | 27.1% |
| San Francisco: | 30.3% |
| Here: | 35.6% |
| San Francisco: | 35.3% |
Percentage of married-couple families with children (among all households):
| Ingleside: | 24.6% |
| San Francisco: | 35.9% |
Percentage of single-mother households (among all households):
| Ingleside: | 7.4% |
| San Francisco: | 6.0% |
Percentage of never married males 15 years old and over:
Percentage of never married females 15 years old and over:
| Ingleside: | 21.6% |
| San Francisco: | 24.6% |
Percentage of never married females 15 years old and over:
| Ingleside: | 15.8% |
| city: | 19.9% |
Percentage of people that speak English not well or not at all:
| Ingleside: | 27.9% |
| San Francisco: | 10.9% |
Percentage of people born in this state:
Percentage of people born in another U.S. state:
Percentage of native residents but born outside the U.S.:
Percentage of foreign born residents:
| Here: | 37.8% |
| San Francisco: | 40.8% |
Percentage of people born in another U.S. state:
| Ingleside: | 6.2% |
| San Francisco: | 23.4% |
Percentage of native residents but born outside the U.S.:
| Here: | 3.2% |
| city: | 2.6% |
Percentage of foreign born residents:
| Here: | 52.8% |
| San Francisco: | 33.2% |
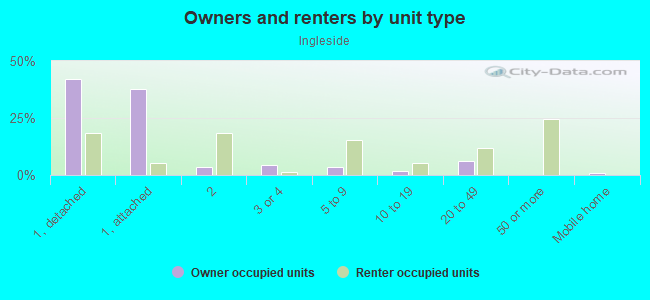
Owner-occupied
Renter-occupied

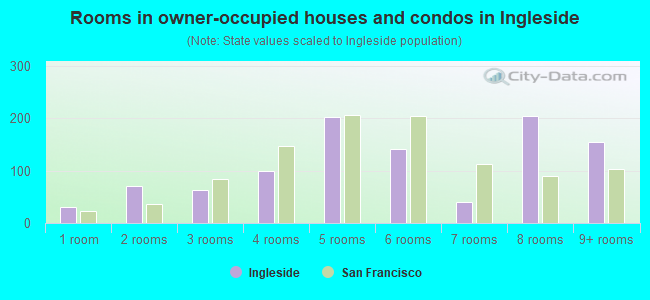
- Rooms in owner-occupied houses and condos in Ingleside
- 301 room
- 712 rooms
- 623 rooms
- 994 rooms
- 2025 rooms
- 1426 rooms
- 407 rooms
- 2048 rooms
- 1549+ rooms
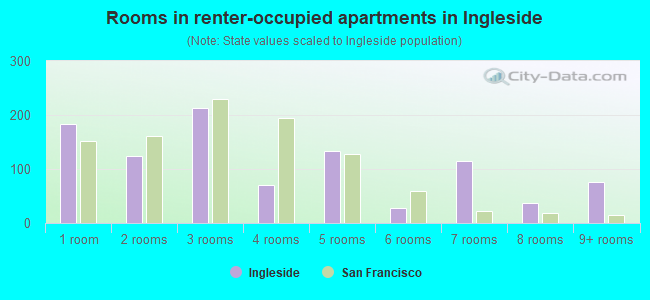
- Rooms in renter-occupied apartments in Ingleside
- 1831 room
- 1242 rooms
- 2133 rooms
- 704 rooms
- 1335 rooms
- 286 rooms
- 1157 rooms
- 378 rooms
- 769+ rooms
Owner-occupied
Renter-occupied
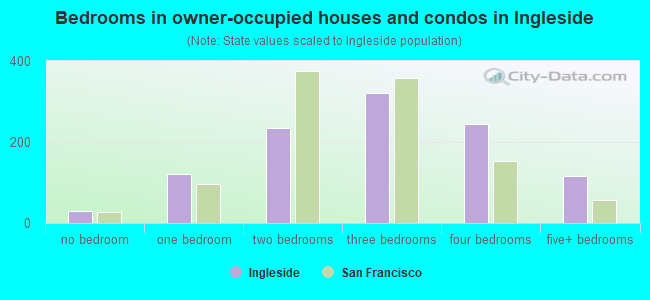
- Bedrooms in owner-occupied houses and condos in Ingleside
- 30no bedroom
- 1221 bedroom
- 2342 bedrooms
- 3203 bedrooms
- 2444 bedrooms
- 1175+ bedrooms
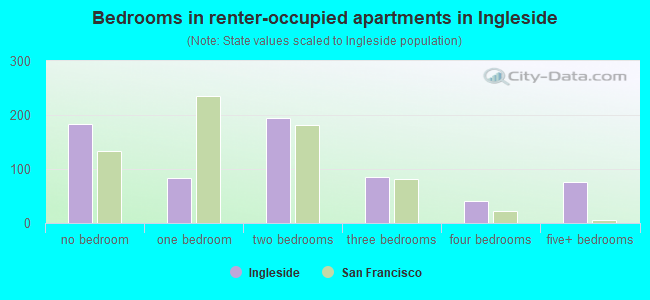
- Bedrooms in renter-occupied apartments in Ingleside
- 183no bedroom
- 841 bedroom
- 1942 bedrooms
- 853 bedrooms
- 404 bedrooms
- 765+ bedrooms
Average number of cars or other vehicles available in houses/condos:
Average number of cars or other vehicles available in apartments:
| This neighborhood: | 2.1 |
| San Francisco: | 1.5 |
Average number of cars or other vehicles available in apartments:
| Here: | 1.5 |
| city: | 0.8 |
Percentage of units with a mortgage:
| Ingleside: | 55.9% |
| San Francisco: | 62.3% |
Housing prices:
- Average estimated value of detached houses in 2022 (48.1% of all units):
Ingleside: $1,123,182 San Francisco: $1,942,973
- Average estimated value of townhouses or other attached units in 2022 (33.4% of all units):
This neighborhood: $1,238,235 city: $1,528,422
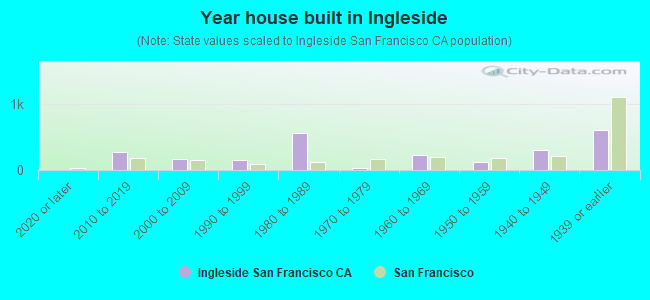
- Year house built in Ingleside
- 02020 or later
- 2742010 to 2019
- 1632000 to 2009
- 1481990 to 1999
- 5531980 to 1989
- 291970 to 1979
- 2231960 to 1969
- 1251950 to 1959
- 2961940 to 1949
- 6031939 or earlier
City-data.com crime index for city in 2020 (higher means more crime):
| City: | 387.4 |
| U.S. average: | 219.5 |
Travel time to work (commute)
![Travel time to work (commute)]()
- 84Less than 5 minutes
- 445 to 9 minutes
- 11010 to 14 minutes
- 19015 to 19 minutes
- 48320 to 24 minutes
- 15225 to 29 minutes
- 83030 to 34 minutes
- 6735 to 39 minutes
- 22640 to 44 minutes
- 20445 to 59 minutes
- 37160 to 89 minutes
- 12790 or more minutes

Means of transportation to work
![Means of transportation to work]()
- 54.4%1,424Drove a car alone
- 7.1%187Carpooled
- 13.1%342Bus
- 9.8%256Subway or elevated rail
- 0.7%19Long-distance train or commuter rail
- 1.5%40Light rail, streetcar or trolley
- 3.9%102Taxi
- 4.0%106Motorcycle
- 2.8%74Bicycle
- 2.4%62Walked
- 2.7%71Other means
- 11.8%310Worked at home

Time leaving home to go to work
![Time leaving home to go to work]()
- 15112:00 a.m. to 4:59 a.m.
- 385:00 a.m. to 5:29 a.m.
- 1255:30 a.m. to 5:59 a.m.
- 2626:00 a.m. to 6:29 a.m.
- 1346:30 a.m. to 6:59 a.m.
- 2317:00 a.m. to 7:29 a.m.
- 2617:30 a.m. to 7:59 a.m.
- 4338:00 a.m. to 8:29 a.m.
- 5198:30 a.m. to 8:59 a.m.
- 3389:00 a.m. to 9:59 a.m.
- 9910:00 a.m. to 10:59 a.m.
- 4311:00 a.m. to 11:59 a.m.
- 33012:00 p.m. to 3:59 p.m.
- 1374:00 p.m. to 11:59 p.m.

Occupations of males:
- Percentage of males in management occupations (except farmers):
Here: 9.4% city: 17.2%
- Percentage of males in business and financial operations occupations:
Here: 1.6% city: 8.9%
- Percentage of males in computer and mathematical occupations:
Here: 4.0% city: 14.6%
- Percentage of males in community and social services occupations:
Here: 4.9% city: 1.0%
- Percentage of males in education, training, and library occupations:
Here: 11.3% city: 3.4%
- Percentage of males in service occupations:
Here: 28.4% city: 11.8%
- Percentage of males in sales and office occupations:
Here: 12.1% city: 13.5%
- Percentage of males in construction, extraction, and maintenance occupations:
Here: 10.0% city: 3.1%
- Percentage of males in production occupations:
Here: 4.4% city: 2.5%
- Percentage of males in transportation occupations:
Here: 7.0% city: 3.4%
- Percentage of males in material moving occupations:
Here: 1.5% city: 1.8%
Occupations of females:
- Percentage of females in management occupations (except farmers):
Here: 8.8% city: 15.8%
- Percentage of females in business and financial operations occupations:
Here: 9.3% city: 11.5%
- Percentage of females in computer and mathematical occupations:
Here: 1.7% city: 5.1%
- Percentage of females in community and social services occupations:
Here: 10.6% city: 1.6%
- Percentage of females in education, training, and library occupations:
Here: 3.9% city: 7.1%
- Percentage of females in healthcare practitioners and technical occupations:
Here: 3.1% city: 8.4%
- Percentage of females in service occupations:
Here: 18.9% city: 15.4%
- Percentage of females in sales and office occupations:
Here: 28.0% city: 19.3%
- Percentage of females in production occupations:
Here: 13.3% city: 1.5%
- Percentage of females in material moving occupations:
Here: 1.5% city: 0.8%
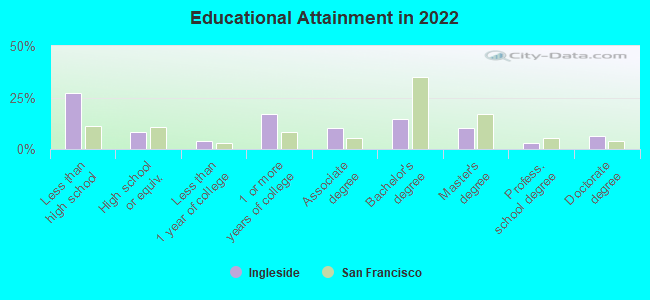
Education in this neighborhood (subdivision or community):
- Percentage of people 3 years and older in K-12 schools:
Ingleside: 13.9% San Francisco: 9.7%
- Percentage of people 3 years and older in undergraduate colleges:
Ingleside: 5.8% San Francisco: 4.8%
- Percentage of people 3 years and older in grad. or professional schools:
Ingleside: 3.5% San Francisco: 2.6%
- Percentage of students K-12 enrolled in private schools:
Ingleside: 62.6% San Francisco: 36.5%
Percentage of population below poverty level:
| Ingleside: | 9.9% |
| San Francisco: | 10.4% |
Median year owner moved in (as recorded in 2022):
Median year renter moved in (as recorded in 2022):
| Ingleside: | 2002 |
| San Francisco: | 2007 |
Median year renter moved in (as recorded in 2022):
| Ingleside: | 2014 |
| San Francisco: | 2019 |
Percentage of married-couple families with both working:
| Ingleside: | 111.6% |
| San Francisco: | 75.9% |
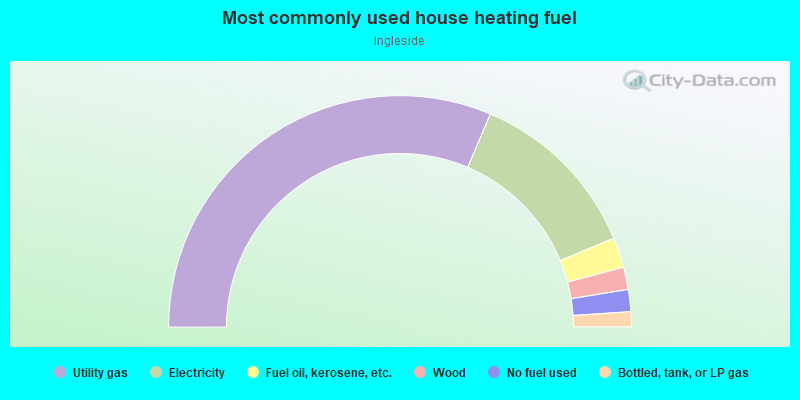
- 62.8%Utility gas
- 24.7%Electricity
- 4.2%Fuel oil, kerosene, etc.
- 3.1%Wood
- 3.1%No fuel used
- 2.1%Bottled, tank, or LP gas
Limited-access highways (interstate or state) in this neighborhood:
I- 280
Length: 0.64 miles
Direction: N-S
Direction: N-S
Roads and streets:
Ocean Ave
Length: 1.88 miles
Directions: E-W, SE-NW, SW-NE
Address range: 601 to 1799
Directions: E-W, SE-NW, SW-NE
Address range: 601 to 1799
Lakeview Ave
Length: 0.72 miles
Directions: E-W, SE-NW
Address range: 100 to 759
Directions: E-W, SE-NW
Address range: 100 to 759
Geneva Ave
Length: 0.66 miles
Directions: E-W, N-S, SE-NW, SW-NE
Address range: 1 to 429
Directions: E-W, N-S, SE-NW, SW-NE
Address range: 1 to 429
Grafton Ave
Length: 0.60 miles
Direction: E-W
Address range: 1 to 799
Direction: E-W
Address range: 1 to 799
Holloway Ave
Length: 0.56 miles
Direction: E-W
Address range: 1 to 799
Direction: E-W
Address range: 1 to 799
Jules Ave
Length: 0.46 miles
Direction: N-S
Address range: 1 to 399
Direction: N-S
Address range: 1 to 399
Faxon Ave
Length: 0.45 miles
Direction: N-S
Address range: 200 to 599
Direction: N-S
Address range: 200 to 599
Capitol Ave
Length: 0.43 miles
Direction: N-S
Address range: 900 to 1299
Direction: N-S
Address range: 900 to 1299
Miramar Ave
Length: 0.42 miles
Direction: N-S
Address range: 1 to 299
Direction: N-S
Address range: 1 to 299
Granada Ave
Length: 0.40 miles
Direction: N-S
Address range: 1 to 299
Direction: N-S
Address range: 1 to 299
Plymouth Ave
Length: 0.39 miles
Direction: N-S
Address range: 900 to 1199
Direction: N-S
Address range: 900 to 1199
Tara St
Length: 0.38 miles
Directions: E-W, N-S, SW-NE
Address range: 1 to 399
Directions: E-W, N-S, SW-NE
Address range: 1 to 399
Brighton Ave
Length: 0.37 miles
Direction: N-S
Address range: 1 to 299
Direction: N-S
Address range: 1 to 299
Lee Ave
Length: 0.36 miles
Direction: N-S
Address range: 1 to 299
Direction: N-S
Address range: 1 to 299
Howth St
Length: 0.34 miles
Direction: SW-NE
Address range: 1 to 399
Direction: SW-NE
Address range: 1 to 399
Harold Ave
Length: 0.30 miles
Direction: N-S
Address range: 1 to 299
Direction: N-S
Address range: 1 to 299
Mount Vernon Ave
Length: 0.30 miles
Directions: E-W, SE-NW
Address range: 417 to 999
Directions: E-W, SE-NW
Address range: 417 to 999
Niagara Ave
Length: 0.28 miles
Directions: E-W, N-S
Address range: 500 to 899
Directions: E-W, N-S
Address range: 500 to 899
Louisburg St
Length: 0.28 miles
Directions: E-W, SW-NE
Address range: 100 to 399
Directions: E-W, SW-NE
Address range: 100 to 399
Ridge Ln
Length: 0.25 miles
Directions: E-W, N-S, SE-NW, SW-NE
Address range: 1 to 498
Directions: E-W, N-S, SE-NW, SW-NE
Address range: 1 to 498
de Montfort Ave
Length: 0.21 miles
Direction: E-W
Address range: 1 to 299
Direction: E-W
Address range: 1 to 299
San Miguel St
Length: 0.14 miles
Directions: N-S, SW-NE
Address range: 300 to 499
Directions: N-S, SW-NE
Address range: 300 to 499
Caine Ave
Length: 0.14 miles
Direction: SW-NE
Address range: 1 to 99
Direction: SW-NE
Address range: 1 to 99
Bruce Ave
Length: 0.13 miles
Direction: E-W
Address range: 1 to 99
Direction: E-W
Address range: 1 to 99
Majestic Ave
Length: 0.12 miles
Direction: SW-NE
Address range: 1 to 99
Direction: SW-NE
Address range: 1 to 99
Edgar Pl
Length: 0.12 miles
Directions: N-S, SW-NE
Address range: 1 to 99
Directions: N-S, SW-NE
Address range: 1 to 99
Margaret Ave
Length: 0.11 miles
Direction: SW-NE
Address range: 1 to 99
Direction: SW-NE
Address range: 1 to 99
Williar Ave
Length: 0.09 miles
Direction: SW-NE
Address range: 1 to 99
Direction: SW-NE
Address range: 1 to 99
Josiah Ave
Length: 0.09 miles
Direction: SW-NE
Address range: 1 to 99
Direction: SW-NE
Address range: 1 to 99
San Jose Ave
Length: 0.08 miles
Directions: SE-NW, SW-NE
Directions: SE-NW, SW-NE
Getz St
Length: 0.06 miles
Direction: N-S
Address range: 1 to 99
Direction: N-S
Address range: 1 to 99