Kemp MIll Estates neighborhood in Silver Spring, Maryland (MD), 20902 detailed profile
Settings
X


Business Search - 14 Million verified businesses
Area: 0.329 square miles
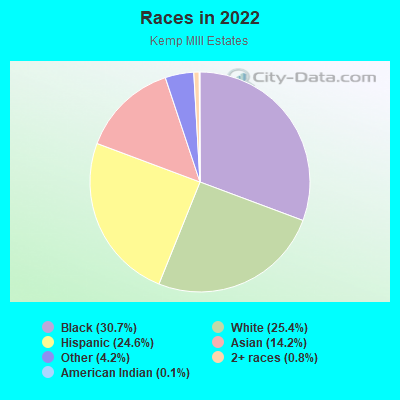
Population: 867
Population density:
| Kemp MIll Estates: | 2,639 people per square mile |
| Silver Spring: | 7,993 people per square mile |

- 26730.7%Black
- 22125.4%White
- 21424.6%Hispanic or Latino
- 12414.2%Asian
- 374.2%Some other race
- 70.8%Two or more races
- 10.1%American Indian

Median household income in 2022:
| Kemp MIll Estates: | $90,729 |
| Silver Spring: | $81,557 |
Distribution of median household income
![Distribution of median household income]()
- 55Less than $10,000
- 38$10,000 to $19,999
- 36$20,000 to $29,999
- 17$30,000 to $39,999
- 42$40,000 to $49,999
- 27$50,000 to $59,999
- 30$60,000 to $74,999
- 32$75,000 to $99,999
- 31$100,000 to $124,999
- 24$125,000 to $149,999
- 51$150,000 to $199,999
- 53$200,000 or more

Distribution of owner-occupied house/condo value
![Distribution of owner-occupied house/condo value]()
- 2Less than $50,000
- 62$50,000 to $99,999
- 189$100,000 to $149,999
- 145$150,000 to $199,999
- 173$200,000 to $249,999
- 19$250,000 to $299,999
- 14$300,000 to $399,999
- 46$400,000 to $499,999
- 49$500,000 to $749,999
- 1$750,000 to $999,999
- 7$1,000,000 or more

Distribution of rent paid by renters
![Distribution of rent paid by renters]()
- 39$200 to $299
- 84$300 to $399
- 1$400 to $499
- 6$600 to $699
- 2$800 to $899
- 6$1,000 to $1,249
- 39$1,250 to $1,499
- 128$1,500 to $1,999
- 58$2,000 or more

Median rent in 2022:
| Kemp MIll Estates: | $1,828 |
| Silver Spring: | $1,620 |
| Males: | 410 |
| Females: | 456 |
Males:
| This neighborhood: | 43.1 years |
| Whole city: | 36.7 years |
| This neighborhood: | 44.0 years |
| Whole city: | 36.5 years |
Average household size:
| Kemp MIll Estates: | 2.5 people |
| Silver Spring: | 2.2 people |
Percentage of family households:
| Kemp MIll Estates: | 45.0% |
| Silver Spring: | 38.8% |
| Here: | 40.3% |
| Silver Spring: | 32.5% |
Percentage of married-couple families with children (among all households):
| Kemp MIll Estates: | 24.3% |
| Silver Spring: | 34.5% |
Percentage of single-mother households (among all households):
| Kemp MIll Estates: | 9.6% |
| Silver Spring: | 6.6% |
Percentage of never married males 15 years old and over:
Percentage of never married females 15 years old and over:
| Kemp MIll Estates: | 11.1% |
| Silver Spring: | 22.2% |
Percentage of never married females 15 years old and over:
| Kemp MIll Estates: | 17.4% |
| place: | 24.3% |
Percentage of people that speak English not well or not at all:
| Kemp MIll Estates: | 5.6% |
| Silver Spring: | 9.9% |
Percentage of people born in this state:
Percentage of people born in another U.S. state:
Percentage of native residents but born outside the U.S.:
Percentage of foreign born residents:
| Here: | 24.5% |
| Silver Spring: | 19.7% |
Percentage of people born in another U.S. state:
| Kemp MIll Estates: | 41.4% |
| Silver Spring: | 45.9% |
Percentage of native residents but born outside the U.S.:
| Here: | 1.6% |
| place: | 2.4% |
Percentage of foreign born residents:
| Here: | 32.5% |
| Silver Spring: | 32.0% |
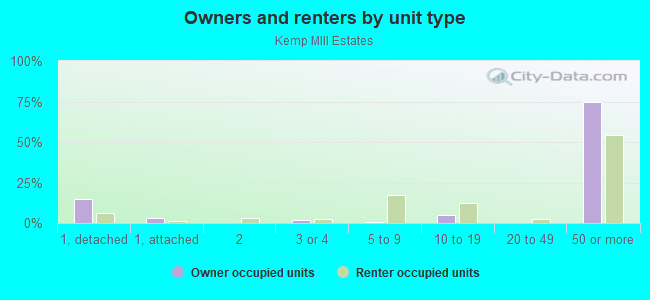
Owner-occupied
Renter-occupied

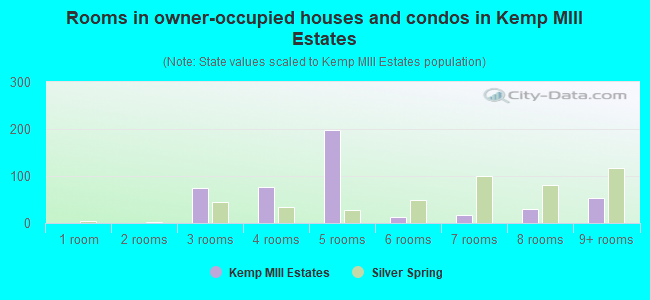
- Rooms in owner-occupied houses and condos in Kemp MIll Estates
- 01 room
- 02 rooms
- 743 rooms
- 774 rooms
- 1985 rooms
- 136 rooms
- 167 rooms
- 298 rooms
- 549+ rooms
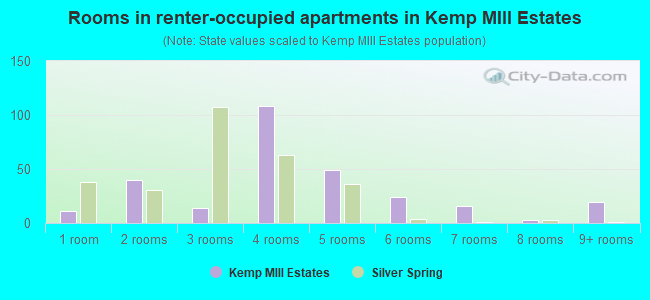
- Rooms in renter-occupied apartments in Kemp MIll Estates
- 111 room
- 402 rooms
- 143 rooms
- 1084 rooms
- 495 rooms
- 246 rooms
- 167 rooms
- 38 rooms
- 199+ rooms
Owner-occupied
Renter-occupied
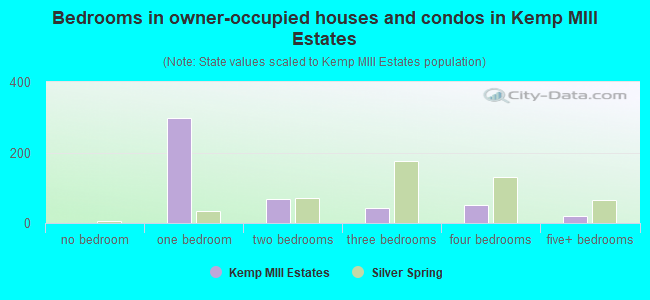
- Bedrooms in owner-occupied houses and condos in Kemp MIll Estates
- 0no bedroom
- 2991 bedroom
- 682 bedrooms
- 433 bedrooms
- 504 bedrooms
- 195+ bedrooms

- Bedrooms in renter-occupied apartments in Kemp MIll Estates
- 11no bedroom
- 821 bedroom
- 722 bedrooms
- 363 bedrooms
- 144 bedrooms
- 55+ bedrooms
Average number of cars or other vehicles available in houses/condos:
Average number of cars or other vehicles available in apartments:
| This neighborhood: | |
| Silver Spring: |
Average number of cars or other vehicles available in apartments:
| Here: | 1.3 |
| place: | 0.9 |
Percentage of units with a mortgage:
| Kemp MIll Estates: | 46.3% |
| Silver Spring: | 76.3% |
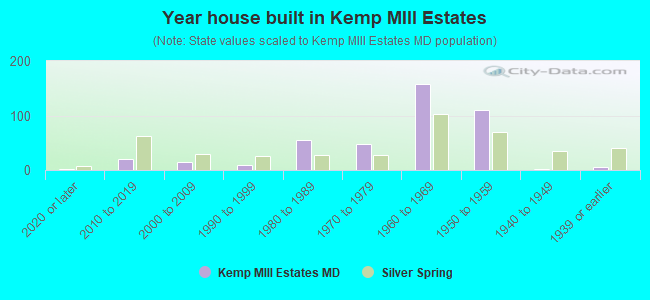
- Year house built in Kemp MIll Estates
- 22020 or later
- 202010 to 2019
- 152000 to 2009
- 101990 to 1999
- 551980 to 1989
- 481970 to 1979
- 1581960 to 1969
- 1101950 to 1959
- 21940 to 1949
- 51939 or earlier
Travel time to work (commute)
![Travel time to work (commute)]()
- 3Less than 5 minutes
- 125 to 9 minutes
- 1510 to 14 minutes
- 4015 to 19 minutes
- 4320 to 24 minutes
- 2525 to 29 minutes
- 6330 to 34 minutes
- 2735 to 39 minutes
- 2840 to 44 minutes
- 3445 to 59 minutes
- 5760 to 89 minutes
- 690 or more minutes

Means of transportation to work
![Means of transportation to work]()
- 58.5%263Drove a car alone
- 12.5%56Carpooled
- 9.8%44Bus
- 13.4%60Subway or elevated rail
- 0.2%1Long-distance train or commuter rail
- 0.4%2Taxi
- 8.7%39Walked
- 3.8%17Other means
- 5.8%26Worked at home

Time leaving home to go to work
![Time leaving home to go to work]()
- 1312:00 a.m. to 4:59 a.m.
- 205:00 a.m. to 5:29 a.m.
- 55:30 a.m. to 5:59 a.m.
- 196:00 a.m. to 6:29 a.m.
- 276:30 a.m. to 6:59 a.m.
- 577:00 a.m. to 7:29 a.m.
- 627:30 a.m. to 7:59 a.m.
- 518:00 a.m. to 8:29 a.m.
- 248:30 a.m. to 8:59 a.m.
- 269:00 a.m. to 9:59 a.m.
- 1010:00 a.m. to 10:59 a.m.
- 311:00 a.m. to 11:59 a.m.
- 1612:00 p.m. to 3:59 p.m.
- 324:00 p.m. to 11:59 p.m.

Occupations of males:
- Percentage of males in management occupations (except farmers):
Here: 13.4% place: 11.4%
- Percentage of males in business and financial operations occupations:
Here: 4.3% place: 6.8%
- Percentage of males in computer and mathematical occupations:
Here: 7.1% place: 9.4%
- Percentage of males in architecture and engineering occupations:
Here: 1.6% place: 4.5%
- Percentage of males in life, physical, and social science occupations:
Here: 3.8% place: 5.3%
- Percentage of males in community and social services occupations:
Here: 2.7% place: 1.2%
- Percentage of males in education, training, and library occupations:
Here: 3.4% place: 6.2%
- Percentage of males in healthcare practitioners and technical occupations:
Here: 6.1% place: 2.5%
- Percentage of males in service occupations:
Here: 13.9% place: 10.9%
- Percentage of males in sales and office occupations:
Here: 7.4% place: 9.6%
- Percentage of males in construction, extraction, and maintenance occupations:
Here: 9.1% place: 11.6%
- Percentage of males in production occupations:
Here: 1.0% place: 2.2%
- Percentage of males in transportation occupations:
Here: 25.8% place: 6.4%
Occupations of females:
- Percentage of females in management occupations (except farmers):
Here: 19.9% place: 13.0%
- Percentage of females in business and financial operations occupations:
Here: 4.0% place: 8.9%
- Percentage of females in computer and mathematical occupations:
Here: 2.8% place: 5.0%
- Percentage of females in community and social services occupations:
Here: 8.9% place: 2.9%
- Percentage of females in legal occupations:
Here: 2.3% place: 4.2%
- Percentage of females in education, training, and library occupations:
Here: 9.2% place: 11.2%
- Percentage of females in arts, design, entertainment, sports, and media occupations:
Here: 2.3% place: 4.5%
- Percentage of females in healthcare practitioners and technical occupations:
Here: 7.6% place: 5.3%
- Percentage of females in service occupations:
Here: 26.0% place: 20.4%
- Percentage of females in sales and office occupations:
Here: 21.5% place: 16.7%
Percentage of people 16-64 in Armed Forces:
| Kemp MIll Estates: | 0.3% |
| Silver Spring: | 0.4% |
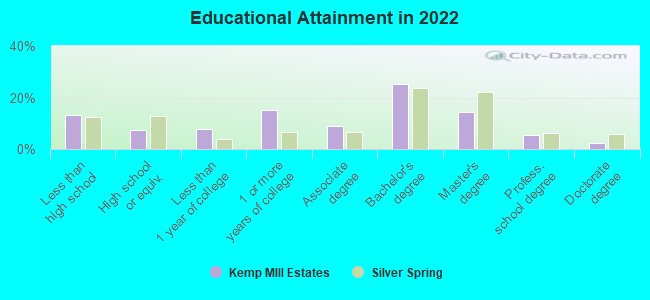
Education in this neighborhood (subdivision or community):
- Percentage of people 3 years and older in K-12 schools:
Kemp MIll Estates: 23.8% Silver Spring: 14.1%
- Percentage of people 3 years and older in undergraduate colleges:
Kemp MIll Estates: 5.5% Silver Spring: 3.4%
- Percentage of people 3 years and older in grad. or professional schools:
Kemp MIll Estates: 11.9% Silver Spring: 2.0%
- Percentage of students K-12 enrolled in private schools:
Kemp MIll Estates: 44.0% Silver Spring: 12.6%
Percentage of population below poverty level:
| Kemp MIll Estates: | 7.1% |
| Silver Spring: | 11.0% |
Median year renter moved in (as recorded in 2022):
| Kemp MIll Estates: | 2018 |
| Silver Spring: | 2020 |
Percentage of married-couple families with both working:
| Kemp MIll Estates: | 133.6% |
| Silver Spring: | 80.2% |
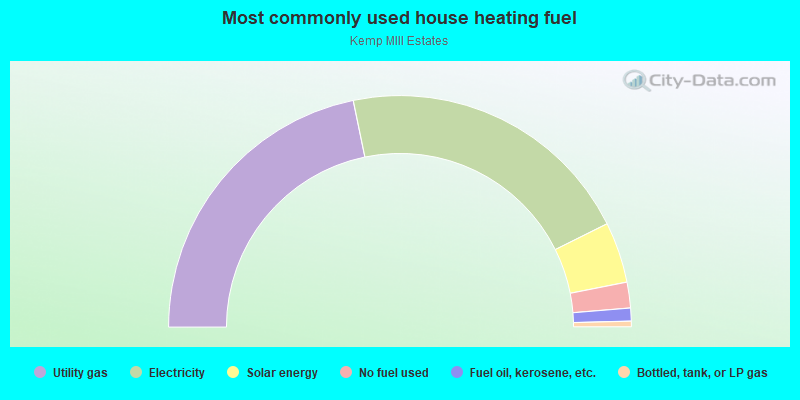
- 43.5%Utility gas
- 41.7%Electricity
- 8.5%Solar energy
- 3.6%No fuel used
- 1.8%Fuel oil, kerosene, etc.
- 0.8%Bottled, tank, or LP gas
Roads and streets:
Kersey Rd
Length: 0.87 miles
Directions: E-W, N-S, SE-NW, SW-NE
Address range: 600 to 1175
Directions: E-W, N-S, SE-NW, SW-NE
Address range: 600 to 1175
Kempmill Rd
Length: 0.54 miles
Directions: E-W, N-S, SW-NE
Address range: 11600 to 11799
Directions: E-W, N-S, SW-NE
Address range: 11600 to 11799
Monticello Ave
Length: 0.48 miles
Directions: N-S, SE-NW, SW-NE
Address range: 11500 to 11899
Directions: N-S, SE-NW, SW-NE
Address range: 11500 to 11899
Three Oaks Dr
Length: 0.45 miles
Directions: E-W, N-S
Directions: E-W, N-S
Clintwood Dr
Length: 0.33 miles
Directions: E-W, N-S, SW-NE
Address range: 900 to 999
Directions: E-W, N-S, SW-NE
Address range: 900 to 999
Bromley St
Length: 0.33 miles
Directions: E-W, N-S, SE-NW, SW-NE
Address range: 800 to 899
Directions: E-W, N-S, SE-NW, SW-NE
Address range: 800 to 899
Yeatman Pkwy
Length: 0.25 miles
Directions: E-W, SE-NW
Address range: 701 to 705
Directions: E-W, SE-NW
Address range: 701 to 705
Brentwood Ln
Length: 0.25 miles
Direction: E-W
Address range: 900 to 999
Direction: E-W
Address range: 900 to 999
Fulham St
Length: 0.24 miles
Directions: N-S, SE-NW, SW-NE
Address range: 11700 to 11799
Directions: N-S, SE-NW, SW-NE
Address range: 11700 to 11799
Annmore Dr
Length: 0.21 miles
Directions: E-W, SE-NW
Address range: 900 to 999
Directions: E-W, SE-NW
Address range: 900 to 999
Arcola Ave
Length: 0.19 miles
Direction: SE-NW
Address range: 1400 to 1599
Direction: SE-NW
Address range: 1400 to 1599
Saddlerock Rd
Length: 0.17 miles
Directions: E-W, N-S, SW-NE
Address range: 11700 to 11899
Directions: E-W, N-S, SW-NE
Address range: 11700 to 11899
N Belgrade Rd
Length: 0.17 miles
Directions: N-S, SE-NW, SW-NE
Address range: 1200 to 1299
Directions: N-S, SE-NW, SW-NE
Address range: 1200 to 1299
Holborn St
Length: 0.15 miles
Direction: E-W
Address range: 900 to 999
Direction: E-W
Address range: 900 to 999
Daffodil Ln
Length: 0.12 miles
Directions: E-W, N-S, SE-NW, SW-NE
Address range: 1300 to 11599
Directions: E-W, N-S, SE-NW, SW-NE
Address range: 1300 to 11599
Saddlerock Ct
Length: 0.12 miles
Directions: E-W, N-S, SE-NW
Address range: 1 to 99
Directions: E-W, N-S, SE-NW
Address range: 1 to 99
Yeatman Ter
Length: 0.11 miles
Directions: N-S, SE-NW, SW-NE
Address range: 11600 to 11703
Directions: N-S, SE-NW, SW-NE
Address range: 11600 to 11703
Heather Crest Ter
Length: 0.09 miles
Directions: E-W, SE-NW
Address range: 1300 to 1314
Directions: E-W, SE-NW
Address range: 1300 to 1314
Heather Crest Ln
Length: 0.09 miles
Direction: SE-NW
Address range: 11400 to 11499
Direction: SE-NW
Address range: 11400 to 11499
Yeatman Ct
Length: 0.09 miles
Directions: E-W, SE-NW, SW-NE
Address range: 1 to 99
Directions: E-W, SE-NW, SW-NE
Address range: 1 to 99
Fillmore Dr
Length: 0.08 miles
Directions: N-S, SE-NW
Address range: 11742 to 11749
Directions: N-S, SE-NW
Address range: 11742 to 11749
Clintwood Pl
Length: 0.07 miles
Direction: E-W
Address range: 11800 to 11899
Direction: E-W
Address range: 11800 to 11899