Laney (Peralta/Laney) neighborhood in Oakland, California (CA), 94606, 94607 detailed profile
Settings
X


Business Search - 14 Million verified businesses
Area: 0.145 square miles
Population: 818
Population density:
| Laney (Peralta/Laney): | 5,633 people per square mile |
| Oakland: | 7,680 people per square mile |

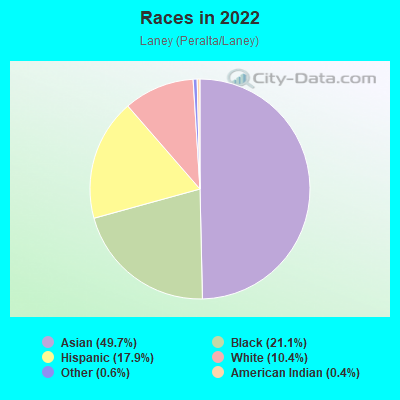
- 40649.7%Asian
- 17221.1%Black
- 14617.9%Hispanic or Latino
- 8510.4%White
- 50.6%Some other race
- 30.4%American Indian
Distribution of median household income
![Distribution of median household income]()
- 27Less than $10,000
- 24$10,000 to $19,999
- 65$20,000 to $29,999
- 21$30,000 to $39,999
- 73$40,000 to $49,999
- 21$50,000 to $59,999
- 11$60,000 to $74,999
- 23$75,000 to $99,999
- 13$100,000 to $124,999
- 19$125,000 to $149,999
- 47$150,000 to $199,999
- 58$200,000 or more

Distribution of owner-occupied house/condo value
![Distribution of owner-occupied house/condo value]()
- 34$250,000 to $299,999
- 15$300,000 to $399,999
- 65$400,000 to $499,999
- 9$500,000 to $749,999
- 26$750,000 to $999,999
- 28$1,000,000 or more

Distribution of rent paid by renters
![Distribution of rent paid by renters]()
- 1$100 to $199
- 10$200 to $299
- 13$300 to $399
- 3$400 to $499
- 3$500 to $599
- 8$600 to $699
- 11$700 to $799
- 100$800 to $899
- 12$900 to $999
- 35$1,000 to $1,249
- 2$1,250 to $1,499
- 25$1,500 to $1,999
- 55$2,000 or more

Median rent in 2022:
| Laney (Peralta/Laney): | $1,283 |
| Oakland: | $1,741 |
| Males: | 397 |
| Females: | 420 |
Males:
| This neighborhood: | 43.3 years |
| Whole city: | 38.3 years |
| This neighborhood: | 44.3 years |
| Whole city: | 39.1 years |
Average household size:
| Laney (Peralta/Laney): | 17.2 people |
| Oakland: | 2.4 people |
Percentage of family households:
| Laney (Peralta/Laney): | 27.2% |
| Oakland: | 37.1% |
| Here: | 30.9% |
| Oakland: | 34.9% |
Percentage of married-couple families with children (among all households):
| Laney (Peralta/Laney): | 17.7% |
| Oakland: | 28.3% |
Percentage of single-mother households (among all households):
| Laney (Peralta/Laney): | 12.0% |
| Oakland: | 9.9% |
Percentage of never married males 15 years old and over:
Percentage of never married females 15 years old and over:
| Laney (Peralta/Laney): | 25.8% |
| Oakland: | 24.6% |
Percentage of never married females 15 years old and over:
| Laney (Peralta/Laney): | 26.1% |
| city: | 21.9% |
Percentage of people that speak English not well or not at all:
| Laney (Peralta/Laney): | 17.5% |
| Oakland: | 10.6% |
Percentage of people born in this state:
Percentage of people born in another U.S. state:
Percentage of native residents but born outside the U.S.:
Percentage of foreign born residents:
| Here: | 34.3% |
| Oakland: | 49.9% |
Percentage of people born in another U.S. state:
| Laney (Peralta/Laney): | 15.3% |
| Oakland: | 22.3% |
Percentage of native residents but born outside the U.S.:
| Here: | 0.0% |
| city: | 1.6% |
Percentage of foreign born residents:
| Here: | 50.4% |
| Oakland: | 26.2% |
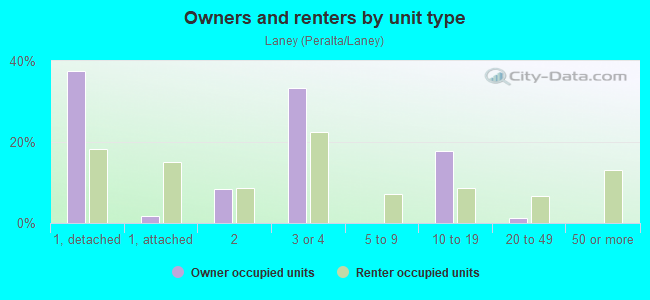
Owner-occupied
Renter-occupied

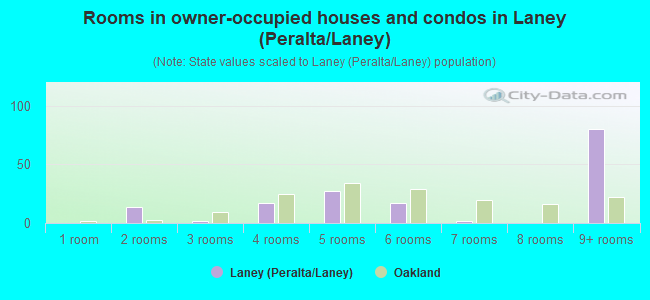
- Rooms in owner-occupied houses and condos in Laney <
> - 01 room
- 142 rooms
- 23 rooms
- 174 rooms
- 275 rooms
- 176 rooms
- 27 rooms
- 08 rooms
- 809+ rooms

- Rooms in renter-occupied apartments in Laney <
> - 311 room
- 62 rooms
- 103 rooms
- 644 rooms
- 195 rooms
- 96 rooms
- 87 rooms
- 758 rooms
- 09+ rooms
Owner-occupied
Renter-occupied
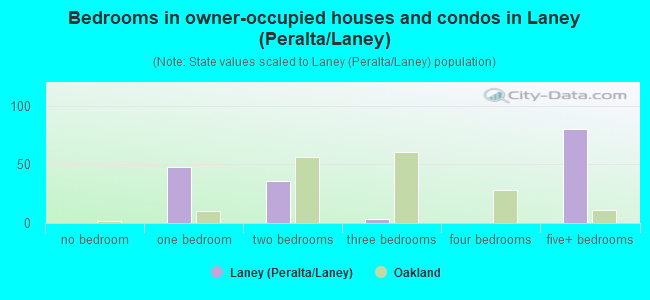
- Bedrooms in owner-occupied houses and condos in Laney <
> - 0no bedroom
- 481 bedroom
- 362 bedrooms
- 33 bedrooms
- 04 bedrooms
- 805+ bedrooms
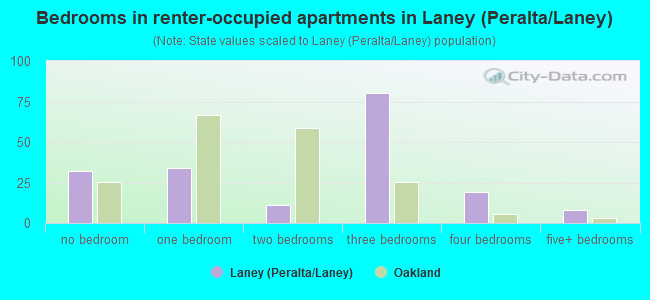
- Bedrooms in renter-occupied apartments in Laney <
> - 32no bedroom
- 341 bedroom
- 112 bedrooms
- 803 bedrooms
- 194 bedrooms
- 85+ bedrooms
Average number of cars or other vehicles available in houses/condos:
Average number of cars or other vehicles available in apartments:
| This neighborhood: | 5.2 |
| Oakland: | 1.8 |
Average number of cars or other vehicles available in apartments:
| Here: | 2.5 |
| city: | 1.1 |
Percentage of units with a mortgage:
| Laney (Peralta/Laney): | 62.1% |
| Oakland: | 71.2% |
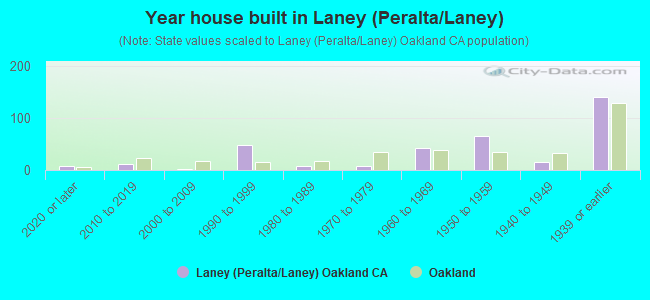
- Year house built in Laney <
> - 82020 or later
- 122010 to 2019
- 22000 to 2009
- 481990 to 1999
- 71980 to 1989
- 81970 to 1979
- 431960 to 1969
- 661950 to 1959
- 161940 to 1949
- 1401939 or earlier
City-data.com crime index for city in 2020 (higher means more crime):
| City: | 691.6 |
| U.S. average: | 219.5 |
Travel time to work (commute)
![Travel time to work (commute)]()
- 205 to 9 minutes
- 1810 to 14 minutes
- 5415 to 19 minutes
- 2020 to 24 minutes
- 1125 to 29 minutes
- 4130 to 34 minutes
- 835 to 39 minutes
- 1240 to 44 minutes
- 6745 to 59 minutes
- 460 to 89 minutes
- 990 or more minutes

Means of transportation to work
![Means of transportation to work]()
- 48.6%249Drove a car alone
- 1.2%6Carpooled
- 14.6%75Bus
- 10.9%56Subway or elevated rail
- 0.6%3Long-distance train or commuter rail
- 4.9%25Ferryboat
- 4.3%22Bicycle
- 0.6%3Walked
- 1.0%5Other means
- 19.9%102Worked at home

Time leaving home to go to work
![Time leaving home to go to work]()
- 1112:00 a.m. to 4:59 a.m.
- 65:00 a.m. to 5:29 a.m.
- 85:30 a.m. to 5:59 a.m.
- 266:00 a.m. to 6:29 a.m.
- 36:30 a.m. to 6:59 a.m.
- 177:00 a.m. to 7:29 a.m.
- 357:30 a.m. to 7:59 a.m.
- 378:00 a.m. to 8:29 a.m.
- 238:30 a.m. to 8:59 a.m.
- 219:00 a.m. to 9:59 a.m.
- 610:00 a.m. to 10:59 a.m.
- 1311:00 a.m. to 11:59 a.m.
- 2612:00 p.m. to 3:59 p.m.
- 44:00 p.m. to 11:59 p.m.

Occupations of males:
- Percentage of males in management occupations (except farmers):
Here: 8.3% city: 13.5%
- Percentage of males in business and financial operations occupations:
Here: 3.8% city: 6.0%
- Percentage of males in computer and mathematical occupations:
Here: 4.4% city: 7.3%
- Percentage of males in architecture and engineering occupations:
Here: 3.0% city: 3.8%
- Percentage of males in life, physical, and social science occupations:
Here: 2.6% city: 2.0%
- Percentage of males in community and social services occupations:
Here: 2.3% city: 1.5%
- Percentage of males in arts, design, entertainment, sports, and media occupations:
Here: 2.2% city: 4.7%
- Percentage of males in healthcare practitioners and technical occupations:
Here: 15.8% city: 2.8%
- Percentage of males in service occupations:
Here: 31.0% city: 12.9%
- Percentage of males in sales and office occupations:
Here: 16.2% city: 13.4%
- Percentage of males in construction, extraction, and maintenance occupations:
Here: 1.7% city: 8.3%
- Percentage of males in material moving occupations:
Here: 7.9% city: 4.5%
Occupations of females:
- Percentage of females in management occupations (except farmers):
Here: 33.2% city: 15.1%
- Percentage of females in business and financial operations occupations:
Here: 3.5% city: 8.2%
- Percentage of females in life, physical, and social science occupations:
Here: 3.0% city: 2.3%
- Percentage of females in community and social services occupations:
Here: 6.2% city: 3.7%
- Percentage of females in education, training, and library occupations:
Here: 4.8% city: 8.4%
- Percentage of females in arts, design, entertainment, sports, and media occupations:
Here: 4.4% city: 4.8%
- Percentage of females in healthcare practitioners and technical occupations:
Here: 1.2% city: 6.7%
- Percentage of females in service occupations:
Here: 24.1% city: 17.8%
- Percentage of females in sales and office occupations:
Here: 9.2% city: 20.0%
- Percentage of females in production occupations:
Here: 7.5% city: 2.4%
- Percentage of females in transportation occupations:
Here: 1.0% city: 1.2%
- Percentage of females in material moving occupations:
Here: 3.5% city: 1.7%
Percentage of people 16-64 in Armed Forces:
| Laney (Peralta/Laney): | 1.2% |
| Oakland: | 0.2% |
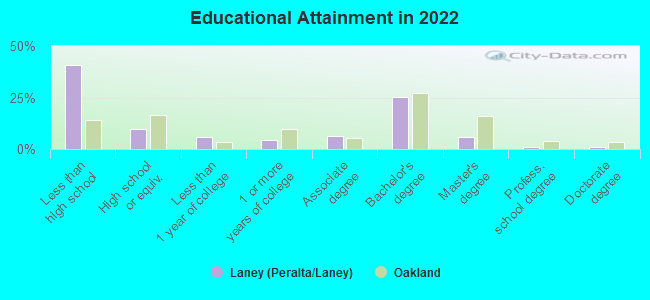
Education in this neighborhood (subdivision or community):
- Percentage of people 3 years and older in K-12 schools:
Laney (Peralta/Laney): 9.9% Oakland: 13.0%
- Percentage of people 3 years and older in undergraduate colleges:
Laney (Peralta/Laney): 7.7% Oakland: 4.3%
- Percentage of people 3 years and older in grad. or professional schools:
Laney (Peralta/Laney): 3.3% Oakland: 1.8%
- Percentage of students K-12 enrolled in private schools:
Laney (Peralta/Laney): 1.2% Oakland: 15.8%
Percentage of population below poverty level:
| Laney (Peralta/Laney): | 12.7% |
| Oakland: | 13.9% |
Median year renter moved in (as recorded in 2022):
| Laney (Peralta/Laney): | 2013 |
| Oakland: | 2018 |
Percentage of married-couple families with both working:
| Laney (Peralta/Laney): | 66.2% |
| Oakland: | 73.2% |
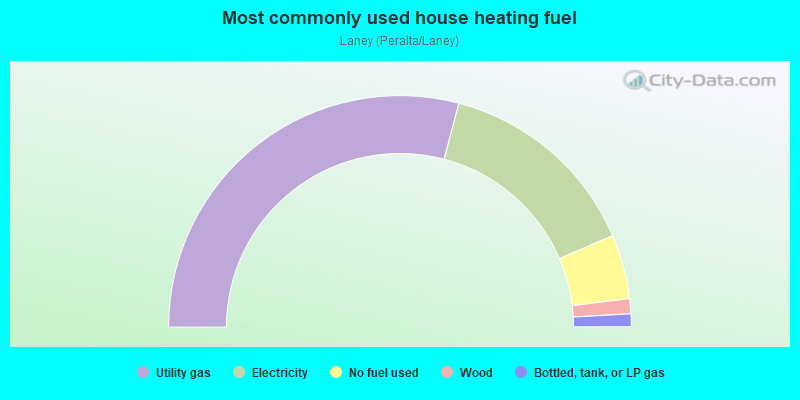
- 58.2%Utility gas
- 28.9%Electricity
- 9.0%No fuel used
- 2.1%Wood
- 1.8%Bottled, tank, or LP gas
Roads and streets:
E 8th
Length: 0.31 miles
Directions: E-W, SE-NW
Directions: E-W, SE-NW
10th St
Length: 0.29 miles
Directions: E-W, SE-NW
Address range: 1 to 49
Directions: E-W, SE-NW
Address range: 1 to 49
7th St
Length: 0.28 miles
Directions: E-W, SE-NW
Address range: 1 to 49
Directions: E-W, SE-NW
Address range: 1 to 49
E 8th St
Length: 0.27 miles
Directions: E-W, SE-NW
Address range: 1 to 580
Directions: E-W, SE-NW
Address range: 1 to 580
Fallon St
Length: 0.23 miles
Directions: E-W, SW-NE
Address range: 500 to 999
Directions: E-W, SW-NE
Address range: 500 to 999
E 10th
Length: 0.15 miles
Direction: SE-NW
Direction: SE-NW
5th
Length: 0.15 miles
Direction: SW-NE
Direction: SW-NE
5th Ave
Length: 0.14 miles
Direction: SW-NE
Address range: 250 to 799
Direction: SW-NE
Address range: 250 to 799
8th
Length: 0.06 miles
Direction: SE-NW
Direction: SE-NW
E 10th St
Length: 0.04 miles
Direction: SE-NW
Address range: 100 to 199
Direction: SE-NW
Address range: 100 to 199
Railroad features:
Union Pacific RR
Length: 0.28 miles
Direction: E-W
Direction: E-W
Other features:
Merritt Chnnl
Length: 0.26 miles
Directions: E-W, N-S, SW-NE
Directions: E-W, N-S, SW-NE