Las Vegas Technology Center neighborhood in Las Vegas, Nevada (NV), 89128 detailed profile
Settings
X

Business Search - 14 Million verified businesses
Area: 0.852 square miles
Population: 2,520
Population density:
| Las Vegas Technology Center: | 2,959 people per square mile |
| Las Vegas: | 5,792 people per square mile |

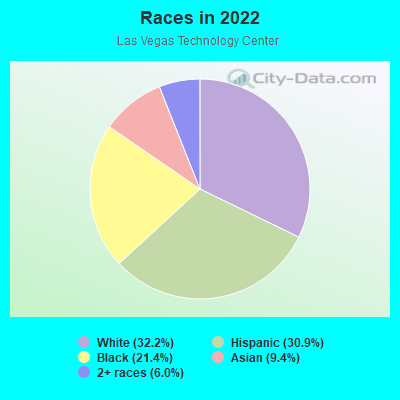
- 83832.2%White
- 80230.9%Hispanic or Latino
- 55721.4%Black
- 2459.4%Asian
- 1576.0%Two or more races
Median household income in 2022:
| Las Vegas Technology Center: | $48,519 |
| Las Vegas: | $68,905 |
Distribution of median household income
![Distribution of median household income]()
- 220Less than $10,000
- 128$10,000 to $19,999
- 149$20,000 to $29,999
- 182$30,000 to $39,999
- 109$40,000 to $49,999
- 157$50,000 to $59,999
- 184$60,000 to $74,999
- 68$75,000 to $99,999
- 125$100,000 to $124,999
- 230$125,000 to $149,999
- 26$150,000 to $199,999
- 79$200,000 or more

Distribution of owner-occupied house/condo value
![Distribution of owner-occupied house/condo value]()
- 24Less than $50,000
- 314$100,000 to $149,999
- 203$150,000 to $199,999
- 86$200,000 to $249,999
- 52$250,000 to $299,999
- 125$300,000 to $399,999
- 183$400,000 to $499,999
- 148$500,000 to $749,999
- 33$750,000 to $999,999

Distribution of rent paid by renters
![Distribution of rent paid by renters]()
- 78$100 to $199
- 70$600 to $699
- 46$700 to $799
- 59$800 to $899
- 126$900 to $999
- 331$1,000 to $1,249
- 170$1,250 to $1,499
- 342$1,500 to $1,999
- 202$2,000 or more

Median rent in 2022:
| Las Vegas Technology Center: | $1,252 |
| Las Vegas: | $1,277 |
| Males: | 1,033 |
| Females: | 1,486 |
Males:
| This neighborhood: | 30.8 years |
| Whole city: | 38.4 years |
| This neighborhood: | 32.8 years |
| Whole city: | 38.9 years |
Average household size:
| Las Vegas Technology Center: | 10.3 people |
| Las Vegas: | 2.7 people |
Percentage of family households:
| Las Vegas Technology Center: | 39.1% |
| Las Vegas: | 45.8% |
| Here: | 19.9% |
| Las Vegas: | 40.9% |
Percentage of married-couple families with children (among all households):
| Las Vegas Technology Center: | 9.1% |
| Las Vegas: | 23.4% |
Percentage of single-mother households (among all households):
| Las Vegas Technology Center: | 24.4% |
| Las Vegas: | 10.1% |
Percentage of never married males 15 years old and over:
Percentage of never married females 15 years old and over:
| Las Vegas Technology Center: | 22.8% |
| Las Vegas: | 19.7% |
Percentage of never married females 15 years old and over:
| Las Vegas Technology Center: | 35.4% |
| city: | 17.0% |
Percentage of people that speak English not well or not at all:
| Las Vegas Technology Center: | 2.5% |
| Las Vegas: | 7.0% |
Percentage of people born in this state:
Percentage of people born in another U.S. state:
Percentage of native residents but born outside the U.S.:
Percentage of foreign born residents:
| Here: | 28.3% |
| Las Vegas: | 27.3% |
Percentage of people born in another U.S. state:
| Las Vegas Technology Center: | 45.5% |
| Las Vegas: | 49.8% |
Percentage of native residents but born outside the U.S.:
| Here: | 1.6% |
| city: | 1.9% |
Percentage of foreign born residents:
| Here: | 24.5% |
| Las Vegas: | 21.0% |
Owner-occupied
Renter-occupied

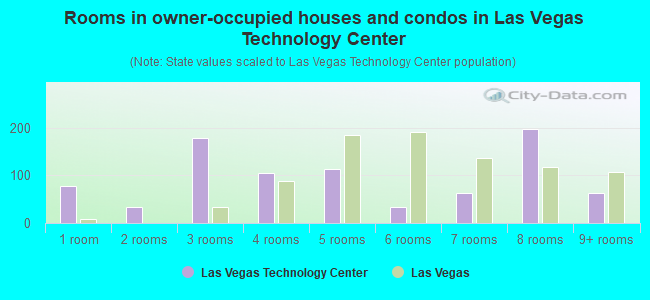
- Rooms in owner-occupied houses and condos in Las Vegas Technology Center
- 781 room
- 342 rooms
- 1783 rooms
- 1054 rooms
- 1135 rooms
- 336 rooms
- 627 rooms
- 1978 rooms
- 629+ rooms
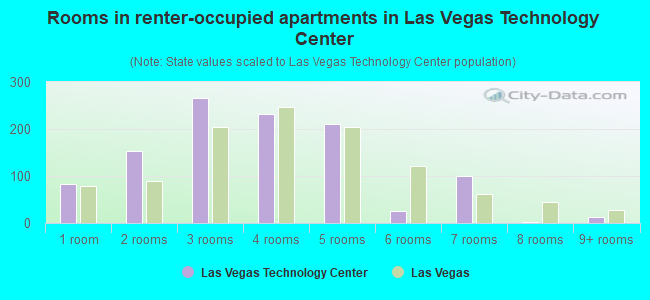
- Rooms in renter-occupied apartments in Las Vegas Technology Center
- 821 room
- 1532 rooms
- 2653 rooms
- 2314 rooms
- 2115 rooms
- 256 rooms
- 997 rooms
- 28 rooms
- 129+ rooms
Owner-occupied
Renter-occupied
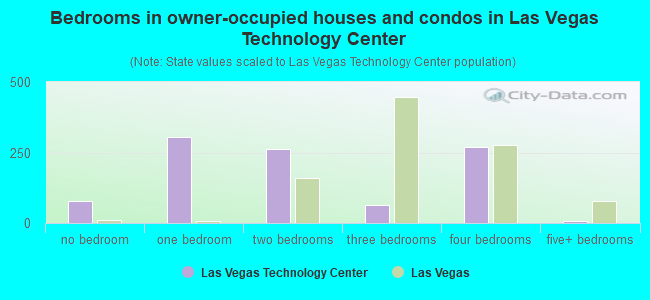
- Bedrooms in owner-occupied houses and condos in Las Vegas Technology Center
- 78no bedroom
- 3041 bedroom
- 2612 bedrooms
- 643 bedrooms
- 2684 bedrooms
- 65+ bedrooms
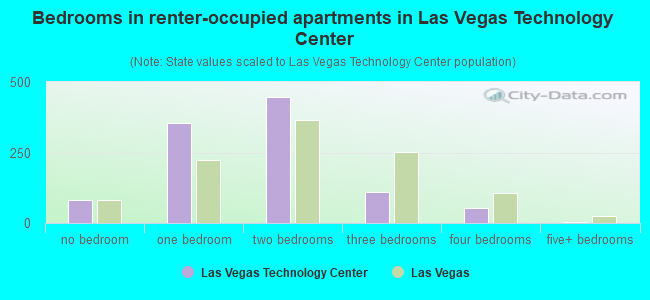
- Bedrooms in renter-occupied apartments in Las Vegas Technology Center
- 82no bedroom
- 3531 bedroom
- 4482 bedrooms
- 1103 bedrooms
- 524 bedrooms
- 55+ bedrooms
Average number of cars or other vehicles available in houses/condos:
Average number of cars or other vehicles available in apartments:
| This neighborhood: | 2.8 |
| Las Vegas: | 2.0 |
Average number of cars or other vehicles available in apartments:
| Here: | 1.2 |
| city: | 1.3 |
Percentage of units with a mortgage:
| Las Vegas Technology Center: | 59.8% |
| Las Vegas: | 69.3% |
Average estimated value of detached houses in 2022 (2.3% of all units):
| Las Vegas Technology Center: | $458,119 |
| Nevada: | $549,327 |
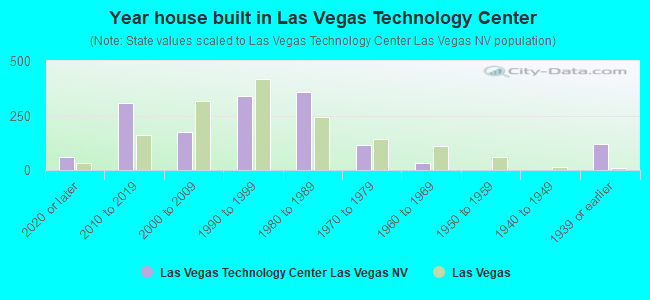
- Year house built in Las Vegas Technology Center
- 582020 or later
- 3082010 to 2019
- 1732000 to 2009
- 3381990 to 1999
- 3571980 to 1989
- 1161970 to 1979
- 321960 to 1969
- 01950 to 1959
- 01940 to 1949
- 1191939 or earlier
City-data.com crime index for city in 2020 (higher means more crime):
| City: | 280.7 |
| U.S. average: | 219.5 |
Travel time to work (commute)
![Travel time to work (commute)]()
- 10Less than 5 minutes
- 65 to 9 minutes
- 10310 to 14 minutes
- 17915 to 19 minutes
- 18220 to 24 minutes
- 15825 to 29 minutes
- 24130 to 34 minutes
- 1535 to 39 minutes
- 3840 to 44 minutes
- 5845 to 59 minutes
- 2860 to 89 minutes
- 4290 or more minutes

Means of transportation to work
![Means of transportation to work]()
- 73.0%1,035Drove a car alone
- 10.9%154Carpooled
- 7.5%106Bus
- 13.3%188Taxi
- 2.3%33Walked
- 4.9%69Other means
- 6.1%86Worked at home

Time leaving home to go to work
![Time leaving home to go to work]()
- 12612:00 a.m. to 4:59 a.m.
- 615:00 a.m. to 5:29 a.m.
- 635:30 a.m. to 5:59 a.m.
- 686:00 a.m. to 6:29 a.m.
- 616:30 a.m. to 6:59 a.m.
- 1737:00 a.m. to 7:29 a.m.
- 1177:30 a.m. to 7:59 a.m.
- 518:00 a.m. to 8:29 a.m.
- 248:30 a.m. to 8:59 a.m.
- 669:00 a.m. to 9:59 a.m.
- 1410:00 a.m. to 10:59 a.m.
- 1811:00 a.m. to 11:59 a.m.
- 11712:00 p.m. to 3:59 p.m.
- 1034:00 p.m. to 11:59 p.m.

Occupations of males:
- Percentage of males in business and financial operations occupations:
Here: 2.0% city: 3.6%
- Percentage of males in computer and mathematical occupations:
Here: 1.9% city: 3.4%
- Percentage of males in architecture and engineering occupations:
Here: 1.8% city: 1.8%
- Percentage of males in education, training, and library occupations:
Here: 3.7% city: 2.5%
- Percentage of males in arts, design, entertainment, sports, and media occupations:
Here: 11.9% city: 2.5%
- Percentage of males in service occupations:
Here: 16.2% city: 23.3%
- Percentage of males in sales and office occupations:
Here: 23.7% city: 16.6%
- Percentage of males in construction, extraction, and maintenance occupations:
Here: 18.4% city: 10.6%
- Percentage of males in production occupations:
Here: 4.3% city: 3.3%
- Percentage of males in transportation occupations:
Here: 11.5% city: 6.6%
- Percentage of males in material moving occupations:
Here: 4.0% city: 5.4%
Occupations of females:
- Percentage of females in management occupations (except farmers):
Here: 7.6% city: 8.5%
- Percentage of females in business and financial operations occupations:
Here: 14.0% city: 5.7%
- Percentage of females in community and social services occupations:
Here: 1.3% city: 1.9%
- Percentage of females in healthcare practitioners and technical occupations:
Here: 14.7% city: 7.4%
- Percentage of females in service occupations:
Here: 9.5% city: 26.5%
- Percentage of females in sales and office occupations:
Here: 53.1% city: 30.5%
Percentage of people 16-64 in Armed Forces:
| Las Vegas Technology Center: | 1.2% |
| Las Vegas: | 1.0% |
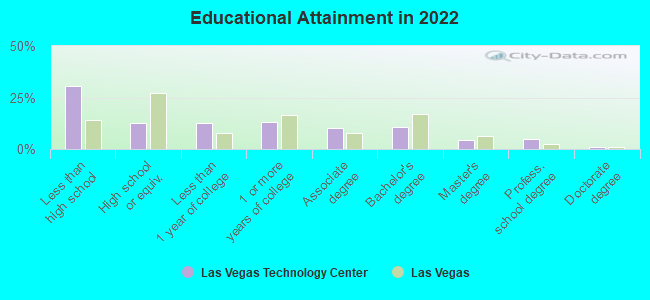
Education in this neighborhood (subdivision or community):
- Percentage of people 3 years and older in K-12 schools:
Las Vegas Technology Center: 36.4% Las Vegas: 17.4%
- Percentage of people 3 years and older in undergraduate colleges:
Las Vegas Technology Center: 4.8% Las Vegas: 4.2%
- Percentage of people 3 years and older in grad. or professional schools:
Las Vegas Technology Center: 3.2% Las Vegas: 1.0%
- Percentage of students K-12 enrolled in private schools:
Las Vegas Technology Center: 7.0% Las Vegas: 12.9%
Percentage of population below poverty level:
| Las Vegas Technology Center: | 24.1% |
| Las Vegas: | 14.1% |
Median year renter moved in (as recorded in 2022):
| Las Vegas Technology Center: | 2018 |
| Las Vegas: | 2020 |
Percentage of married-couple families with both working:
| Las Vegas Technology Center: | 92.0% |
| Las Vegas: | 62.0% |
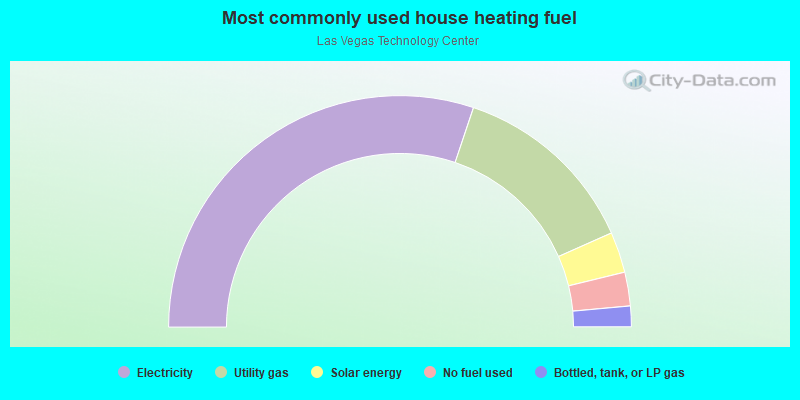
- 60.3%Electricity
- 26.4%Utility gas
- 5.7%Solar energy
- 4.7%No fuel used
- 2.9%Bottled, tank, or LP gas
Roads and streets:
N Tenaya Way
Length: 0.98 miles
Directions: N-S, SE-NW, SW-NE
Address range: 2476 to 3199
Directions: N-S, SE-NW, SW-NE
Address range: 2476 to 3199
W Cheyenne Ave
Length: 0.68 miles
Direction: E-W
Address range: 6908 to 7499
Direction: E-W
Address range: 6908 to 7499
Peak Dr
Length: 0.57 miles
Directions: E-W, SW-NE
Address range: 7200 to 7457
Directions: E-W, SW-NE
Address range: 7200 to 7457
Ronemus Dr (Ronemus)
Length: 0.48 miles
Direction: N-S
Address range: 2900 to 3199
Direction: N-S
Address range: 2900 to 3199
Box Canyon Dr
Length: 0.35 miles
Directions: E-W, N-S, SE-NW, SW-NE
Address range: 2400 to 2699
Directions: E-W, N-S, SE-NW, SW-NE
Address range: 2400 to 2699
Fire Mesa St
Length: 0.31 miles
Direction: N-S
Direction: N-S
Cathedral Rock Dr
Length: 0.29 miles
Directions: E-W, SW-NE
Address range: 7100 to 7299
Directions: E-W, SW-NE
Address range: 7100 to 7299
Crimson Canyon Dr
Length: 0.23 miles
Direction: N-S
Address range: 2600 to 2799
Direction: N-S
Address range: 2600 to 2799
Prairie Falcon Rd
Length: 0.20 miles
Direction: E-W
Address range: 7300 to 7399
Direction: E-W
Address range: 7300 to 7399
Cascade Valley Ct
Length: 0.12 miles
Direction: E-W
Address range: 7100 to 7199
Direction: E-W
Address range: 7100 to 7199
Ronemus Dr
Length: 0.10 miles
Direction: N-S
Direction: N-S
Bus Park Ct
Length: 0.10 miles
Directions: E-W, N-S, SW-NE
Address range: 2800 to 2899
Directions: E-W, N-S, SW-NE
Address range: 2800 to 2899