Levagood (Clark) neighborhood in Dearborn, Michigan (MI), 48128 detailed profile
Settings
X


Business Search - 14 Million verified businesses
Area: 0.295 square miles
Population: 6,092
Population density:
| Levagood (Clark): | 20,679 people per square mile |
| Dearborn: | 4,421 people per square mile |

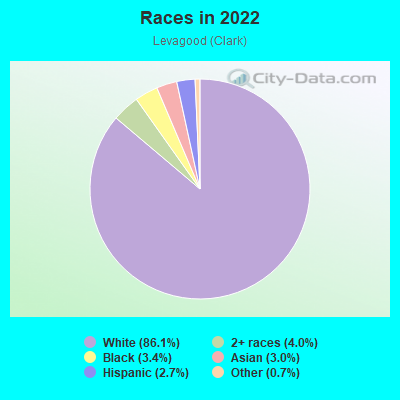
- 5,38286.1%White
- 2534.0%Two or more races
- 2143.4%Black
- 1853.0%Asian
- 1702.7%Hispanic or Latino
- 440.7%Some other race
- 10.02%American Indian

Median household income in 2022:
| Levagood (Clark): | $92,516 |
| Dearborn: | $58,467 |
Distribution of median household income
![Distribution of median household income]()
- 284Less than $10,000
- 225$10,000 to $19,999
- 70$20,000 to $29,999
- 215$30,000 to $39,999
- 356$40,000 to $49,999
- 51$50,000 to $59,999
- 131$60,000 to $74,999
- 177$75,000 to $99,999
- 337$100,000 to $124,999
- 273$125,000 to $149,999
- 287$150,000 to $199,999
- 148$200,000 or more

Distribution of owner-occupied house/condo value
![Distribution of owner-occupied house/condo value]()
- 218Less than $50,000
- 26$50,000 to $99,999
- 107$100,000 to $149,999
- 411$150,000 to $199,999
- 616$200,000 to $249,999
- 321$250,000 to $299,999
- 242$300,000 to $399,999
- 68$400,000 to $499,999
- 49$500,000 to $749,999
- 55$750,000 to $999,999
- 49$1,000,000 or more

Distribution of rent paid by renters
![Distribution of rent paid by renters]()
- 84$200 to $299
- 15$300 to $399
- 19$400 to $499
- 15$500 to $599
- 20$600 to $699
- 43$700 to $799
- 126$800 to $899
- 13$900 to $999
- 132$1,000 to $1,249
- 135$1,250 to $1,499
- 34$1,500 to $1,999

| Males: | 2,827 |
| Females: | 3,265 |
Males:
| This neighborhood: | 34.6 years |
| Whole city: | 30.8 years |
| This neighborhood: | 36.0 years |
| Whole city: | 31.0 years |
Average household size:
| Levagood (Clark): | 14.0 people |
| Dearborn: | 2.9 people |
Percentage of family households:
| Levagood (Clark): | 55.6% |
| Dearborn: | 49.7% |
| Here: | 59.4% |
| Dearborn: | 51.0% |
Percentage of married-couple families with children (among all households):
| Levagood (Clark): | 32.0% |
| Dearborn: | 31.2% |
Percentage of single-mother households (among all households):
| Levagood (Clark): | 2.7% |
| Dearborn: | 2.3% |
Percentage of never married males 15 years old and over:
Percentage of never married females 15 years old and over:
| Levagood (Clark): | 12.9% |
| Dearborn: | 17.3% |
Percentage of never married females 15 years old and over:
| Levagood (Clark): | 16.0% |
| city: | 15.8% |
Percentage of people that speak English not well or not at all:
| Levagood (Clark): | 6.9% |
| Dearborn: | 10.0% |
Percentage of people born in this state:
Percentage of people born in another U.S. state:
Percentage of native residents but born outside the U.S.:
Percentage of foreign born residents:
| Here: | 67.0% |
| Dearborn: | 57.7% |
Percentage of people born in another U.S. state:
| Levagood (Clark): | 10.8% |
| Dearborn: | 8.8% |
Percentage of native residents but born outside the U.S.:
| Here: | 1.0% |
| city: | 2.6% |
Percentage of foreign born residents:
| Here: | 21.2% |
| Dearborn: | 30.9% |
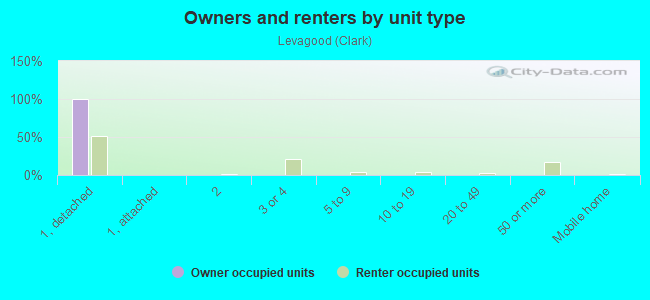
Owner-occupied
Renter-occupied

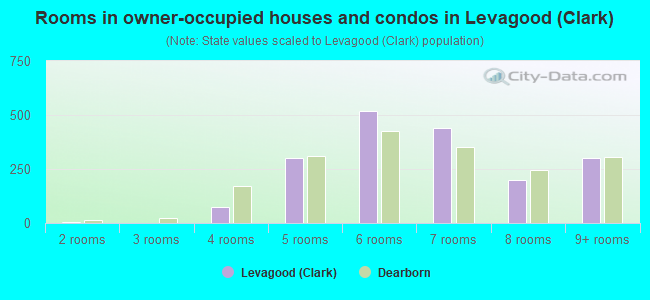
- Rooms in owner-occupied houses and condos in Levagood <
> - 01 room
- 52 rooms
- 23 rooms
- 744 rooms
- 3025 rooms
- 5206 rooms
- 4417 rooms
- 1998 rooms
- 3039+ rooms
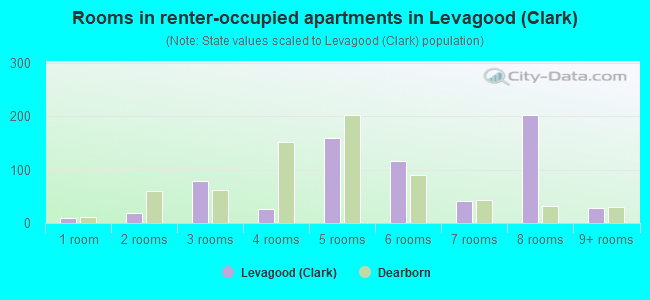
- Rooms in renter-occupied apartments in Levagood <
> - 91 room
- 192 rooms
- 793 rooms
- 274 rooms
- 1595 rooms
- 1166 rooms
- 417 rooms
- 2028 rooms
- 289+ rooms
Owner-occupied
Renter-occupied
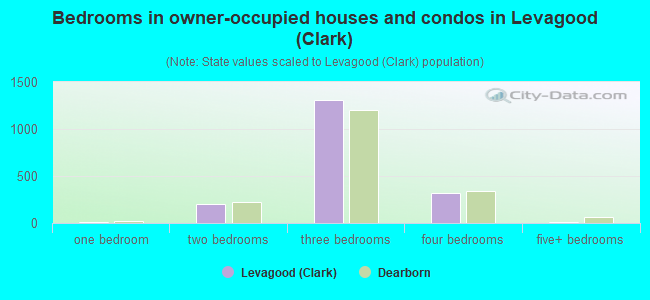
- Bedrooms in owner-occupied houses and condos in Levagood <
> - 0no bedroom
- 131 bedroom
- 2072 bedrooms
- 1,3073 bedrooms
- 3234 bedrooms
- 115+ bedrooms
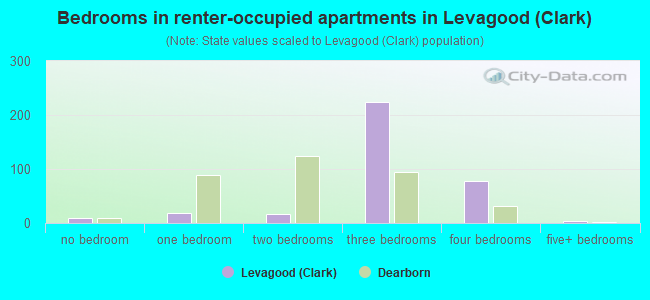
- Bedrooms in renter-occupied apartments in Levagood <
> - 9no bedroom
- 191 bedroom
- 162 bedrooms
- 2243 bedrooms
- 784 bedrooms
- 35+ bedrooms
Average number of cars or other vehicles available in houses/condos:
Average number of cars or other vehicles available in apartments:
| This neighborhood: | 2.0 |
| Dearborn: | 1.8 |
Average number of cars or other vehicles available in apartments:
| Here: | 4.6 |
| city: | 1.2 |
Percentage of units with a mortgage:
| Levagood (Clark): | 63.5% |
| Dearborn: | 53.2% |
Average estimated value of detached houses in 2022 (99.6% of all units):
| Levagood (Clark): | $270,610 |
| Dearborn: | $222,556 |
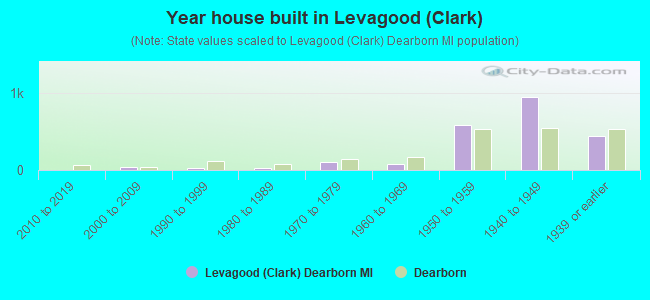
- Year house built in Levagood <
> - 02020 or later
- 52010 to 2019
- 332000 to 2009
- 271990 to 1999
- 251980 to 1989
- 1011970 to 1979
- 741960 to 1969
- 5801950 to 1959
- 9451940 to 1949
- 4471939 or earlier
City-data.com crime index for city in 2020 (higher means more crime):
| City: | 176.4 |
| U.S. average: | 219.5 |
Travel time to work (commute)
![Travel time to work (commute)]()
- 11Less than 5 minutes
- 1055 to 9 minutes
- 25810 to 14 minutes
- 15115 to 19 minutes
- 22220 to 24 minutes
- 5725 to 29 minutes
- 7030 to 34 minutes
- 2735 to 39 minutes
- 940 to 44 minutes
- 6445 to 59 minutes
- 360 to 89 minutes
- 790 or more minutes

Means of transportation to work
![Means of transportation to work]()
- 73.4%2,033Drove a car alone
- 12.8%356Carpooled
- 0.1%3Bus
- 1.6%43Bicycle
- 1.7%48Walked
- 0.3%9Other means
- 11.9%331Worked at home

Time leaving home to go to work
![Time leaving home to go to work]()
- 3612:00 a.m. to 4:59 a.m.
- 225:00 a.m. to 5:29 a.m.
- 1025:30 a.m. to 5:59 a.m.
- 756:00 a.m. to 6:29 a.m.
- 506:30 a.m. to 6:59 a.m.
- 817:00 a.m. to 7:29 a.m.
- 1207:30 a.m. to 7:59 a.m.
- 998:00 a.m. to 8:29 a.m.
- 1128:30 a.m. to 8:59 a.m.
- 619:00 a.m. to 9:59 a.m.
- 6210:00 a.m. to 10:59 a.m.
- 3911:00 a.m. to 11:59 a.m.
- 6912:00 p.m. to 3:59 p.m.
- 404:00 p.m. to 11:59 p.m.

Occupations of males:
- Percentage of males in management occupations (except farmers):
Here: 10.1% city: 7.5%
- Percentage of males in business and financial operations occupations:
Here: 7.7% city: 4.8%
- Percentage of males in computer and mathematical occupations:
Here: 5.9% city: 5.7%
- Percentage of males in architecture and engineering occupations:
Here: 10.9% city: 7.5%
- Percentage of males in life, physical, and social science occupations:
Here: 2.8% city: 1.0%
- Percentage of males in legal occupations:
Here: 1.8% city: 1.0%
- Percentage of males in education, training, and library occupations:
Here: 3.0% city: 3.8%
- Percentage of males in healthcare practitioners and technical occupations:
Here: 14.2% city: 4.4%
- Percentage of males in service occupations:
Here: 9.8% city: 13.8%
- Percentage of males in sales and office occupations:
Here: 13.2% city: 15.1%
- Percentage of males in farming, fishing, and forestry occupations:
Here: 1.5% city: 0.2%
- Percentage of males in construction, extraction, and maintenance occupations:
Here: 2.1% city: 5.1%
- Percentage of males in production occupations:
Here: 5.9% city: 8.5%
- Percentage of males in transportation occupations:
Here: 3.6% city: 9.3%
- Percentage of males in material moving occupations:
Here: 3.8% city: 5.8%
Occupations of females:
- Percentage of females in management occupations (except farmers):
Here: 6.7% city: 7.3%
- Percentage of females in business and financial operations occupations:
Here: 13.0% city: 6.9%
- Percentage of females in legal occupations:
Here: 4.2% city: 0.8%
- Percentage of females in education, training, and library occupations:
Here: 6.9% city: 11.1%
- Percentage of females in arts, design, entertainment, sports, and media occupations:
Here: 2.4% city: 1.6%
- Percentage of females in healthcare practitioners and technical occupations:
Here: 15.8% city: 15.7%
- Percentage of females in service occupations:
Here: 25.9% city: 19.0%
- Percentage of females in sales and office occupations:
Here: 22.3% city: 23.6%
- Percentage of females in material moving occupations:
Here: 1.7% city: 1.5%
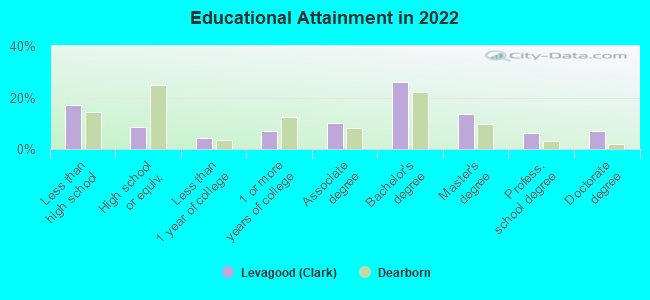
Education in this neighborhood (subdivision or community):
- Percentage of people 3 years and older in K-12 schools:
Levagood (Clark): 22.1% Dearborn: 26.0%
- Percentage of people 3 years and older in undergraduate colleges:
Levagood (Clark): 3.4% Dearborn: 5.6%
- Percentage of people 3 years and older in grad. or professional schools:
Levagood (Clark): 9.7% Dearborn: 2.2%
- Percentage of students K-12 enrolled in private schools:
Levagood (Clark): 42.1% Dearborn: 6.8%
Percentage of population below poverty level:
| Levagood (Clark): | 14.8% |
| Dearborn: | 25.4% |
Median year owner moved in (as recorded in 2022):
| Levagood (Clark): | 2007 |
| Dearborn: | 2013 |
Percentage of married-couple families with both working:
| Levagood (Clark): | 57.0% |
| Dearborn: | 37.3% |
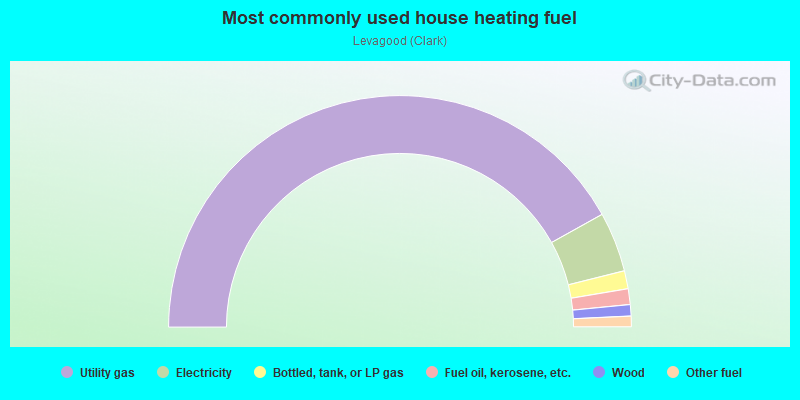
- 83.9%Utility gas
- 8.4%Electricity
- 2.5%Bottled, tank, or LP gas
- 2.2%Fuel oil, kerosene, etc.
- 1.6%Wood
- 1.5%Other fuel
Highways in this neighborhood:
Ford Rd (State Hwy 153)
Length: 0.67 miles
Direction: E-W
Address range: 23301 to 23499
Direction: E-W
Address range: 23301 to 23499
Roads and streets:
W Outer Dr
Length: 1.59 miles
Directions: N-S, SE-NW, SW-NE
Address range: 18601 to 18649
Directions: N-S, SE-NW, SW-NE
Address range: 18601 to 18649
Sheridan St
Length: 0.71 miles
Direction: E-W
Address range: 22500 to 23499
Direction: E-W
Address range: 22500 to 23499
N York St
Length: 0.66 miles
Direction: N-S
Address range: 800 to 2299
Direction: N-S
Address range: 800 to 2299
Buckingham St
Length: 0.64 miles
Direction: E-W
Address range: 22700 to 23499
Direction: E-W
Address range: 22700 to 23499
N Martha St
Length: 0.64 miles
Direction: N-S
Address range: 800 to 2299
Direction: N-S
Address range: 800 to 2299
Wilson Ave
Length: 0.63 miles
Direction: E-W
Address range: 22700 to 23499
Direction: E-W
Address range: 22700 to 23499
Hollander St
Length: 0.48 miles
Direction: E-W
Address range: 22700 to 23399
Direction: E-W
Address range: 22700 to 23399
Lawrence Ave
Length: 0.44 miles
Direction: E-W
Address range: 22700 to 23499
Direction: E-W
Address range: 22700 to 23499
Arlington St
Length: 0.43 miles
Direction: E-W
Address range: 22700 to 23199
Direction: E-W
Address range: 22700 to 23199
Oak St
Length: 0.43 miles
Directions: E-W, SW-NE
Address range: 22700 to 23399
Directions: E-W, SW-NE
Address range: 22700 to 23399
Melborn St
Length: 0.42 miles
Direction: N-S
Address range: 800 to 2299
Direction: N-S
Address range: 800 to 2299
N Elizabeth St
Length: 0.40 miles
Direction: N-S
Address range: 800 to 2299
Direction: N-S
Address range: 800 to 2299
Edward St
Length: 0.37 miles
Direction: E-W
Address range: 22700 to 23399
Direction: E-W
Address range: 22700 to 23399
Doxtator St
Length: 0.33 miles
Direction: E-W
Address range: 22700 to 23499
Direction: E-W
Address range: 22700 to 23499
N Military St
Length: 0.18 miles
Direction: SE-NW
Address range: 745 to 899
Direction: SE-NW
Address range: 745 to 899
Sussex St
Length: 0.17 miles
Direction: N-S
Address range: 800 to 1099
Direction: N-S
Address range: 800 to 1099
Ina St
Length: 0.17 miles
Direction: N-S
Address range: 800 to 1099
Direction: N-S
Address range: 800 to 1099
Heinze St
Length: 0.15 miles
Direction: E-W
Address range: 22700 to 23199
Direction: E-W
Address range: 22700 to 23199
Cobb St
Length: 0.11 miles
Direction: E-W
Address range: 22700 to 22799
Direction: E-W
Address range: 22700 to 22799
Hollander
Length: 0.02 miles
Direction: E-W
Direction: E-W
Buckingham
Length: 0.02 miles
Direction: E-W
Direction: E-W
Edward
Length: 0.02 miles
Direction: E-W
Direction: E-W
Kensington
Length: 0.01 miles
Direction: E-W
Direction: E-W