Loma Verde neighborhood in San Jose, California (CA), 95117 detailed profile
Settings
X

Business Search - 14 Million verified businesses
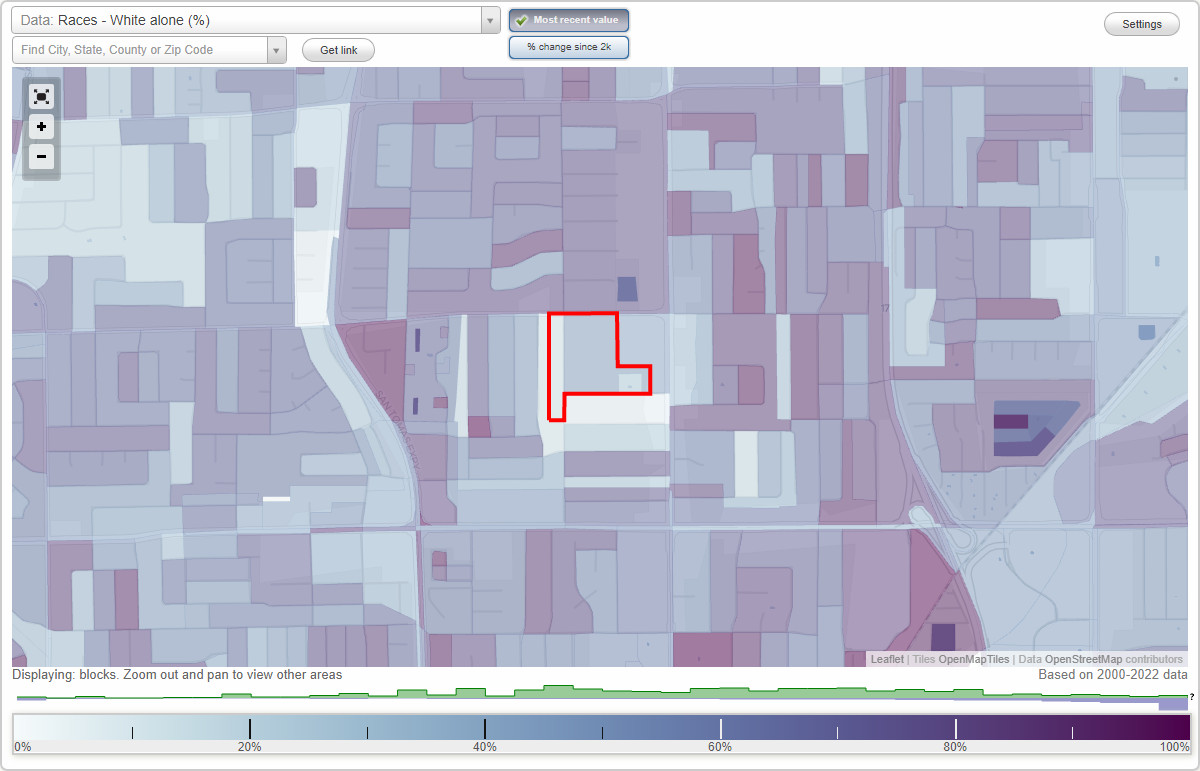
Area: 0.038 square miles
Population: 309
Population density:
| Loma Verde: | 8,157 people per square mile |
| San Jose: | 5,554 people per square mile |

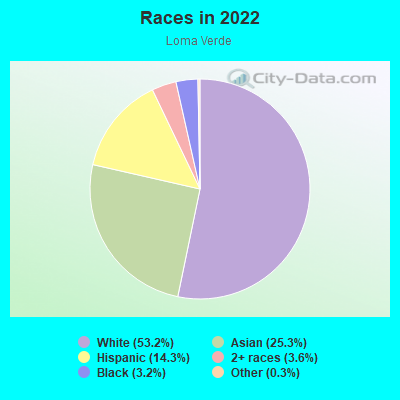
- 16453.2%White
- 7825.3%Asian
- 4414.3%Hispanic or Latino
- 113.6%Two or more races
- 103.2%Black
- 10.3%Some other race
Median household income in 2022:
| Loma Verde: | $198,407 |
| San Jose: | $133,835 |
Distribution of median household income
![Distribution of median household income]()
- 5Less than $10,000
- 5$10,000 to $19,999
- 2$20,000 to $29,999
- 8$30,000 to $39,999
- 5$40,000 to $49,999
- 6$50,000 to $59,999
- 7$60,000 to $74,999
- 13$75,000 to $99,999
- 9$100,000 to $124,999
- 4$125,000 to $149,999
- 18$150,000 to $199,999
- 65$200,000 or more

Distribution of owner-occupied house/condo value
![Distribution of owner-occupied house/condo value]()
- 3Less than $50,000
- 2$100,000 to $149,999
- 1$500,000 to $749,999
- 7$750,000 to $999,999
- 72$1,000,000 or more

Distribution of rent paid by renters
![Distribution of rent paid by renters]()
- 1$300 to $399
- 2$1,250 to $1,499
- 5$1,500 to $1,999
- 43$2,000 or more

Median rent in 2022:
| Loma Verde: | $2,840 |
| San Jose: | $2,001 |
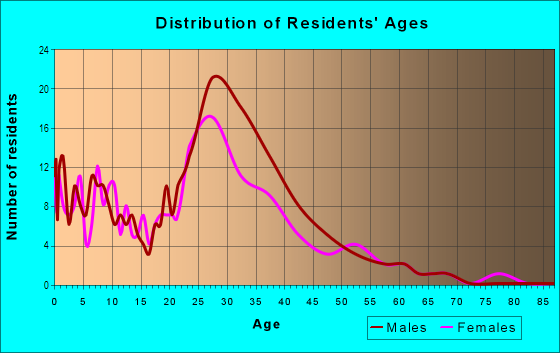
| Males: | 161 |
| Females: | 147 |
Males:
| This neighborhood: | 42.4 years |
| Whole city: | 37.6 years |
| This neighborhood: | 39.9 years |
| Whole city: | 39.1 years |
Average household size:
| Loma Verde: | 2.7 people |
| San Jose: | 2.9 people |
Percentage of family households:
| Loma Verde: | 68.4% |
| San Jose: | 49.9% |
| Here: | 71.6% |
| San Jose: | 53.0% |
Percentage of married-couple families with children (among all households):
| Loma Verde: | 33.0% |
| San Jose: | 25.8% |
Percentage of single-mother households (among all households):
| Loma Verde: | 1.0% |
| San Jose: | 5.2% |
Percentage of never married males 15 years old and over:
Percentage of never married females 15 years old and over:
| Loma Verde: | 15.8% |
| San Jose: | 20.9% |
Percentage of never married females 15 years old and over:
| Loma Verde: | 14.1% |
| city: | 16.7% |
Percentage of people that speak English not well or not at all:
| Loma Verde: | 0.0% |
| San Jose: | 11.4% |
Percentage of people born in this state:
Percentage of people born in another U.S. state:
Percentage of native residents but born outside the U.S.:
Percentage of foreign born residents:
| Here: | 50.9% |
| San Jose: | 46.1% |
Percentage of people born in another U.S. state:
| Loma Verde: | 16.1% |
| San Jose: | 10.4% |
Percentage of native residents but born outside the U.S.:
| Here: | 1.4% |
| city: | 1.7% |
Percentage of foreign born residents:
| Here: | 31.6% |
| San Jose: | 41.8% |
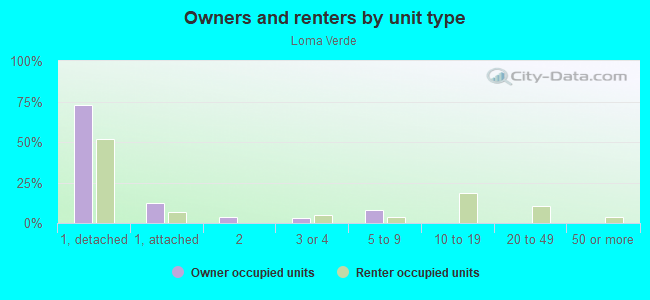
Owner-occupied
Renter-occupied

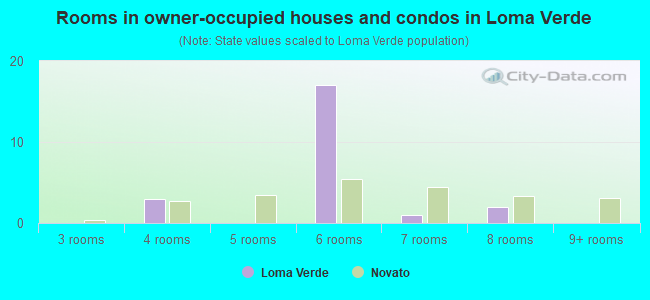
- Rooms in owner-occupied houses and condos in Loma Verde
- 01 room
- 02 rooms
- 73 rooms
- 14 rooms
- 85 rooms
- 226 rooms
- 147 rooms
- 98 rooms
- 129+ rooms
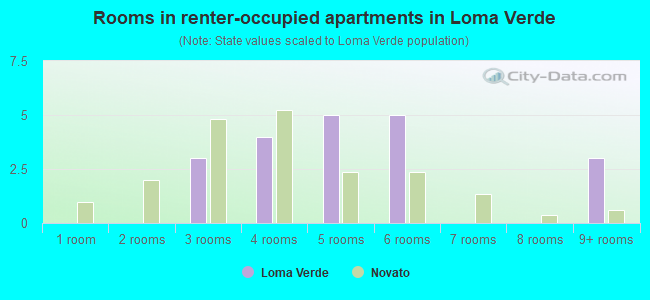
- Rooms in renter-occupied apartments in Loma Verde
- 71 room
- 82 rooms
- 113 rooms
- 194 rooms
- 85 rooms
- 36 rooms
- 57 rooms
- 48 rooms
- 09+ rooms
Owner-occupied
Renter-occupied
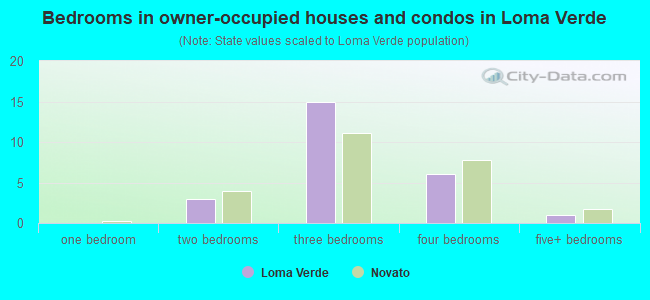
- Bedrooms in owner-occupied houses and condos in Loma Verde
- 0no bedroom
- 21 bedroom
- 72 bedrooms
- 383 bedrooms
- 284 bedrooms
- 35+ bedrooms
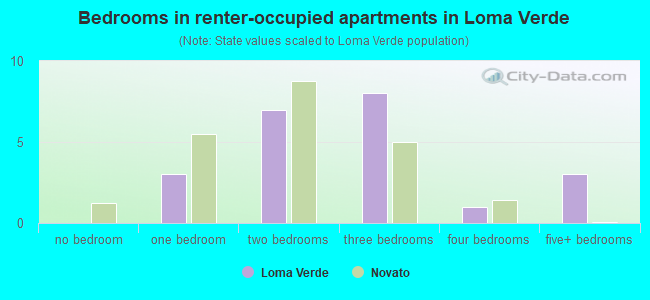
- Bedrooms in renter-occupied apartments in Loma Verde
- 7no bedroom
- 81 bedroom
- 242 bedrooms
- 103 bedrooms
- 34 bedrooms
- 25+ bedrooms
Average number of cars or other vehicles available in houses/condos:
Average number of cars or other vehicles available in apartments:
| This neighborhood: | 2.4 |
| San Jose: | 2.3 |
Average number of cars or other vehicles available in apartments:
| Here: | 2.2 |
| city: | 1.6 |
Percentage of units with a mortgage:
| Loma Verde: | 77.1% |
| San Jose: | 66.9% |
Housing prices:
- Average estimated value of detached houses in 2022 (73.9% of all units):
Loma Verde: $1,657,197 San Jose: $1,532,815
- Average estimated value of townhouses or other attached units in 2022 (20.0% of all units):
This neighborhood: $982,513 city: $1,024,857
- Average estimated '22 value of housing units in 5-or-more-unit structures (19.1% of all units):
Loma Verde: $940,551 San Jose: $791,954
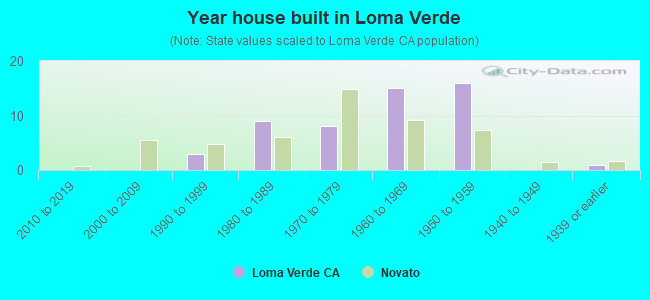
- Year house built in Loma Verde
- 152020 or later
- 42010 to 2019
- 32000 to 2009
- 21990 to 1999
- 161980 to 1989
- 81970 to 1979
- 441960 to 1969
- 381950 to 1959
- 41940 to 1949
- 01939 or earlier
City-data.com crime index for city in 2020 (higher means more crime):
| City: | 268.4 |
| U.S. average: | 219.5 |
Travel time to work (commute)
![Travel time to work (commute)]()
- 135 to 9 minutes
- 3110 to 14 minutes
- 3615 to 19 minutes
- 4020 to 24 minutes
- 1125 to 29 minutes
- 2530 to 34 minutes
- 435 to 39 minutes
- 1240 to 44 minutes
- 1545 to 59 minutes
- 960 to 89 minutes
- 190 or more minutes

Means of transportation to work
![Means of transportation to work]()
- 65.7%108Drove a car alone
- 6.1%10Carpooled
- 0.6%1Subway or elevated rail
- 1.2%2Motorcycle
- 1.2%2Bicycle
- 3.0%5Walked
- 25.6%42Worked at home

Time leaving home to go to work
![Time leaving home to go to work]()
- 612:00 a.m. to 4:59 a.m.
- 85:00 a.m. to 5:29 a.m.
- 126:00 a.m. to 6:29 a.m.
- 96:30 a.m. to 6:59 a.m.
- 417:00 a.m. to 7:29 a.m.
- 217:30 a.m. to 7:59 a.m.
- 178:00 a.m. to 8:29 a.m.
- 88:30 a.m. to 8:59 a.m.
- 259:00 a.m. to 9:59 a.m.
- 2310:00 a.m. to 10:59 a.m.
- 511:00 a.m. to 11:59 a.m.
- 1612:00 p.m. to 3:59 p.m.
- 14:00 p.m. to 11:59 p.m.

Occupations of males:
- Percentage of males in management occupations (except farmers):
Here: 15.9% city: 13.0%
- Percentage of males in business and financial operations occupations:
Here: 13.0% city: 4.6%
- Percentage of males in computer and mathematical occupations:
Here: 7.9% city: 13.6%
- Percentage of males in architecture and engineering occupations:
Here: 11.2% city: 10.2%
- Percentage of males in life, physical, and social science occupations:
Here: 2.1% city: 1.1%
- Percentage of males in community and social services occupations:
Here: 1.3% city: 0.8%
- Percentage of males in education, training, and library occupations:
Here: 2.8% city: 2.8%
- Percentage of males in arts, design, entertainment, sports, and media occupations:
Here: 2.5% city: 1.8%
- Percentage of males in healthcare practitioners and technical occupations:
Here: 1.8% city: 2.0%
- Percentage of males in service occupations:
Here: 6.0% city: 12.7%
- Percentage of males in sales and office occupations:
Here: 12.9% city: 12.8%
- Percentage of males in construction, extraction, and maintenance occupations:
Here: 20.4% city: 7.8%
- Percentage of males in production occupations:
Here: 1.1% city: 5.5%
- Percentage of males in transportation occupations:
Here: 1.0% city: 3.6%
- Percentage of males in material moving occupations:
Here: 1.6% city: 3.1%
Occupations of females:
- Percentage of females in management occupations (except farmers):
Here: 15.1% city: 11.0%
- Percentage of females in business and financial operations occupations:
Here: 18.5% city: 8.6%
- Percentage of females in computer and mathematical occupations:
Here: 4.0% city: 5.4%
- Percentage of females in architecture and engineering occupations:
Here: 1.2% city: 2.8%
- Percentage of females in life, physical, and social science occupations:
Here: 4.5% city: 1.7%
- Percentage of females in community and social services occupations:
Here: 4.0% city: 1.8%
- Percentage of females in legal occupations:
Here: 2.3% city: 1.3%
- Percentage of females in education, training, and library occupations:
Here: 15.9% city: 8.1%
- Percentage of females in arts, design, entertainment, sports, and media occupations:
Here: 3.4% city: 2.0%
- Percentage of females in healthcare practitioners and technical occupations:
Here: 3.3% city: 6.8%
- Percentage of females in service occupations:
Here: 19.0% city: 21.7%
- Percentage of females in sales and office occupations:
Here: 21.5% city: 22.0%
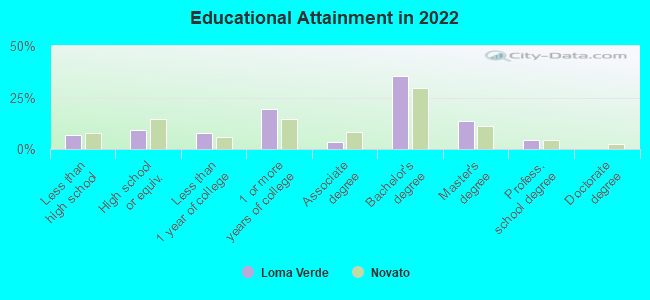
Education in this neighborhood (subdivision or community):
- Percentage of people 3 years and older in K-12 schools:
Loma Verde: 16.3% San Jose: 16.1%
- Percentage of people 3 years and older in undergraduate colleges:
Loma Verde: 7.5% San Jose: 6.5%
- Percentage of people 3 years and older in grad. or professional schools:
Loma Verde: 1.0% San Jose: 2.0%
- Percentage of students K-12 enrolled in private schools:
Loma Verde: 20.0% San Jose: 14.9%
Percentage of population below poverty level:
| Loma Verde: | 3.1% |
| San Jose: | 9.0% |
Median year owner moved in (as recorded in 2022):
Median year renter moved in (as recorded in 2022):
| Loma Verde: | 2001 |
| San Jose: | 2008 |
Median year renter moved in (as recorded in 2022):
| Loma Verde: | 2018 |
| San Jose: | 2020 |
Percentage of married-couple families with both working:
| Loma Verde: | 74.1% |
| San Jose: | 72.5% |
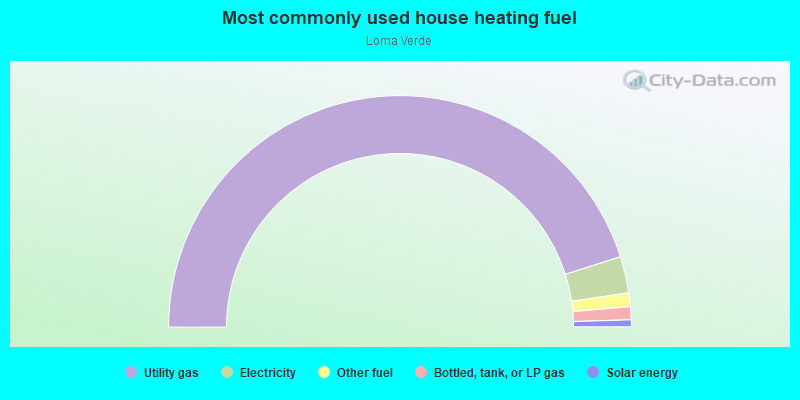
- 68.1%Utility gas
- 21.9%Electricity
- 5.7%Bottled, tank, or LP gas
- 4.2%Solar energy
Roads and streets:
Loma Verde Dr
Length: 0.23 miles
Direction: E-W
Address range: 3152 to 3299
Direction: E-W
Address range: 3152 to 3299