Lone Star Industrial Park neighborhood in Dallas, Texas (TX), 75208, 75211, 75212 detailed profile
Settings
X


Business Search - 14 Million verified businesses
Area: 1.376 square miles
Population: 3,400
Population density:
| Lone Star Industrial Park: | 2,471 people per square mile |
| Dallas: | 3,794 people per square mile |

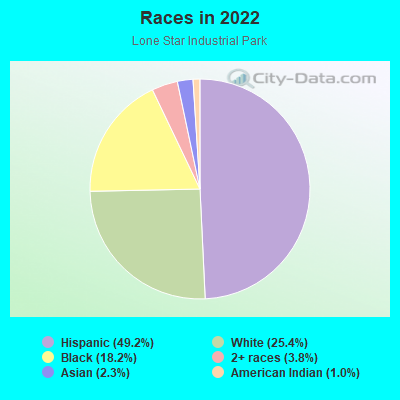
- 1,72249.2%Hispanic or Latino
- 88925.4%White
- 63618.2%Black
- 1343.8%Two or more races
- 802.3%Asian
- 361.0%American Indian
Distribution of median household income
![Distribution of median household income]()
- 248Less than $10,000
- 472$10,000 to $19,999
- 182$20,000 to $29,999
- 200$30,000 to $39,999
- 95$40,000 to $49,999
- 47$50,000 to $59,999
- 110$60,000 to $74,999
- 55$75,000 to $99,999
- 138$100,000 to $124,999
- 42$125,000 to $149,999
- 113$150,000 to $199,999
- 440$200,000 or more

Distribution of owner-occupied house/condo value
![Distribution of owner-occupied house/condo value]()
- 89Less than $50,000
- 88$50,000 to $99,999
- 188$100,000 to $149,999
- 47$150,000 to $199,999
- 91$200,000 to $249,999
- 65$250,000 to $299,999
- 218$300,000 to $399,999
- 48$400,000 to $499,999
- 144$500,000 to $749,999
- 135$750,000 to $999,999
- 646$1,000,000 or more

Distribution of rent paid by renters
![Distribution of rent paid by renters]()
- 444$200 to $299
- 37$300 to $399
- 147$400 to $499
- 157$500 to $599
- 113$600 to $699
- 12$700 to $799
- 222$800 to $899
- 39$900 to $999
- 278$1,000 to $1,249
- 15$1,250 to $1,499
- 179$1,500 to $1,999
- 155$2,000 or more

Median rent in 2022:
| Lone Star Industrial Park: | $448 |
| Dallas: | $1,208 |
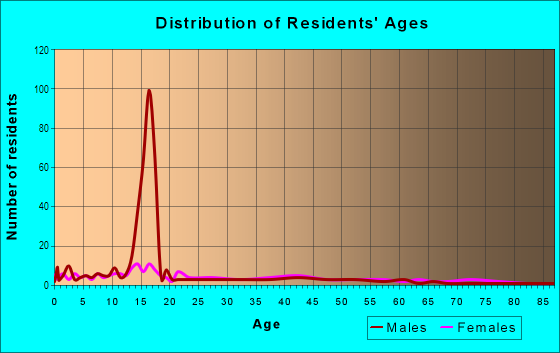
| Males: | 2,029 |
| Females: | 1,371 |
Males:
| This neighborhood: | 30.1 years |
| Whole city: | 32.8 years |
| This neighborhood: | 29.4 years |
| Whole city: | 33.4 years |
Average household size:
| Lone Star Industrial Park: | 3.7 people |
| Dallas: | 2.4 people |
Percentage of family households:
| Lone Star Industrial Park: | 27.7% |
| Dallas: | 42.6% |
| Here: | 27.2% |
| Dallas: | 33.8% |
Percentage of married-couple families with children (among all households):
| Lone Star Industrial Park: | 23.9% |
| Dallas: | 24.8% |
Percentage of single-mother households (among all households):
| Lone Star Industrial Park: | 24.6% |
| Dallas: | 13.3% |
Percentage of never married males 15 years old and over:
Percentage of never married females 15 years old and over:
| Lone Star Industrial Park: | 26.3% |
| Dallas: | 22.1% |
Percentage of never married females 15 years old and over:
| Lone Star Industrial Park: | 10.8% |
| city: | 21.8% |
Percentage of people that speak English not well or not at all:
| Lone Star Industrial Park: | 11.5% |
| Dallas: | 10.7% |
Percentage of people born in this state:
Percentage of people born in another U.S. state:
Percentage of native residents but born outside the U.S.:
Percentage of foreign born residents:
| Here: | 54.9% |
| Dallas: | 52.8% |
Percentage of people born in another U.S. state:
| Lone Star Industrial Park: | 19.1% |
| Dallas: | 22.0% |
Percentage of native residents but born outside the U.S.:
| Here: | 1.4% |
| city: | 1.3% |
Percentage of foreign born residents:
| Here: | 24.6% |
| Dallas: | 23.9% |
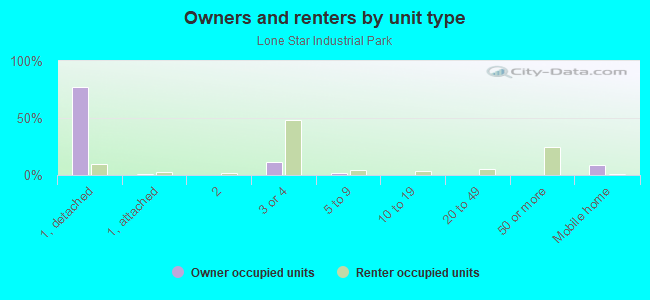
Owner-occupied
Renter-occupied

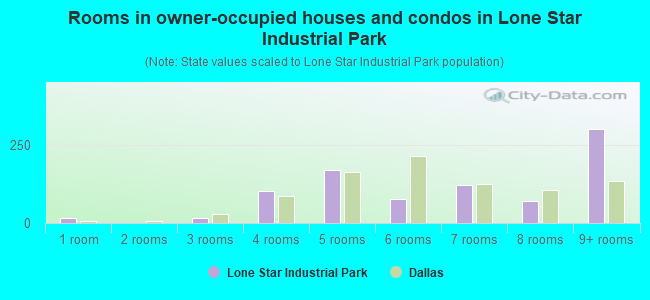
- Rooms in owner-occupied houses and condos in Lone Star Industrial Park
- 161 room
- 02 rooms
- 153 rooms
- 1044 rooms
- 1715 rooms
- 776 rooms
- 1247 rooms
- 708 rooms
- 3039+ rooms
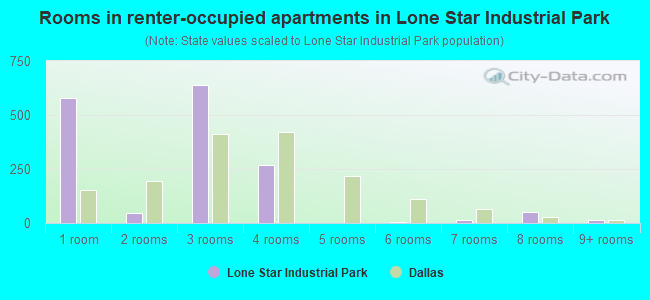
- Rooms in renter-occupied apartments in Lone Star Industrial Park
- 5801 room
- 442 rooms
- 6393 rooms
- 2694 rooms
- 15 rooms
- 66 rooms
- 147 rooms
- 538 rooms
- 159+ rooms
Owner-occupied
Renter-occupied
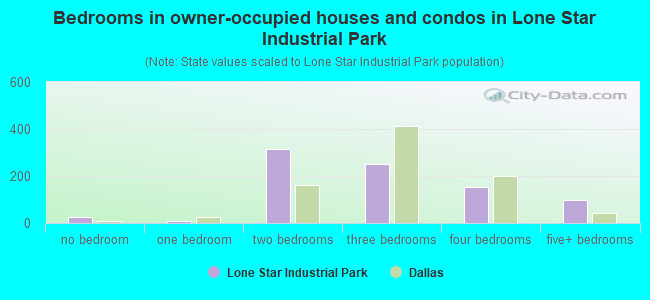
- Bedrooms in owner-occupied houses and condos in Lone Star Industrial Park
- 24no bedroom
- 91 bedroom
- 3132 bedrooms
- 2493 bedrooms
- 1544 bedrooms
- 975+ bedrooms
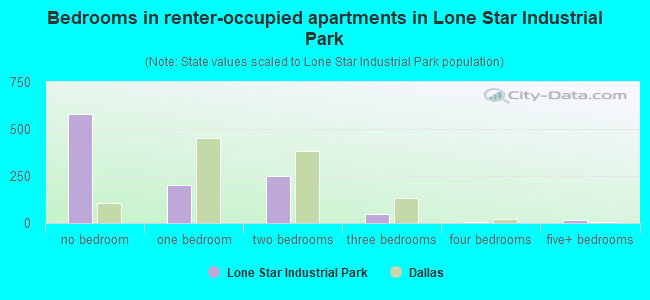
- Bedrooms in renter-occupied apartments in Lone Star Industrial Park
- 580no bedroom
- 2001 bedroom
- 2482 bedrooms
- 483 bedrooms
- 64 bedrooms
- 165+ bedrooms
Average number of cars or other vehicles available in houses/condos:
Average number of cars or other vehicles available in apartments:
| This neighborhood: | 2.3 |
| Dallas: | 2.1 |
Average number of cars or other vehicles available in apartments:
| Here: | 0.7 |
| city: | 1.3 |
Percentage of units with a mortgage:
| Lone Star Industrial Park: | 58.5% |
| Dallas: | 53.9% |
Average estimated value of detached houses in 2022 (41.0% of all units):
| Lone Star Industrial Park: | $874,518 |
| Dallas: | $423,859 |
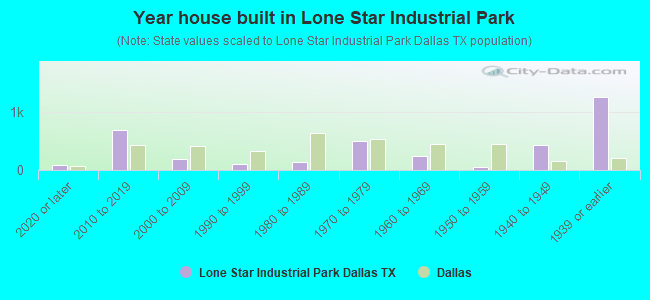
- Year house built in Lone Star Industrial Park
- 902020 or later
- 6962010 to 2019
- 1872000 to 2009
- 1011990 to 1999
- 1381980 to 1989
- 4941970 to 1979
- 2501960 to 1969
- 511950 to 1959
- 4321940 to 1949
- 1,2571939 or earlier
City-data.com crime index for city in 2020 (higher means more crime):
| City: | 439.5 |
| U.S. average: | 219.5 |
Travel time to work (commute)
![Travel time to work (commute)]()
- 52Less than 5 minutes
- 3515 to 9 minutes
- 65110 to 14 minutes
- 38615 to 19 minutes
- 26720 to 24 minutes
- 8625 to 29 minutes
- 30930 to 34 minutes
- 12035 to 39 minutes
- 6540 to 44 minutes
- 9245 to 59 minutes
- 16260 to 89 minutes
- 6790 or more minutes

Means of transportation to work
![Means of transportation to work]()
- 67.8%1,213Drove a car alone
- 3.4%60Carpooled
- 5.0%90Bus
- 0.8%15Long-distance train or commuter rail
- 2.0%36Motorcycle
- 3.0%53Bicycle
- 4.1%73Walked
- 0.3%6Other means
- 23.0%412Worked at home

Time leaving home to go to work
![Time leaving home to go to work]()
- 26112:00 a.m. to 4:59 a.m.
- 665:00 a.m. to 5:29 a.m.
- 495:30 a.m. to 5:59 a.m.
- 2916:00 a.m. to 6:29 a.m.
- 1506:30 a.m. to 6:59 a.m.
- 3107:00 a.m. to 7:29 a.m.
- 1847:30 a.m. to 7:59 a.m.
- 3058:00 a.m. to 8:29 a.m.
- 1488:30 a.m. to 8:59 a.m.
- 2919:00 a.m. to 9:59 a.m.
- 8410:00 a.m. to 10:59 a.m.
- 2311:00 a.m. to 11:59 a.m.
- 18412:00 p.m. to 3:59 p.m.
- 2884:00 p.m. to 11:59 p.m.

Occupations of males:
- Percentage of males in management occupations (except farmers):
Here: 8.8% city: 10.9%
- Percentage of males in business and financial operations occupations:
Here: 13.7% city: 7.3%
- Percentage of males in computer and mathematical occupations:
Here: 7.1% city: 4.7%
- Percentage of males in architecture and engineering occupations:
Here: 1.2% city: 2.8%
- Percentage of males in life, physical, and social science occupations:
Here: 4.1% city: 0.7%
- Percentage of males in community and social services occupations:
Here: 6.9% city: 0.8%
- Percentage of males in legal occupations:
Here: 1.9% city: 1.8%
- Percentage of males in education, training, and library occupations:
Here: 5.4% city: 2.3%
- Percentage of males in arts, design, entertainment, sports, and media occupations:
Here: 3.8% city: 2.2%
- Percentage of males in healthcare practitioners and technical occupations:
Here: 5.0% city: 2.7%
- Percentage of males in sales and office occupations:
Here: 9.8% city: 14.9%
- Percentage of males in farming, fishing, and forestry occupations:
Here: 8.4% city: 0.2%
- Percentage of males in construction, extraction, and maintenance occupations:
Here: 16.9% city: 15.2%
- Percentage of males in production occupations:
Here: 8.9% city: 5.0%
- Percentage of males in transportation occupations:
Here: 6.7% city: 5.9%
- Percentage of males in material moving occupations:
Here: 8.6% city: 6.2%
Occupations of females:
- Percentage of females in management occupations (except farmers):
Here: 28.2% city: 9.6%
- Percentage of females in computer and mathematical occupations:
Here: 2.1% city: 2.0%
- Percentage of females in architecture and engineering occupations:
Here: 1.3% city: 0.6%
- Percentage of females in life, physical, and social science occupations:
Here: 6.8% city: 0.8%
- Percentage of females in community and social services occupations:
Here: 12.2% city: 1.8%
- Percentage of females in legal occupations:
Here: 4.3% city: 1.8%
- Percentage of females in education, training, and library occupations:
Here: 7.2% city: 7.1%
- Percentage of females in arts, design, entertainment, sports, and media occupations:
Here: 3.3% city: 2.9%
- Percentage of females in healthcare practitioners and technical occupations:
Here: 8.1% city: 7.7%
- Percentage of females in service occupations:
Here: 31.8% city: 20.5%
- Percentage of females in sales and office occupations:
Here: 40.3% city: 27.7%
- Percentage of females in farming, fishing, and forestry occupations:
Here: 1.9% city: 0.1%
- Percentage of females in construction, extraction, and maintenance occupations:
Here: 2.3% city: 0.6%
- Percentage of females in transportation occupations:
Here: 1.5% city: 1.4%
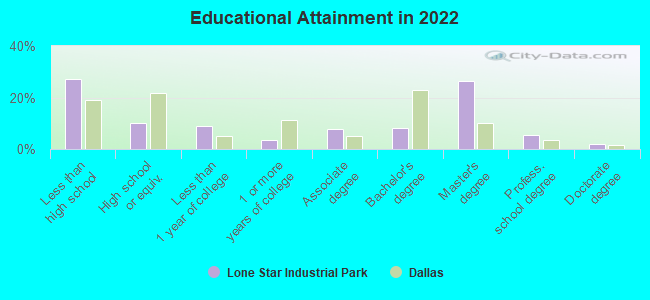
Education in this neighborhood (subdivision or community):
- Percentage of people 3 years and older in K-12 schools:
Lone Star Industrial Park: 21.4% Dallas: 17.3%
- Percentage of people 3 years and older in undergraduate colleges:
Lone Star Industrial Park: 10.5% Dallas: 4.1%
- Percentage of people 3 years and older in grad. or professional schools:
Lone Star Industrial Park: 3.5% Dallas: 1.7%
- Percentage of students K-12 enrolled in private schools:
Lone Star Industrial Park: 33.5% Dallas: 10.8%
Percentage of population below poverty level:
| Lone Star Industrial Park: | 11.9% |
| Dallas: | 17.8% |
Median year owner moved in (as recorded in 2022):
Median year renter moved in (as recorded in 2022):
| Lone Star Industrial Park: | 2009 |
| Dallas: | 2010 |
Median year renter moved in (as recorded in 2022):
| Lone Star Industrial Park: | 2016 |
| Dallas: | 2020 |
Percentage of married-couple families with both working:
| Lone Star Industrial Park: | 152.1% |
| Dallas: | 58.3% |
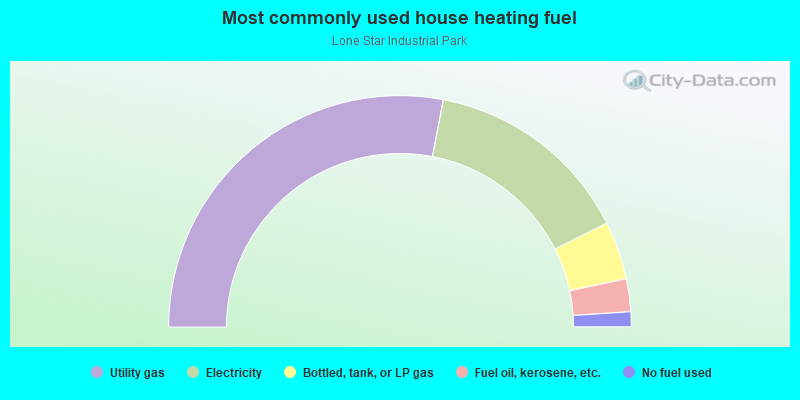
- 56.0%Utility gas
- 29.2%Electricity
- 8.1%Bottled, tank, or LP gas
- 4.6%Fuel oil, kerosene, etc.
- 2.1%No fuel used
Limited-access highways (interstate or state) in this neighborhood:
I- 30
Length: 2.40 miles
Direction: E-W
Direction: E-W
Roads and streets:
Dallas-Ft Worth Tpke
Length: 2.81 miles
Directions: E-W, N-S, SE-NW, SW-NE
Address range: 2150 to 3298
Directions: E-W, N-S, SE-NW, SW-NE
Address range: 2150 to 3298
W Commerce St
Length: 1.57 miles
Directions: E-W, N-S, SE-NW, SW-NE
Address range: 2032 to 3299
Directions: E-W, N-S, SE-NW, SW-NE
Address range: 2032 to 3299
N Hampton Rd
Length: 1.37 miles
Direction: N-S
Address range: 1438 to 2999
Direction: N-S
Address range: 1438 to 2999
Lone Star Dr
Length: 1.34 miles
Directions: E-W, N-S, SE-NW, SW-NE
Address range: 1800 to 2799
Directions: E-W, N-S, SE-NW, SW-NE
Address range: 1800 to 2799
Singleton Blvd
Length: 1.19 miles
Direction: E-W
Address range: 2100 to 3299
Direction: E-W
Address range: 2100 to 3299
N Westmoreland Rd
Length: 1.05 miles
Direction: N-S
Address range: 1702 to 3299
Direction: N-S
Address range: 1702 to 3299
Toronto St
Length: 0.91 miles
Directions: E-W, SE-NW
Address range: 2400 to 3299
Directions: E-W, SE-NW
Address range: 2400 to 3299
Terre Colony Ct
Length: 0.81 miles
Directions: E-W, N-S, SE-NW, SW-NE
Address range: 1400 to 1799
Directions: E-W, N-S, SE-NW, SW-NE
Address range: 1400 to 1799
Postal Way
Length: 0.48 miles
Directions: N-S, SE-NW, SW-NE
Address range: 1900 to 2299
Directions: N-S, SE-NW, SW-NE
Address range: 1900 to 2299
Akron St
Length: 0.42 miles
Directions: E-W, N-S, SW-NE
Address range: 2000 to 2899
Directions: E-W, N-S, SW-NE
Address range: 2000 to 2899
Dennison St
Length: 0.30 miles
Direction: E-W
Direction: E-W
Muncie Ave
Length: 0.29 miles
Direction: E-W
Address range: 2100 to 2399
Direction: E-W
Address range: 2100 to 2399
Ivanhoe Ln
Length: 0.26 miles
Direction: N-S
Address range: 1900 to 2499
Direction: N-S
Address range: 1900 to 2499
Manila Rd
Length: 0.26 miles
Direction: N-S
Address range: 2600 to 2999
Direction: N-S
Address range: 2600 to 2999
Fishtrap Rd
Length: 0.25 miles
Directions: N-S, SE-NW, SW-NE
Address range: 2700 to 3099
Directions: N-S, SE-NW, SW-NE
Address range: 2700 to 3099
Kingbridge St
Length: 0.23 miles
Direction: N-S
Address range: 2700 to 3248
Direction: N-S
Address range: 2700 to 3248
Coombsville Ave
Length: 0.23 miles
Direction: N-S
Address range: 2700 to 2999
Direction: N-S
Address range: 2700 to 2999
Brundrette St
Length: 0.22 miles
Direction: N-S
Address range: 1900 to 2499
Direction: N-S
Address range: 1900 to 2499
Rupert St
Length: 0.20 miles
Directions: N-S, SE-NW
Directions: N-S, SE-NW
Pointer St
Length: 0.19 miles
Direction: N-S
Address range: 3000 to 3099
Direction: N-S
Address range: 3000 to 3099
Delhi St
Length: 0.16 miles
Direction: N-S
Address range: 3000 to 3099
Direction: N-S
Address range: 3000 to 3099
Bedford St
Length: 0.16 miles
Direction: E-W
Address range: 2800 to 2899
Direction: E-W
Address range: 2800 to 2899
Westerfeld Ave
Length: 0.12 miles
Direction: N-S
Address range: 2800 to 2999
Direction: N-S
Address range: 2800 to 2999
Baker St
Length: 0.12 miles
Direction: N-S
Direction: N-S
Panoramic Cir
Length: 0.10 miles
Direction: N-S
Address range: 2100 to 2199
Direction: N-S
Address range: 2100 to 2199
Goldman St
Length: 0.09 miles
Direction: N-S
Address range: 2700 to 2799
Direction: N-S
Address range: 2700 to 2799
Meyersville Ave
Length: 0.09 miles
Direction: N-S
Address range: 2700 to 2799
Direction: N-S
Address range: 2700 to 2799
Boynton St
Length: 0.08 miles
Direction: N-S
Address range: 2700 to 2799
Direction: N-S
Address range: 2700 to 2799
Pollard St
Length: 0.08 miles
Direction: E-W
Address range: 2000 to 2071
Direction: E-W
Address range: 2000 to 2071
Ithaca St
Length: 0.08 miles
Directions: E-W, SE-NW, SW-NE
Address range: 2000 to 2051
Directions: E-W, SE-NW, SW-NE
Address range: 2000 to 2051
Lone Star
Length: 0.08 miles
Direction: N-S
Direction: N-S
Dallas Fort Worth Tpke
Length: 0.04 miles
Direction: E-W
Direction: E-W
Railroad features:
Texas and Pacific Rlwy
Length: 1.35 miles
Direction: E-W
Direction: E-W
T and P RR
Length: 1.12 miles
Direction: E-W
Direction: E-W
G C and S F R R
Length: 0.96 miles
Directions: E-W, SE-NW, SW-NE
Directions: E-W, SE-NW, SW-NE
at and Sf Rlwy
Length: 0.24 miles
Directions: E-W, SW-NE
Directions: E-W, SW-NE