Marion neighborhood in Jersey City, New Jersey (NJ), 07306 detailed profile
Settings
X


Business Search - 14 Million verified businesses
Area: 0.726 square miles
Population: 20,060
Population density:
| Marion: | 27,619 people per square mile |
| Jersey City: | 19,218 people per square mile |

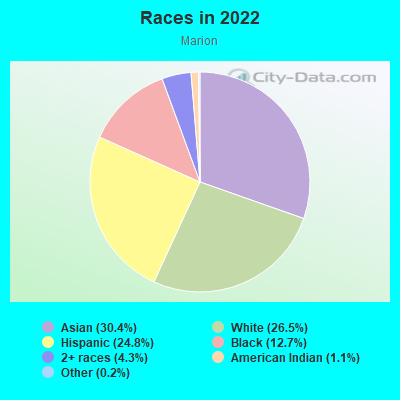
- 6,18530.4%Asian
- 5,38126.5%White
- 5,04124.8%Hispanic or Latino
- 2,58112.7%Black
- 8644.3%Two or more races
- 2331.1%American Indian
- 400.2%Some other race
Distribution of median household income
![Distribution of median household income]()
- 704Less than $10,000
- 875$10,000 to $19,999
- 1,034$20,000 to $29,999
- 1,317$30,000 to $39,999
- 1,379$40,000 to $49,999
- 542$50,000 to $59,999
- 540$60,000 to $74,999
- 1,097$75,000 to $99,999
- 680$100,000 to $124,999
- 459$125,000 to $149,999
- 875$150,000 to $199,999
- 674$200,000 or more

Distribution of owner-occupied house/condo value
![Distribution of owner-occupied house/condo value]()
- 897Less than $50,000
- 69$50,000 to $99,999
- 220$100,000 to $149,999
- 190$150,000 to $199,999
- 539$200,000 to $249,999
- 536$250,000 to $299,999
- 477$300,000 to $399,999
- 486$400,000 to $499,999
- 661$500,000 to $749,999
- 212$750,000 to $999,999
- 1,285$1,000,000 or more

Distribution of rent paid by renters
![Distribution of rent paid by renters]()
- 109Less than $100
- 1,005$100 to $199
- 637$200 to $299
- 396$300 to $399
- 1,026$400 to $499
- 720$500 to $599
- 553$600 to $699
- 1,369$700 to $799
- 412$800 to $899
- 980$900 to $999
- 1,378$1,000 to $1,249
- 1,036$1,250 to $1,499
- 1,379$1,500 to $1,999
- 1,481$2,000 or more

Median rent in 2022:
| Marion: | $1,375 |
| Jersey City: | $1,738 |
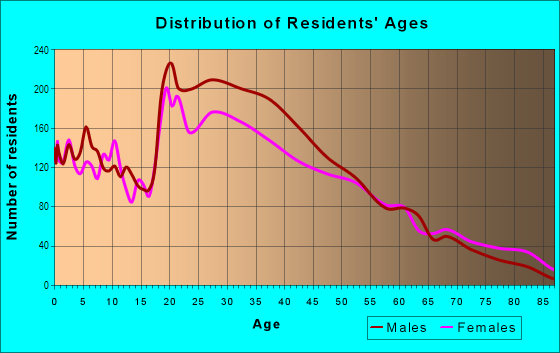
| Males: | 10,149 |
| Females: | 9,911 |
Males:
| This neighborhood: | 32.9 years |
| Whole city: | 34.1 years |
| This neighborhood: | 35.6 years |
| Whole city: | 36.2 years |
Average household size:
| Marion: | 2.5 people |
| Jersey City: | 2.2 people |
Percentage of family households:
| Marion: | 44.2% |
| Jersey City: | 39.8% |
| Here: | 38.6% |
| Jersey City: | 34.2% |
Percentage of married-couple families with children (among all households):
| Marion: | 26.6% |
| Jersey City: | 29.4% |
Percentage of single-mother households (among all households):
| Marion: | 9.4% |
| Jersey City: | 13.3% |
Percentage of never married males 15 years old and over:
Percentage of never married females 15 years old and over:
| Marion: | 23.5% |
| Jersey City: | 23.6% |
Percentage of never married females 15 years old and over:
| Marion: | 23.6% |
| city: | 22.6% |
Percentage of people that speak English not well or not at all:
| Marion: | 8.8% |
| Jersey City: | 7.2% |
Percentage of people born in this state:
Percentage of people born in another U.S. state:
Percentage of native residents but born outside the U.S.:
Percentage of foreign born residents:
| Here: | 28.7% |
| Jersey City: | 34.5% |
Percentage of people born in another U.S. state:
| Marion: | 17.6% |
| Jersey City: | 22.1% |
Percentage of native residents but born outside the U.S.:
| Here: | 4.3% |
| city: | 3.8% |
Percentage of foreign born residents:
| Here: | 49.4% |
| Jersey City: | 39.6% |
Owner-occupied
Renter-occupied

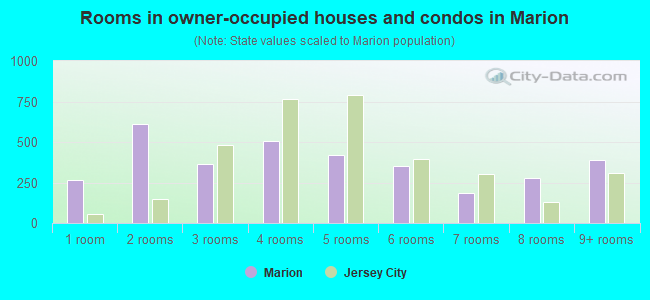
- Rooms in owner-occupied houses and condos in Marion
- 2661 room
- 6132 rooms
- 3653 rooms
- 5074 rooms
- 4175 rooms
- 3516 rooms
- 1867 rooms
- 2758 rooms
- 3879+ rooms
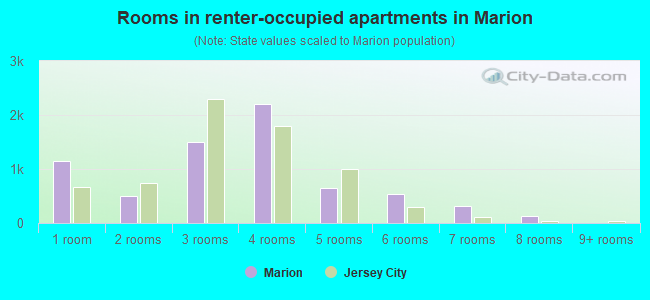
- Rooms in renter-occupied apartments in Marion
- 1,1391 room
- 4932 rooms
- 1,4923 rooms
- 2,2074 rooms
- 6485 rooms
- 5346 rooms
- 3087 rooms
- 1388 rooms
- 69+ rooms
Owner-occupied
Renter-occupied
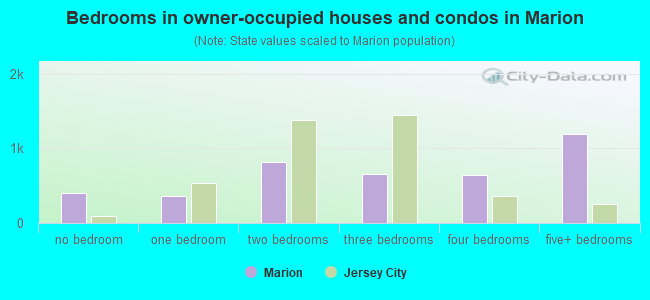
- Bedrooms in owner-occupied houses and condos in Marion
- 401no bedroom
- 3611 bedroom
- 8112 bedrooms
- 6513 bedrooms
- 6424 bedrooms
- 1,1915+ bedrooms
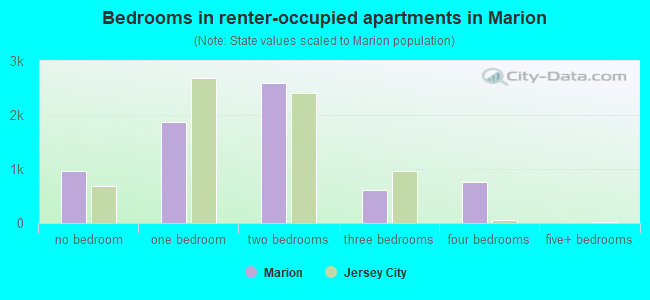
- Bedrooms in renter-occupied apartments in Marion
- 960no bedroom
- 1,8701 bedroom
- 2,5992 bedrooms
- 6153 bedrooms
- 7554 bedrooms
- 65+ bedrooms
Average number of cars or other vehicles available in houses/condos:
Average number of cars or other vehicles available in apartments:
| This neighborhood: | 1.0 |
| Jersey City: | 1.3 |
Average number of cars or other vehicles available in apartments:
| Here: | 0.5 |
| city: | 0.6 |
Percentage of units with a mortgage:
| Marion: | 58.2% |
| Jersey City: | 69.4% |
Housing prices:
- Average estimated value of detached houses in 2022 (9.9% of all units):
Marion: $548,750 Jersey City: $732,576
- Average estimated value of housing units in 2-unit structures in 2022 (13.1% of all units):
This neighborhood: $622,035 Jersey City: $571,976
- Average estimated '22 value of housing units in 5-or-more-unit structures (16.1% of all units):
Marion: $430,608 Jersey City: $666,445
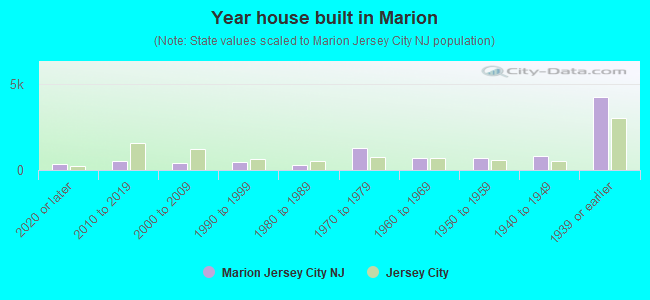
- Year house built in Marion
- 3212020 or later
- 5162010 to 2019
- 4172000 to 2009
- 4521990 to 1999
- 2811980 to 1989
- 1,2641970 to 1979
- 7181960 to 1969
- 7051950 to 1959
- 7871940 to 1949
- 4,2021939 or earlier
City-data.com crime index for city in 2020 (higher means more crime):
| City: | 198.8 |
| U.S. average: | 219.5 |
Travel time to work (commute)
![Travel time to work (commute)]()
- 219Less than 5 minutes
- 2515 to 9 minutes
- 82610 to 14 minutes
- 95315 to 19 minutes
- 90620 to 24 minutes
- 34725 to 29 minutes
- 1,21030 to 34 minutes
- 27035 to 39 minutes
- 54040 to 44 minutes
- 1,56845 to 59 minutes
- 1,64360 to 89 minutes
- 48290 or more minutes

Means of transportation to work
![Means of transportation to work]()
- 18.5%1,697Drove a car alone
- 9.8%897Carpooled
- 11.7%1,073Bus
- 24.1%2,220Subway or elevated rail
- 13.2%1,210Long-distance train or commuter rail
- 5.2%475Light rail, streetcar or trolley
- 11.1%1,023Taxi
- 2.6%240Bicycle
- 7.3%673Walked
- 2.9%271Other means
- 15.7%1,447Worked at home

Time leaving home to go to work
![Time leaving home to go to work]()
- 38712:00 a.m. to 4:59 a.m.
- 2275:00 a.m. to 5:29 a.m.
- 2515:30 a.m. to 5:59 a.m.
- 3526:00 a.m. to 6:29 a.m.
- 5236:30 a.m. to 6:59 a.m.
- 9197:00 a.m. to 7:29 a.m.
- 7477:30 a.m. to 7:59 a.m.
- 2,2158:00 a.m. to 8:29 a.m.
- 6648:30 a.m. to 8:59 a.m.
- 1,1029:00 a.m. to 9:59 a.m.
- 40910:00 a.m. to 10:59 a.m.
- 23211:00 a.m. to 11:59 a.m.
- 96012:00 p.m. to 3:59 p.m.
- 7454:00 p.m. to 11:59 p.m.

Occupations of males:
- Percentage of males in management occupations (except farmers):
Here: 7.1% city: 12.9%
- Percentage of males in business and financial operations occupations:
Here: 6.9% city: 9.9%
- Percentage of males in computer and mathematical occupations:
Here: 16.0% city: 13.5%
- Percentage of males in architecture and engineering occupations:
Here: 3.1% city: 3.7%
- Percentage of males in legal occupations:
Here: 4.2% city: 1.8%
- Percentage of males in education, training, and library occupations:
Here: 3.5% city: 3.6%
- Percentage of males in arts, design, entertainment, sports, and media occupations:
Here: 8.5% city: 3.5%
- Percentage of males in healthcare practitioners and technical occupations:
Here: 2.2% city: 2.6%
- Percentage of males in service occupations:
Here: 14.1% city: 10.4%
- Percentage of males in sales and office occupations:
Here: 12.8% city: 13.4%
- Percentage of males in construction, extraction, and maintenance occupations:
Here: 4.2% city: 5.6%
- Percentage of males in production occupations:
Here: 1.7% city: 2.8%
- Percentage of males in transportation occupations:
Here: 7.4% city: 7.2%
- Percentage of males in material moving occupations:
Here: 6.6% city: 4.2%
Occupations of females:
- Percentage of females in management occupations (except farmers):
Here: 5.2% city: 11.5%
- Percentage of females in business and financial operations occupations:
Here: 5.4% city: 11.7%
- Percentage of females in computer and mathematical occupations:
Here: 4.3% city: 5.3%
- Percentage of females in life, physical, and social science occupations:
Here: 1.6% city: 1.1%
- Percentage of females in legal occupations:
Here: 1.7% city: 2.6%
- Percentage of females in education, training, and library occupations:
Here: 18.9% city: 8.3%
- Percentage of females in arts, design, entertainment, sports, and media occupations:
Here: 1.4% city: 4.9%
- Percentage of females in healthcare practitioners and technical occupations:
Here: 5.8% city: 6.5%
- Percentage of females in service occupations:
Here: 18.7% city: 17.9%
- Percentage of females in sales and office occupations:
Here: 26.3% city: 21.2%
- Percentage of females in production occupations:
Here: 6.8% city: 2.7%
- Percentage of females in material moving occupations:
Here: 2.7% city: 1.8%
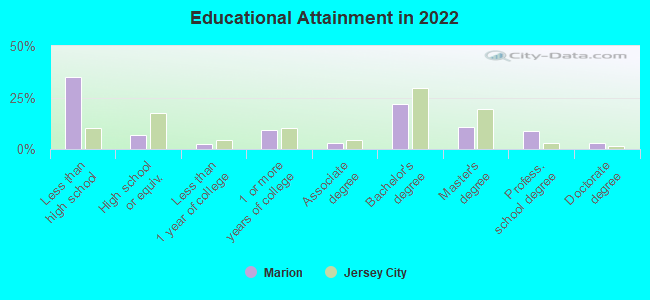
Education in this neighborhood (subdivision or community):
- Percentage of people 3 years and older in K-12 schools:
Marion: 22.7% Jersey City: 12.9%
- Percentage of people 3 years and older in undergraduate colleges:
Marion: 11.3% Jersey City: 4.5%
- Percentage of people 3 years and older in grad. or professional schools:
Marion: 3.8% Jersey City: 2.2%
- Percentage of students K-12 enrolled in private schools:
Marion: 47.5% Jersey City: 10.8%
Percentage of population below poverty level:
| Marion: | 20.5% |
| Jersey City: | 12.8% |
Median year owner moved in (as recorded in 2022):
Median year renter moved in (as recorded in 2022):
| Marion: | 2004 |
| Jersey City: | 2010 |
Median year renter moved in (as recorded in 2022):
| Marion: | 2014 |
| Jersey City: | 2019 |
Percentage of married-couple families with both working:
| Marion: | 50.0% |
| Jersey City: | 63.9% |
- 64.1%Utility gas
- 17.8%Electricity
- 6.0%Other fuel
- 4.3%Fuel oil, kerosene, etc.
- 4.1%Bottled, tank, or LP gas
- 3.7%No fuel used
Highways in this neighborhood:
John F Kennedy Blvd (State Rte 501)
Length: 0.65 miles
Directions: E-W, SW-NE
Address range: 43 to 2877
Directions: E-W, SW-NE
Address range: 43 to 2877
State Rte 440 (State Rte 1, US Hwy 1 (Trk), US Hwy 9 (Trk))
Length: 0.39 miles
Directions: E-W, SW-NE
Directions: E-W, SW-NE
US Hwy 9 (US Hwy 1, Pulaski Skwy)
Length: 0.15 miles
Direction: E-W
Direction: E-W
Journal Sq (John F Kennedy Blvd, State Rte 501)
Length: 0.03 miles
Direction: SW-NE
Address range: 1 to 80
Direction: SW-NE
Address range: 1 to 80
Roads and streets:
Sip Ave
Length: 1.19 miles
Direction: E-W
Address range: 113 to 411
Direction: E-W
Address range: 113 to 411
Co Rd 641 (W Side Ave)
Length: 0.67 miles
Direction: SW-NE
Address range: 822 to 1299
Direction: SW-NE
Address range: 822 to 1299
Broadway
Length: 0.64 miles
Directions: E-W, SE-NW
Address range: 1 to 399
Directions: E-W, SE-NW
Address range: 1 to 399
Glenwood Ave
Length: 0.55 miles
Directions: E-W, SE-NW
Address range: 1 to 199
Directions: E-W, SE-NW
Address range: 1 to 199
Highland Ave
Length: 0.52 miles
Direction: E-W
Address range: 1 to 199
Direction: E-W
Address range: 1 to 199
Pavonia Ave
Length: 0.52 miles
Direction: E-W
Address range: 800 to 960
Direction: E-W
Address range: 800 to 960
Logan Ave
Length: 0.47 miles
Direction: E-W
Address range: 1 to 199
Direction: E-W
Address range: 1 to 199
Van Wagenen Ave
Length: 0.47 miles
Direction: SW-NE
Address range: 1 to 176
Direction: SW-NE
Address range: 1 to 176
Corbin Ave
Length: 0.44 miles
Direction: SW-NE
Address range: 1 to 176
Direction: SW-NE
Address range: 1 to 176
Romaine Ave
Length: 0.42 miles
Directions: N-S, SW-NE
Address range: 1 to 160
Directions: N-S, SW-NE
Address range: 1 to 160
Garrison Ave
Length: 0.42 miles
Direction: SW-NE
Address range: 1 to 169
Direction: SW-NE
Address range: 1 to 169
Bergen Ave (Co Rd 625)
Length: 0.41 miles
Directions: E-W, N-S, SW-NE
Address range: 766 to 928
Directions: E-W, N-S, SW-NE
Address range: 766 to 928
Dekalb Ave
Length: 0.40 miles
Directions: E-W, SE-NW
Address range: 1 to 199
Directions: E-W, SE-NW
Address range: 1 to 199
Tonnelle Ave
Length: 0.39 miles
Directions: N-S, SW-NE
Address range: 1 to 146
Directions: N-S, SW-NE
Address range: 1 to 146
Stuyvesant Ave
Length: 0.36 miles
Directions: E-W, SE-NW
Address range: 1 to 127
Directions: E-W, SE-NW
Address range: 1 to 127
Vroom St
Length: 0.35 miles
Direction: SE-NW
Address range: 49 to 181
Direction: SE-NW
Address range: 49 to 181
Van Reypen St
Length: 0.30 miles
Direction: SW-NE
Address range: 1 to 122
Direction: SW-NE
Address range: 1 to 122
Tuers Ave
Length: 0.30 miles
Direction: SW-NE
Address range: 35 to 139
Direction: SW-NE
Address range: 35 to 139
Wallis Ave
Length: 0.28 miles
Directions: N-S, SW-NE
Address range: 1 to 107
Directions: N-S, SW-NE
Address range: 1 to 107
Wales Ave
Length: 0.27 miles
Direction: SW-NE
Address range: 1 to 130
Direction: SW-NE
Address range: 1 to 130
Academy St
Length: 0.27 miles
Direction: SE-NW
Address range: 209 to 323
Direction: SE-NW
Address range: 209 to 323
Giles Ave
Length: 0.24 miles
Direction: SW-NE
Address range: 1 to 128
Direction: SW-NE
Address range: 1 to 128
Dales Ave
Length: 0.22 miles
Direction: SW-NE
Address range: 1 to 100
Direction: SW-NE
Address range: 1 to 100
Wright Ave
Length: 0.22 miles
Direction: SW-NE
Address range: 1 to 99
Direction: SW-NE
Address range: 1 to 99
Newkirk St
Length: 0.19 miles
Direction: SE-NW
Address range: 102 to 173
Direction: SE-NW
Address range: 102 to 173
Fayette Pl
Length: 0.18 miles
Direction: E-W
Address range: 23 to 35
Direction: E-W
Address range: 23 to 35
Magnolia Ave
Length: 0.17 miles
Direction: E-W
Address range: 285 to 317
Direction: E-W
Address range: 285 to 317
Journal Concourse Sq W
Length: 0.15 miles
Directions: E-W, SE-NW
Address range: 1 to 99
Directions: E-W, SE-NW
Address range: 1 to 99
Mercer St
Length: 0.15 miles
Direction: E-W
Address range: 530 to 598
Direction: E-W
Address range: 530 to 598
Bergen Sq
Length: 0.14 miles
Directions: SE-NW, SW-NE
Address range: 697 to 729
Directions: SE-NW, SW-NE
Address range: 697 to 729
Bryant Ave
Length: 0.13 miles
Direction: SW-NE
Address range: 1 to 52
Direction: SW-NE
Address range: 1 to 52
Broadway Way
Length: 0.12 miles
Direction: E-W
Direction: E-W
Emerson Ave
Length: 0.11 miles
Direction: SW-NE
Address range: 1 to 41
Direction: SW-NE
Address range: 1 to 41
Van Reipen Ave
Length: 0.11 miles
Direction: E-W
Address range: 131 to 169
Direction: E-W
Address range: 131 to 169
Jordan Ave
Length: 0.11 miles
Direction: SW-NE
Address range: 58 to 99
Direction: SW-NE
Address range: 58 to 99
Marion Pl
Length: 0.10 miles
Direction: E-W
Address range: 1 to 43
Direction: E-W
Address range: 1 to 43
Whitman Ave
Length: 0.10 miles
Direction: SW-NE
Address range: 1 to 55
Direction: SW-NE
Address range: 1 to 55
Freeman Ave
Length: 0.10 miles
Directions: N-S, SW-NE
Address range: 334 to 413
Directions: N-S, SW-NE
Address range: 334 to 413
Fox Pl
Length: 0.09 miles
Direction: E-W
Address range: 1 to 41
Direction: E-W
Address range: 1 to 41
Hawthorne Ave
Length: 0.09 miles
Direction: SW-NE
Address range: 1 to 46
Direction: SW-NE
Address range: 1 to 46
Co Rd 617 (Summit Ave)
Length: 0.08 miles
Direction: N-S
Address range: 326 to 354
Direction: N-S
Address range: 326 to 354
Holmes Ave
Length: 0.07 miles
Direction: SW-NE
Address range: 1 to 36
Direction: SW-NE
Address range: 1 to 36
Bond St
Length: 0.07 miles
Direction: E-W
Address range: 1 to 29
Direction: E-W
Address range: 1 to 29
Halleck Ave
Length: 0.06 miles
Direction: N-S
Address range: 1 to 133
Direction: N-S
Address range: 1 to 133
Smith St
Length: 0.06 miles
Direction: SE-NW
Address range: 1 to 28
Direction: SE-NW
Address range: 1 to 28
Journal Square Plz
Length: 0.06 miles
Direction: N-S
Address range: 1 to 42
Direction: N-S
Address range: 1 to 42
Bryan Pl
Length: 0.05 miles
Direction: N-S
Address range: 1 to 99
Direction: N-S
Address range: 1 to 99
Weldon St
Length: 0.04 miles
Direction: SW-NE
Address range: 1 to 39
Direction: SW-NE
Address range: 1 to 39
Jones Pl
Length: 0.04 miles
Direction: SW-NE
Address range: 1 to 19
Direction: SW-NE
Address range: 1 to 19
Dick St
Length: 0.04 miles
Direction: SW-NE
Direction: SW-NE
Co Rd 625
Length: 0.04 miles
Direction: SW-NE
Direction: SW-NE
Railroad features:
Csx RR & Norfolk Southern Rlwy (Penn Central RR)
Length: 0.41 miles
Direction: SE-NW
Direction: SE-NW
Norfolk Southern Rlwy
Length: 0.25 miles
Direction: E-W
Direction: E-W
Conrail RR (Csx RR & Norfolk Southern Rlwy)
Length: 0.12 miles
Directions: E-W, SE-NW
Directions: E-W, SE-NW