Mesa Gardens neighborhood in Grand Junction, Colorado (CO), 81501 detailed profile
Settings
X


Business Search - 14 Million verified businesses
Area: 0.109 square miles
Population: 997
Population density:
| Mesa Gardens: | 9,107 people per square mile |
| Grand Junction: | 2,209 people per square mile |

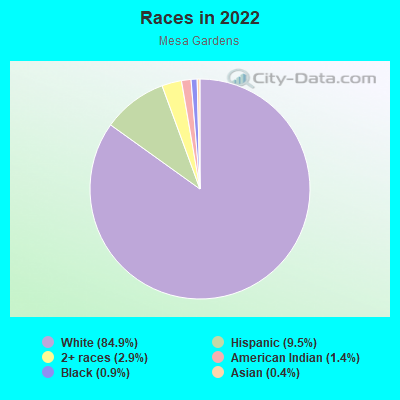
- 85684.9%White
- 969.5%Hispanic or Latino
- 292.9%Two or more races
- 141.4%American Indian
- 90.9%Black
- 40.4%Asian
Median household income in 2022:
| Mesa Gardens: | $56,401 |
| Grand Junction: | $61,458 |
Distribution of median household income
![Distribution of median household income]()
- 17Less than $10,000
- 15$10,000 to $19,999
- 15$20,000 to $29,999
- 49$30,000 to $39,999
- 46$40,000 to $49,999
- 33$50,000 to $59,999
- 38$60,000 to $74,999
- 73$75,000 to $99,999
- 41$100,000 to $124,999
- 33$125,000 to $149,999
- 1$150,000 to $199,999
- 17$200,000 or more

Distribution of owner-occupied house/condo value
![Distribution of owner-occupied house/condo value]()
- 34Less than $50,000
- 1$50,000 to $99,999
- 8$100,000 to $149,999
- 44$150,000 to $199,999
- 96$200,000 to $249,999
- 15$250,000 to $299,999
- 26$300,000 to $399,999
- 22$400,000 to $499,999
- 1$750,000 to $999,999
- 2$1,000,000 or more

Distribution of rent paid by renters
![Distribution of rent paid by renters]()
- 4$100 to $199
- 19$200 to $299
- 5$300 to $399
- 2$400 to $499
- 5$500 to $599
- 2$600 to $699
- 66$700 to $799
- 26$800 to $899
- 8$900 to $999
- 24$1,000 to $1,249
- 7$1,250 to $1,499
- 15$1,500 to $1,999

Median rent in 2022:
| Mesa Gardens: | $787 |
| Grand Junction: | $1,037 |
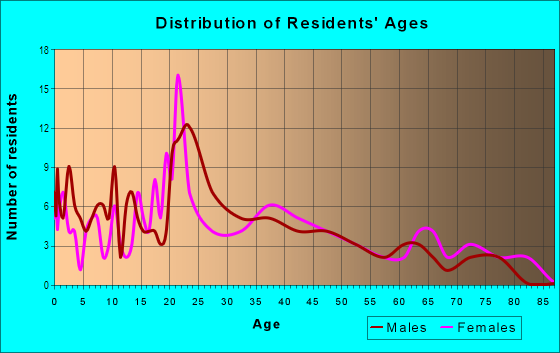
| Males: | 568 |
| Females: | 428 |
Males:
| This neighborhood: | 38.4 years |
| Whole city: | 35.2 years |
| This neighborhood: | 32.1 years |
| Whole city: | 41.4 years |
Average household size:
| Mesa Gardens: | 2.3 people |
| Grand Junction: | 2.3 people |
Percentage of family households:
| Mesa Gardens: | 52.6% |
| Grand Junction: | 41.5% |
| Here: | 29.6% |
| Grand Junction: | 44.5% |
Percentage of married-couple families with children (among all households):
| Mesa Gardens: | 21.4% |
| Grand Junction: | 30.4% |
Percentage of single-mother households (among all households):
| Mesa Gardens: | 11.0% |
| Grand Junction: | 7.7% |
Percentage of never married males 15 years old and over:
Percentage of never married females 15 years old and over:
| Mesa Gardens: | 26.6% |
| Grand Junction: | 20.7% |
Percentage of never married females 15 years old and over:
| Mesa Gardens: | 14.0% |
| city: | 15.0% |
Percentage of people that speak English not well or not at all:
| Mesa Gardens: | 0.5% |
| Grand Junction: | 0.8% |
Percentage of people born in this state:
Percentage of people born in another U.S. state:
Percentage of native residents but born outside the U.S.:
Percentage of foreign born residents:
| Here: | 52.8% |
| Grand Junction: | 47.4% |
Percentage of people born in another U.S. state:
| Mesa Gardens: | 39.4% |
| Grand Junction: | 47.0% |
Percentage of native residents but born outside the U.S.:
| Here: | 1.0% |
| city: | 1.0% |
Percentage of foreign born residents:
| Here: | 6.7% |
| Grand Junction: | 4.7% |
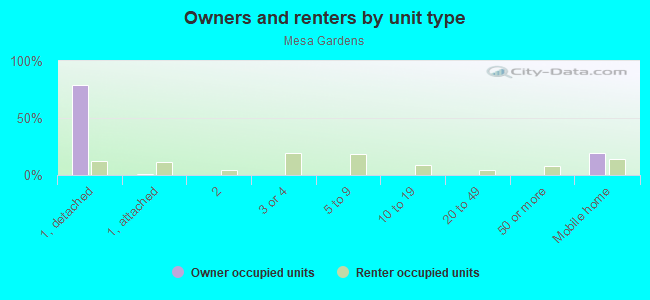
Owner-occupied
Renter-occupied

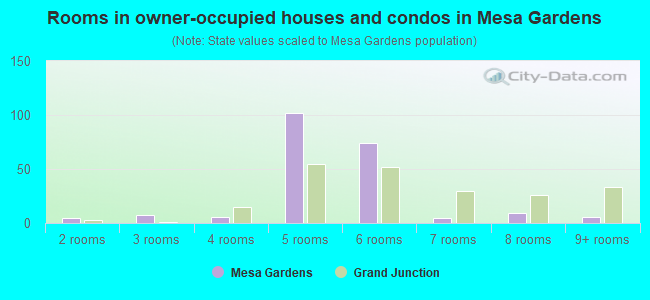
- Rooms in owner-occupied houses and condos in Mesa Gardens
- 01 room
- 52 rooms
- 73 rooms
- 64 rooms
- 1025 rooms
- 746 rooms
- 57 rooms
- 98 rooms
- 69+ rooms
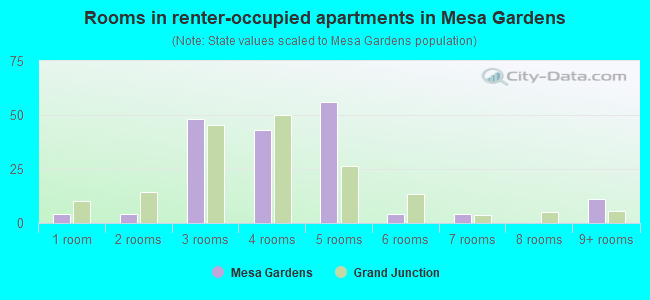
- Rooms in renter-occupied apartments in Mesa Gardens
- 41 room
- 42 rooms
- 483 rooms
- 434 rooms
- 565 rooms
- 46 rooms
- 47 rooms
- 08 rooms
- 119+ rooms
Owner-occupied
Renter-occupied
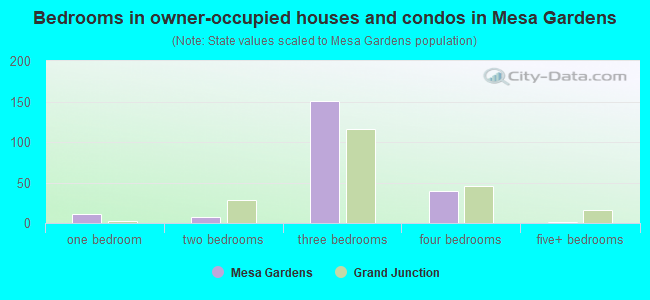
- Bedrooms in owner-occupied houses and condos in Mesa Gardens
- 0no bedroom
- 111 bedroom
- 72 bedrooms
- 1513 bedrooms
- 404 bedrooms
- 15+ bedrooms
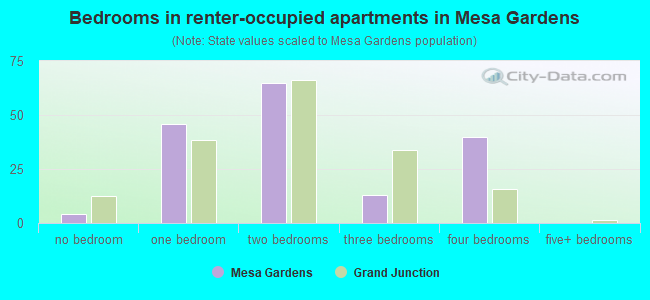
- Bedrooms in renter-occupied apartments in Mesa Gardens
- 4no bedroom
- 461 bedroom
- 652 bedrooms
- 133 bedrooms
- 404 bedrooms
- 05+ bedrooms
Average number of cars or other vehicles available in houses/condos:
Average number of cars or other vehicles available in apartments:
| This neighborhood: | 2.2 |
| Grand Junction: | 2.2 |
Average number of cars or other vehicles available in apartments:
| Here: | 1.3 |
| city: | 1.3 |
Percentage of units with a mortgage:
| Mesa Gardens: | 71.5% |
| Grand Junction: | 65.2% |
Average estimated value of detached houses in 2022 (60.6% of all units):
| Mesa Gardens: | $247,351 |
| Grand Junction: | $357,130 |
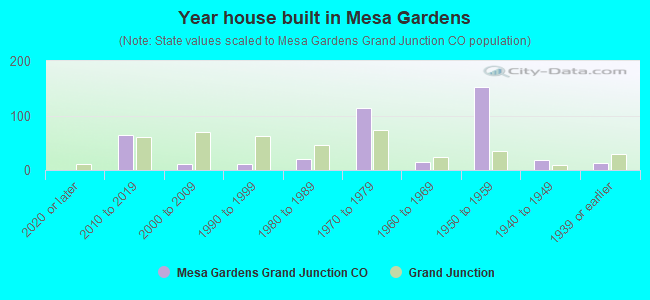
- Year house built in Mesa Gardens
- 02020 or later
- 642010 to 2019
- 112000 to 2009
- 111990 to 1999
- 211980 to 1989
- 1141970 to 1979
- 151960 to 1969
- 1521950 to 1959
- 191940 to 1949
- 121939 or earlier
City-data.com crime index for city in 2020 (higher means more crime):
| City: | 384.0 |
| U.S. average: | 219.5 |
Travel time to work (commute)
![Travel time to work (commute)]()
- 6Less than 5 minutes
- 585 to 9 minutes
- 9710 to 14 minutes
- 7015 to 19 minutes
- 3320 to 24 minutes
- 125 to 29 minutes
- 930 to 34 minutes
- 140 to 44 minutes
- 445 to 59 minutes
- 160 to 89 minutes
- 190 or more minutes

Means of transportation to work
![Means of transportation to work]()
- 68.6%402Drove a car alone
- 11.6%68Carpooled
- 1.0%6Bus
- 2.2%13Bicycle
- 2.4%14Walked
- 4.8%28Other means
- 9.0%53Worked at home

Time leaving home to go to work
![Time leaving home to go to work]()
- 1212:00 a.m. to 4:59 a.m.
- 55:00 a.m. to 5:29 a.m.
- 125:30 a.m. to 5:59 a.m.
- 66:00 a.m. to 6:29 a.m.
- 246:30 a.m. to 6:59 a.m.
- 397:00 a.m. to 7:29 a.m.
- 487:30 a.m. to 7:59 a.m.
- 168:00 a.m. to 8:29 a.m.
- 438:30 a.m. to 8:59 a.m.
- 159:00 a.m. to 9:59 a.m.
- 1510:00 a.m. to 10:59 a.m.
- 1011:00 a.m. to 11:59 a.m.
- 1412:00 p.m. to 3:59 p.m.
- 214:00 p.m. to 11:59 p.m.

Occupations of males:
- Percentage of males in business and financial operations occupations:
Here: 7.6% city: 2.7%
- Percentage of males in computer and mathematical occupations:
Here: 2.8% city: 2.6%
- Percentage of males in architecture and engineering occupations:
Here: 1.2% city: 3.0%
- Percentage of males in education, training, and library occupations:
Here: 2.4% city: 3.4%
- Percentage of males in arts, design, entertainment, sports, and media occupations:
Here: 2.3% city: 2.8%
- Percentage of males in service occupations:
Here: 23.7% city: 15.2%
- Percentage of males in sales and office occupations:
Here: 21.6% city: 14.3%
- Percentage of males in construction, extraction, and maintenance occupations:
Here: 7.4% city: 10.5%
- Percentage of males in production occupations:
Here: 1.9% city: 6.0%
- Percentage of males in transportation occupations:
Here: 12.8% city: 7.4%
- Percentage of males in material moving occupations:
Here: 4.6% city: 3.8%
Occupations of females:
- Percentage of females in management occupations (except farmers):
Here: 7.2% city: 9.3%
- Percentage of females in business and financial operations occupations:
Here: 4.7% city: 4.7%
- Percentage of females in life, physical, and social science occupations:
Here: 11.6% city: 1.5%
- Percentage of females in education, training, and library occupations:
Here: 3.9% city: 9.5%
- Percentage of females in healthcare practitioners and technical occupations:
Here: 3.2% city: 13.3%
- Percentage of females in service occupations:
Here: 46.8% city: 20.7%
- Percentage of females in sales and office occupations:
Here: 16.6% city: 28.2%
- Percentage of females in farming, fishing, and forestry occupations:
Here: 1.0% city: 0.2%
- Percentage of females in construction, extraction, and maintenance occupations:
Here: 1.0% city: 0.5%
- Percentage of females in production occupations:
Here: 1.9% city: 1.9%
- Percentage of females in material moving occupations:
Here: 3.9% city: 2.3%
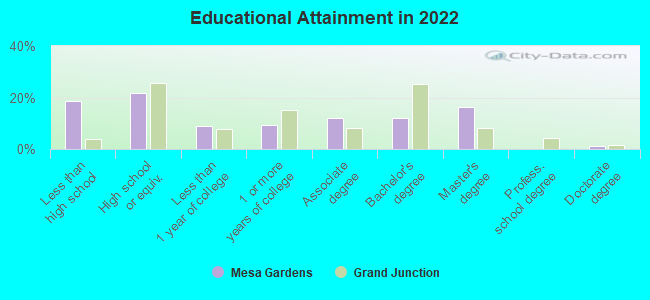
Education in this neighborhood (subdivision or community):
- Percentage of people 3 years and older in K-12 schools:
Mesa Gardens: 17.4% Grand Junction: 13.5%
- Percentage of people 3 years and older in undergraduate colleges:
Mesa Gardens: 5.8% Grand Junction: 8.2%
- Percentage of people 3 years and older in grad. or professional schools:
Mesa Gardens: 0.9% Grand Junction: 0.8%
- Percentage of students K-12 enrolled in private schools:
Mesa Gardens: 6.5% Grand Junction: 12.8%
Percentage of population below poverty level:
| Mesa Gardens: | 14.0% |
| Grand Junction: | 14.1% |
Median year owner moved in (as recorded in 2022):
Median year renter moved in (as recorded in 2022):
| Mesa Gardens: | 2013 |
| Grand Junction: | 2013 |
Median year renter moved in (as recorded in 2022):
| Mesa Gardens: | 2016 |
| Grand Junction: | 2021 |
Percentage of married-couple families with both working:
| Mesa Gardens: | 102.1% |
| Grand Junction: | 62.1% |
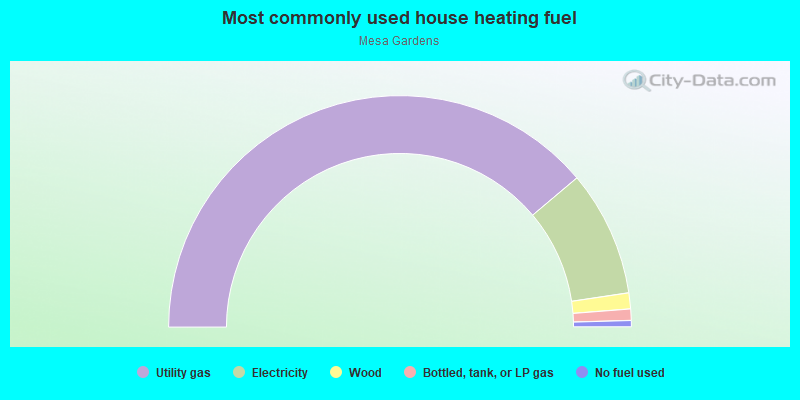
- 77.8%Utility gas
- 17.6%Electricity
- 2.2%Wood
- 1.6%Bottled, tank, or LP gas
- 0.9%No fuel used
Roads and streets:
E Ouray Ave
Length: 0.53 miles
Direction: E-W
Address range: 2000 to 2799
Direction: E-W
Address range: 2000 to 2799
Grand Ave
Length: 0.41 miles
Direction: E-W
Address range: 2200 to 2799
Direction: E-W
Address range: 2200 to 2799
Gunnison Ave
Length: 0.38 miles
Direction: E-W
Address range: 2301 to 2699
Direction: E-W
Address range: 2301 to 2699
N 22nd St
Length: 0.22 miles
Direction: N-S
Address range: 400 to 699
Direction: N-S
Address range: 400 to 699
N 23rd St
Length: 0.22 miles
Direction: N-S
Address range: 400 to 699
Direction: N-S
Address range: 400 to 699
N 25th St
Length: 0.22 miles
Direction: N-S
Address range: 400 to 699
Direction: N-S
Address range: 400 to 699
N 27th St
Length: 0.22 miles
Direction: N-S
Address range: 400 to 698
Direction: N-S
Address range: 400 to 698
24th St (N 24th St)
Length: 0.22 miles
Direction: N-S
Address range: 400 to 599
Direction: N-S
Address range: 400 to 599
N 26th St
Length: 0.22 miles
Direction: N-S
Address range: 400 to 699
Direction: N-S
Address range: 400 to 699
Chipeta Ave
Length: 0.14 miles
Directions: E-W, N-S, SW-NE
Address range: 2000 to 2199
Directions: E-W, N-S, SW-NE
Address range: 2000 to 2199
N 20th St
Length: 0.05 miles
Direction: N-S
Address range: 500 to 599
Direction: N-S
Address range: 500 to 599