Milburn neighborhood in Overland Park, Kansas (KS), 66204 detailed profile
Settings
X

Business Search - 14 Million verified businesses
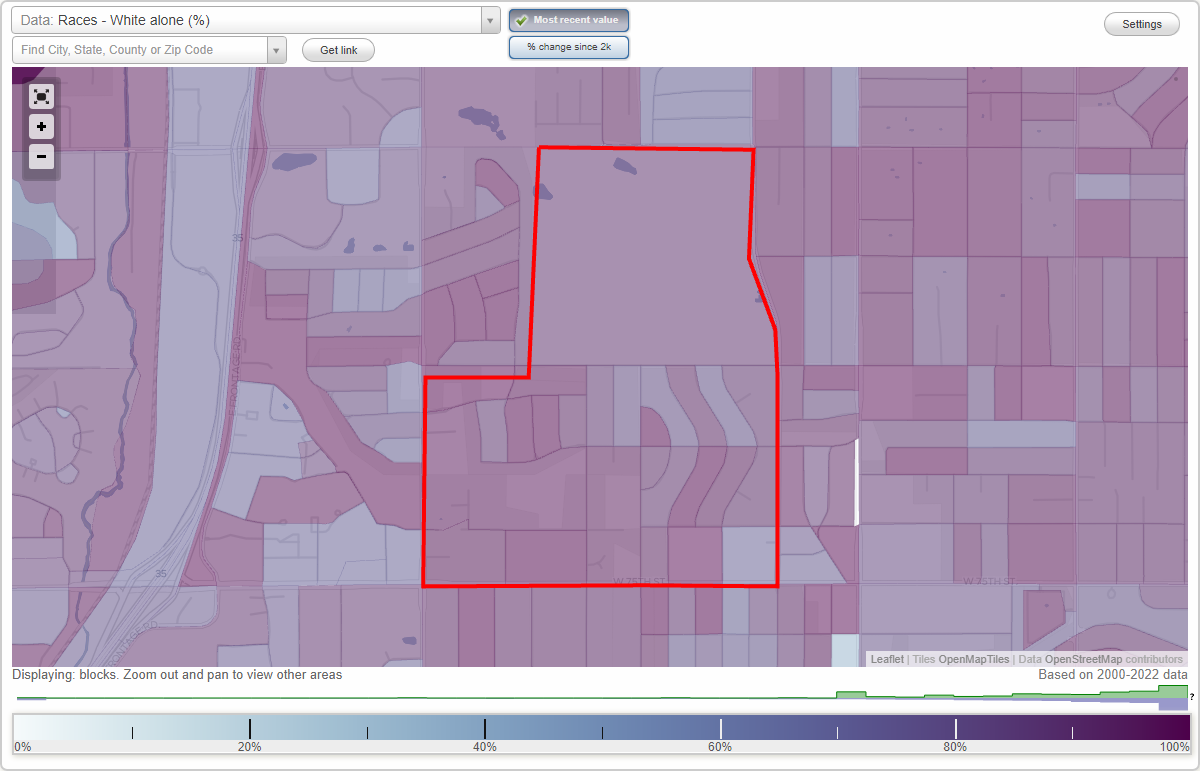
Area: 0.666 square miles
Population: 2,318
Population density:
| Milburn: | 3,480 people per square mile |
| Overland Park: | 3,485 people per square mile |

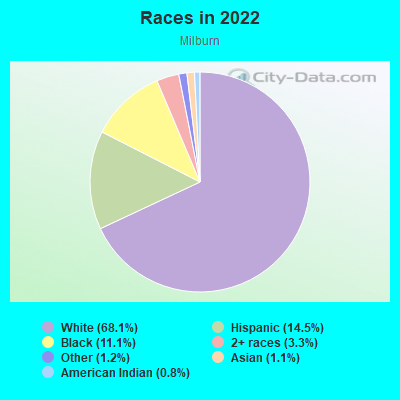
- 1,71668.1%White
- 36614.5%Hispanic or Latino
- 28011.1%Black
- 823.3%Two or more races
- 291.2%Some other race
- 281.1%Asian
- 190.8%American Indian
Median household income in 2022:
| Milburn: | $77,460 |
| Overland Park: | $96,694 |
Distribution of median household income
![Distribution of median household income]()
- 36Less than $10,000
- 70$10,000 to $19,999
- 80$20,000 to $29,999
- 132$30,000 to $39,999
- 73$40,000 to $49,999
- 112$50,000 to $59,999
- 85$60,000 to $74,999
- 179$75,000 to $99,999
- 127$100,000 to $124,999
- 104$125,000 to $149,999
- 144$150,000 to $199,999
- 47$200,000 or more

Distribution of owner-occupied house/condo value
![Distribution of owner-occupied house/condo value]()
- 64Less than $50,000
- 16$50,000 to $99,999
- 63$100,000 to $149,999
- 184$150,000 to $199,999
- 183$200,000 to $249,999
- 200$250,000 to $299,999
- 166$300,000 to $399,999
- 46$400,000 to $499,999
- 19$500,000 to $749,999
- 66$1,000,000 or more

Distribution of rent paid by renters
![Distribution of rent paid by renters]()
- 24$600 to $699
- 48$700 to $799
- 64$800 to $899
- 25$900 to $999
- 44$1,000 to $1,249
- 28$1,250 to $1,499
- 121$1,500 to $1,999
- 99$2,000 or more

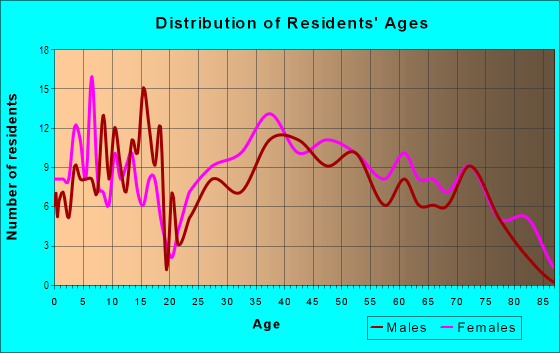
| Males: | 1,270 |
| Females: | 1,047 |
Males:
| This neighborhood: | 33.0 years |
| Whole city: | 37.7 years |
| This neighborhood: | 43.1 years |
| Whole city: | 38.8 years |
Average household size:
| Milburn: | 6.9 people |
| Overland Park: | 2.3 people |
Percentage of family households:
| Milburn: | 40.9% |
| Overland Park: | 42.1% |
| Here: | 50.5% |
| Overland Park: | 48.0% |
Percentage of married-couple families with children (among all households):
| Milburn: | 40.9% |
| Overland Park: | 37.4% |
Percentage of single-mother households (among all households):
| Milburn: | 4.5% |
| Overland Park: | 4.2% |
Percentage of never married males 15 years old and over:
Percentage of never married females 15 years old and over:
| Milburn: | 23.4% |
| Overland Park: | 17.2% |
Percentage of never married females 15 years old and over:
| Milburn: | 16.6% |
| city: | 15.1% |
Percentage of people that speak English not well or not at all:
| Milburn: | 0.8% |
| Overland Park: | 1.4% |
Percentage of people born in this state:
Percentage of people born in another U.S. state:
Percentage of native residents but born outside the U.S.:
Percentage of foreign born residents:
| Here: | 41.0% |
| Overland Park: | 37.4% |
Percentage of people born in another U.S. state:
| Milburn: | 52.2% |
| Overland Park: | 50.4% |
Percentage of native residents but born outside the U.S.:
| Here: | 1.5% |
| city: | 0.9% |
Percentage of foreign born residents:
| Here: | 5.9% |
| Overland Park: | 11.3% |
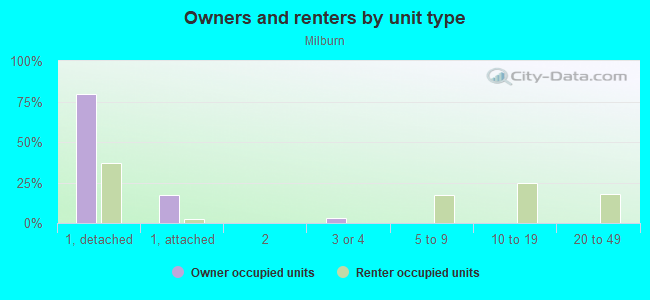
Owner-occupied
Renter-occupied

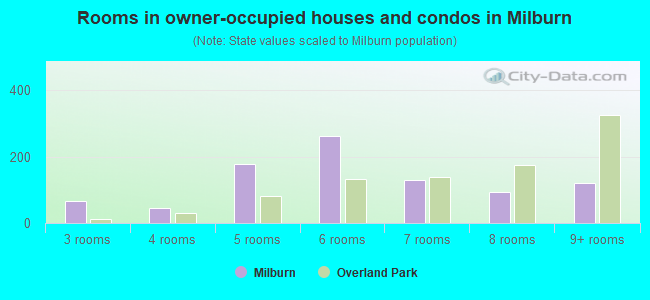
- Rooms in owner-occupied houses and condos in Milburn
- 01 room
- 02 rooms
- 663 rooms
- 464 rooms
- 1795 rooms
- 2626 rooms
- 1287 rooms
- 948 rooms
- 1209+ rooms
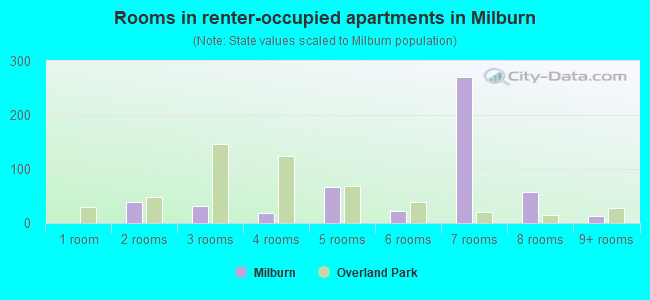
- Rooms in renter-occupied apartments in Milburn
- 01 room
- 392 rooms
- 313 rooms
- 184 rooms
- 665 rooms
- 236 rooms
- 2717 rooms
- 588 rooms
- 139+ rooms
Owner-occupied
Renter-occupied
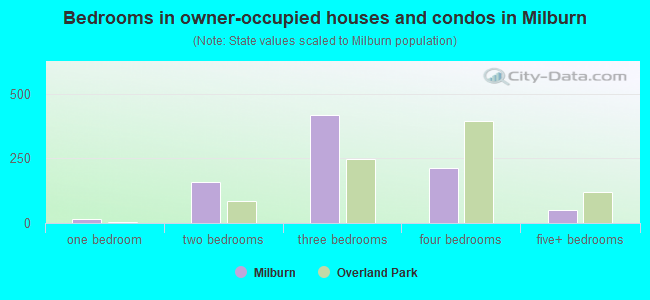
- Bedrooms in owner-occupied houses and condos in Milburn
- 0no bedroom
- 151 bedroom
- 1572 bedrooms
- 4173 bedrooms
- 2124 bedrooms
- 495+ bedrooms
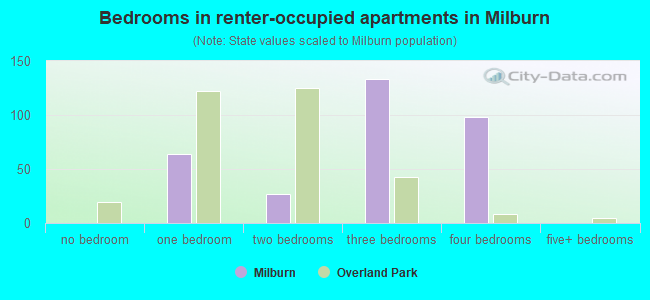
- Bedrooms in renter-occupied apartments in Milburn
- 0no bedroom
- 641 bedroom
- 272 bedrooms
- 1333 bedrooms
- 984 bedrooms
- 05+ bedrooms
Average number of cars or other vehicles available in houses/condos:
Average number of cars or other vehicles available in apartments:
| This neighborhood: | 1.7 |
| Overland Park: | 2.0 |
Average number of cars or other vehicles available in apartments:
| Here: | 3.0 |
| city: | 1.3 |
Percentage of units with a mortgage:
| Milburn: | 54.2% |
| Overland Park: | 67.7% |
Average estimated value of detached houses in 2022 (99.9% of all units):
| Milburn: | $268,662 |
| Kansas: | $264,181 |
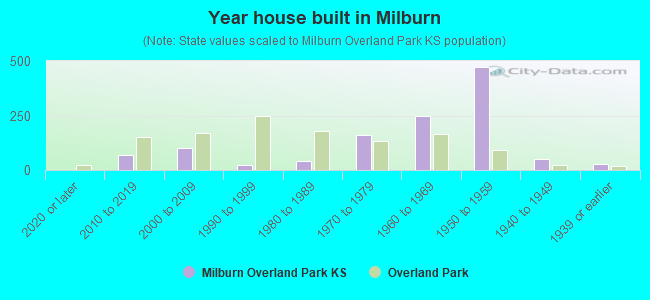
- Year house built in Milburn
- 02020 or later
- 702010 to 2019
- 1002000 to 2009
- 231990 to 1999
- 421980 to 1989
- 1621970 to 1979
- 2501960 to 1969
- 4741950 to 1959
- 521940 to 1949
- 271939 or earlier
City-data.com crime index for city in 2020 (higher means more crime):
| City: | 154.8 |
| U.S. average: | 219.5 |
Travel time to work (commute)
![Travel time to work (commute)]()
- 4Less than 5 minutes
- 505 to 9 minutes
- 11010 to 14 minutes
- 26215 to 19 minutes
- 20820 to 24 minutes
- 5725 to 29 minutes
- 6830 to 34 minutes
- 735 to 39 minutes
- 1440 to 44 minutes
- 4345 to 59 minutes
- 1890 or more minutes

Means of transportation to work
![Means of transportation to work]()
- 81.6%1,165Drove a car alone
- 4.6%65Carpooled
- 0.4%5Bus
- 0.6%8Motorcycle
- 0.4%6Bicycle
- 1.8%26Walked
- 12.1%173Worked at home

Time leaving home to go to work
![Time leaving home to go to work]()
- 2312:00 a.m. to 4:59 a.m.
- 225:00 a.m. to 5:29 a.m.
- 445:30 a.m. to 5:59 a.m.
- 396:00 a.m. to 6:29 a.m.
- 516:30 a.m. to 6:59 a.m.
- 1157:00 a.m. to 7:29 a.m.
- 2037:30 a.m. to 7:59 a.m.
- 1288:00 a.m. to 8:29 a.m.
- 328:30 a.m. to 8:59 a.m.
- 579:00 a.m. to 9:59 a.m.
- 1410:00 a.m. to 10:59 a.m.
- 2011:00 a.m. to 11:59 a.m.
- 3512:00 p.m. to 3:59 p.m.
- 484:00 p.m. to 11:59 p.m.

Occupations of males:
- Percentage of males in management occupations (except farmers):
Here: 7.7% city: 17.2%
- Percentage of males in business and financial operations occupations:
Here: 17.5% city: 9.9%
- Percentage of males in computer and mathematical occupations:
Here: 1.8% city: 11.2%
- Percentage of males in architecture and engineering occupations:
Here: 6.2% city: 5.0%
- Percentage of males in legal occupations:
Here: 2.2% city: 2.2%
- Percentage of males in arts, design, entertainment, sports, and media occupations:
Here: 5.5% city: 2.6%
- Percentage of males in healthcare practitioners and technical occupations:
Here: 1.6% city: 4.1%
- Percentage of males in service occupations:
Here: 8.2% city: 9.7%
- Percentage of males in sales and office occupations:
Here: 18.4% city: 19.9%
- Percentage of males in construction, extraction, and maintenance occupations:
Here: 6.3% city: 2.8%
- Percentage of males in production occupations:
Here: 8.8% city: 2.3%
- Percentage of males in transportation occupations:
Here: 9.1% city: 3.0%
- Percentage of males in material moving occupations:
Here: 2.0% city: 2.7%
Occupations of females:
- Percentage of females in management occupations (except farmers):
Here: 7.0% city: 10.8%
- Percentage of females in business and financial operations occupations:
Here: 9.9% city: 10.2%
- Percentage of females in computer and mathematical occupations:
Here: 7.8% city: 4.6%
- Percentage of females in community and social services occupations:
Here: 5.4% city: 2.4%
- Percentage of females in education, training, and library occupations:
Here: 9.1% city: 10.8%
- Percentage of females in arts, design, entertainment, sports, and media occupations:
Here: 3.7% city: 2.8%
- Percentage of females in healthcare practitioners and technical occupations:
Here: 13.4% city: 12.1%
- Percentage of females in service occupations:
Here: 16.7% city: 13.8%
- Percentage of females in sales and office occupations:
Here: 27.0% city: 25.2%
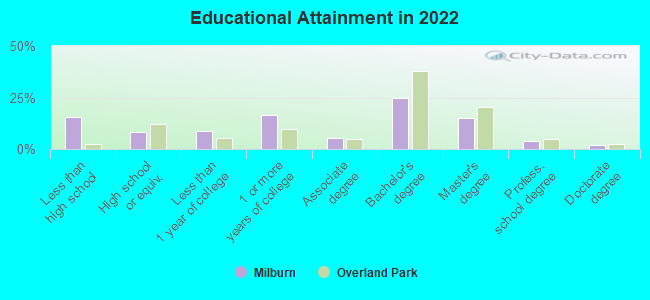
Education in this neighborhood (subdivision or community):
- Percentage of people 3 years and older in K-12 schools:
Milburn: 19.0% Overland Park: 15.4%
- Percentage of people 3 years and older in undergraduate colleges:
Milburn: 10.3% Overland Park: 3.4%
- Percentage of people 3 years and older in grad. or professional schools:
Milburn: 3.1% Overland Park: 2.3%
- Percentage of students K-12 enrolled in private schools:
Milburn: 24.6% Overland Park: 14.1%
Percentage of population below poverty level:
| Milburn: | 8.1% |
| Overland Park: | 5.0% |
Median year owner moved in (as recorded in 2022):
| Milburn: | 2008 |
| Overland Park: | 2013 |
Percentage of married-couple families with both working:
| Milburn: | 104.8% |
| Overland Park: | 75.4% |
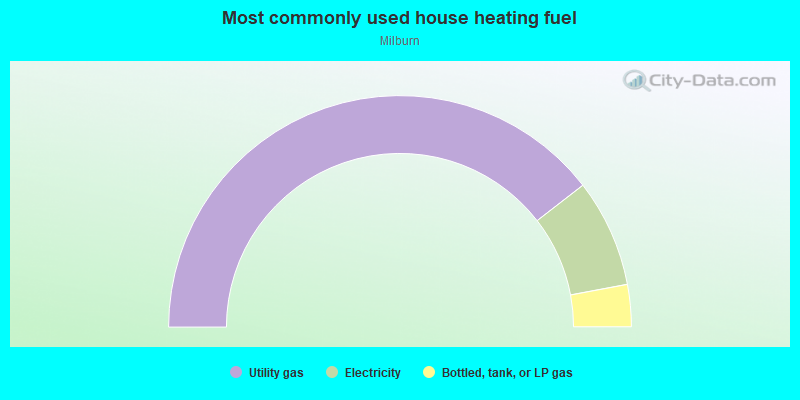
- 79.1%Utility gas
- 15.1%Electricity
- 5.9%Bottled, tank, or LP gas
Roads and streets:
W 75th St
Length: 0.94 miles
Direction: E-W
Address range: 7400 to 8599
Direction: E-W
Address range: 7400 to 8599
W 72nd Ter
Length: 0.89 miles
Direction: E-W
Address range: 7500 to 8499
Direction: E-W
Address range: 7500 to 8499
W 74th St
Length: 0.87 miles
Direction: E-W
Address range: 7400 to 8599
Direction: E-W
Address range: 7400 to 8599
W 71st St
Length: 0.57 miles
Direction: E-W
Address range: 7411 to 8099
Direction: E-W
Address range: 7411 to 8099
Conser St
Length: 0.57 miles
Directions: N-S, SE-NW, SW-NE
Address range: 7100 to 7499
Directions: N-S, SE-NW, SW-NE
Address range: 7100 to 7499
Robinson St
Length: 0.56 miles
Directions: N-S, SE-NW, SW-NE
Address range: 7100 to 7499
Directions: N-S, SE-NW, SW-NE
Address range: 7100 to 7499
Lowell Ave
Length: 0.50 miles
Direction: N-S
Address range: 7100 to 7499
Direction: N-S
Address range: 7100 to 7499
Hardy St
Length: 0.50 miles
Direction: N-S
Address range: 7100 to 7499
Direction: N-S
Address range: 7100 to 7499
Newton Dr
Length: 0.43 miles
Directions: N-S, SE-NW, SW-NE
Address range: 7100 to 7399
Directions: N-S, SE-NW, SW-NE
Address range: 7100 to 7399
W 72nd St
Length: 0.33 miles
Direction: E-W
Address range: 8100 to 8499
Direction: E-W
Address range: 8100 to 8499
Lowell Dr
Length: 0.29 miles
Directions: E-W, N-S, SE-NW, SW-NE
Address range: 7100 to 7299
Directions: E-W, N-S, SE-NW, SW-NE
Address range: 7100 to 7299
Hadley St
Length: 0.27 miles
Directions: N-S, SW-NE
Address range: 7200 to 7499
Directions: N-S, SW-NE
Address range: 7200 to 7499
Craig St
Length: 0.22 miles
Direction: N-S
Address range: 7100 to 7499
Direction: N-S
Address range: 7100 to 7499
Hemlock St
Length: 0.15 miles
Direction: N-S
Address range: 7200 to 7299
Direction: N-S
Address range: 7200 to 7299
Woodward St
Length: 0.14 miles
Direction: N-S
Address range: 7200 to 7299
Direction: N-S
Address range: 7200 to 7299
Goodman St
Length: 0.12 miles
Direction: N-S
Address range: 7200 to 7299
Direction: N-S
Address range: 7200 to 7299
Mackey St
Length: 0.09 miles
Direction: N-S
Address range: 7300 to 7399
Direction: N-S
Address range: 7300 to 7399
W 74th Ter
Length: 0.07 miles
Directions: E-W, SE-NW, SW-NE
Address range: 8000 to 8041
Directions: E-W, SE-NW, SW-NE
Address range: 8000 to 8041
Santa Fe Dr
Length: 0.07 miles
Direction: N-S
Address range: 7421 to 7499
Direction: N-S
Address range: 7421 to 7499
Conser
Length: 0.05 miles
Direction: SW-NE
Address range: 7201 to 7253
Direction: SW-NE
Address range: 7201 to 7253
Mackey
Length: 0.05 miles
Direction: E-W
Direction: E-W
Conser Dr
Length: 0.04 miles
Direction: SE-NW
Address range: 7225 to 7249
Direction: SE-NW
Address range: 7225 to 7249