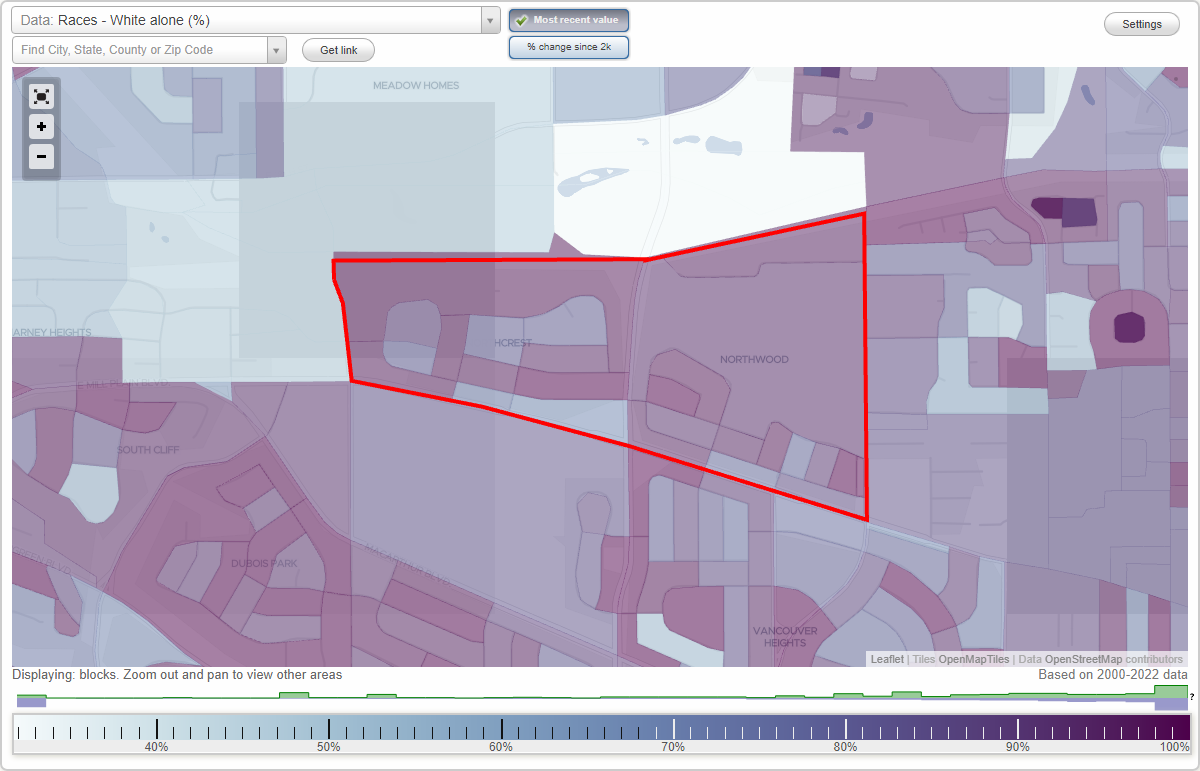
Northwood neighborhood in Vancouver, Washington (WA), 98661, 98664 detailed profile
Settings
X

Business Search - 14 Million verified businesses
Area: 0.433 square miles
Population: 1,415
Population density:
| Northwood: | 3,267 people per square mile |
| Vancouver: | 4,545 people per square mile |

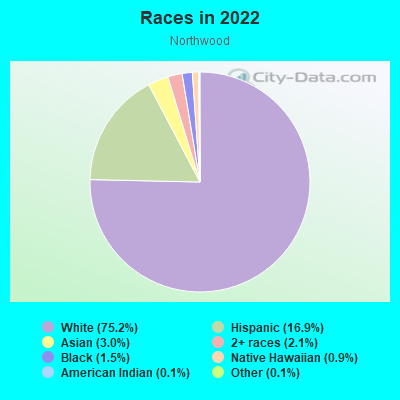
- 1,08675.2%White
- 24416.9%Hispanic or Latino
- 443.0%Asian
- 312.1%Two or more races
- 221.5%Black
- 130.9%Native Hawaiian and Other
Pacific Islander - 20.1%American Indian
- 20.1%Some other race
Median household income in 2022:
| Northwood: | $98,096 |
| Vancouver: | $76,799 |
Distribution of median household income
![Distribution of median household income]()
- 26Less than $10,000
- 52$10,000 to $19,999
- 22$20,000 to $29,999
- 24$30,000 to $39,999
- 34$40,000 to $49,999
- 41$50,000 to $59,999
- 47$60,000 to $74,999
- 67$75,000 to $99,999
- 72$100,000 to $124,999
- 49$125,000 to $149,999
- 62$150,000 to $199,999
- 67$200,000 or more

Distribution of owner-occupied house/condo value
![Distribution of owner-occupied house/condo value]()
- 29Less than $50,000
- 12$50,000 to $99,999
- 6$150,000 to $199,999
- 19$200,000 to $249,999
- 9$250,000 to $299,999
- 125$300,000 to $399,999
- 134$400,000 to $499,999
- 58$500,000 to $749,999
- 23$750,000 to $999,999
- 22$1,000,000 or more

Distribution of rent paid by renters
![Distribution of rent paid by renters]()
- 17$100 to $199
- 32$300 to $399
- 18$400 to $499
- 11$500 to $599
- 17$800 to $899
- 4$900 to $999
- 31$1,000 to $1,249
- 33$1,250 to $1,499
- 19$1,500 to $1,999
- 18$2,000 or more

Median rent in 2022:
| Northwood: | $1,094 |
| Vancouver: | $1,452 |
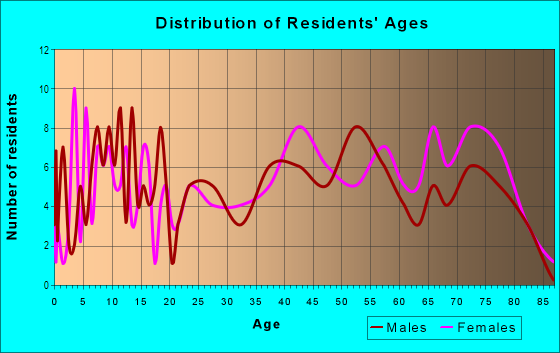
| Males: | 681 |
| Females: | 734 |
Males:
| This neighborhood: | 41.1 years |
| Whole city: | 34.7 years |
| This neighborhood: | 41.8 years |
| Whole city: | 39.9 years |
Average household size:
| Northwood: | 2.6 people |
| Vancouver: | 2.4 people |
Percentage of family households:
| Northwood: | 47.3% |
| Vancouver: | 40.5% |
| Here: | 58.2% |
| Vancouver: | 40.2% |
Percentage of married-couple families with children (among all households):
| Northwood: | 23.6% |
| Vancouver: | 27.2% |
Percentage of single-mother households (among all households):
| Northwood: | 12.6% |
| Vancouver: | 9.7% |
Percentage of never married males 15 years old and over:
Percentage of never married females 15 years old and over:
| Northwood: | 15.6% |
| Vancouver: | 18.8% |
Percentage of never married females 15 years old and over:
| Northwood: | 14.3% |
| city: | 17.6% |
Percentage of people that speak English not well or not at all:
| Northwood: | 4.2% |
| Vancouver: | 4.9% |
Percentage of people born in this state:
Percentage of people born in another U.S. state:
Percentage of native residents but born outside the U.S.:
Percentage of foreign born residents:
| Here: | 35.5% |
| Vancouver: | 30.3% |
Percentage of people born in another U.S. state:
| Northwood: | 46.5% |
| Vancouver: | 54.5% |
Percentage of native residents but born outside the U.S.:
| Here: | 2.9% |
| city: | 1.4% |
Percentage of foreign born residents:
| Here: | 15.1% |
| Vancouver: | 13.8% |
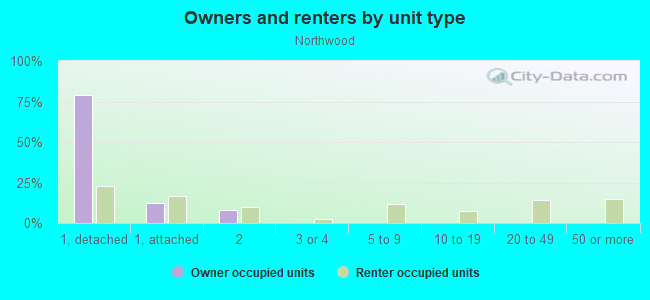
Owner-occupied
Renter-occupied

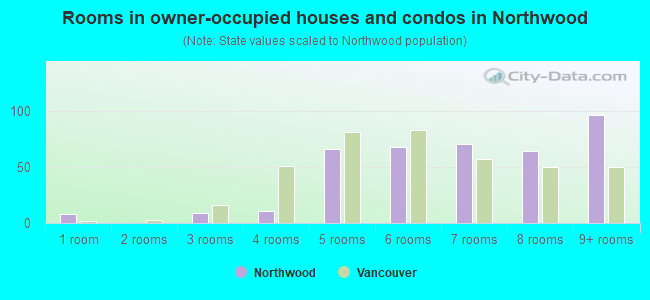
- Rooms in owner-occupied houses and condos in Northwood
- 81 room
- 02 rooms
- 93 rooms
- 114 rooms
- 665 rooms
- 686 rooms
- 707 rooms
- 648 rooms
- 969+ rooms
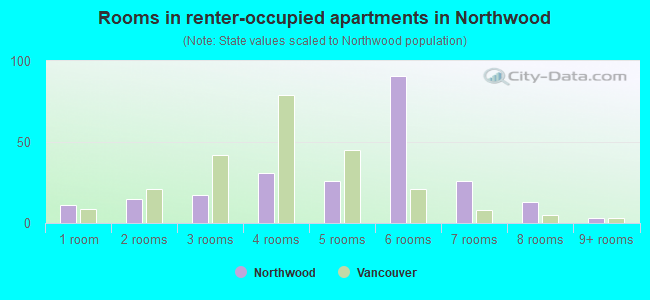
- Rooms in renter-occupied apartments in Northwood
- 111 room
- 152 rooms
- 173 rooms
- 314 rooms
- 265 rooms
- 916 rooms
- 267 rooms
- 138 rooms
- 39+ rooms
Owner-occupied
Renter-occupied
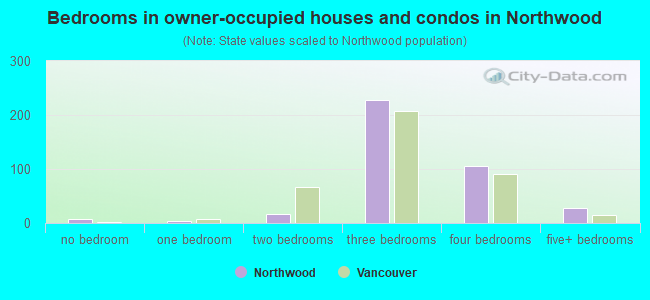
- Bedrooms in owner-occupied houses and condos in Northwood
- 8no bedroom
- 31 bedroom
- 172 bedrooms
- 2273 bedrooms
- 1064 bedrooms
- 275+ bedrooms
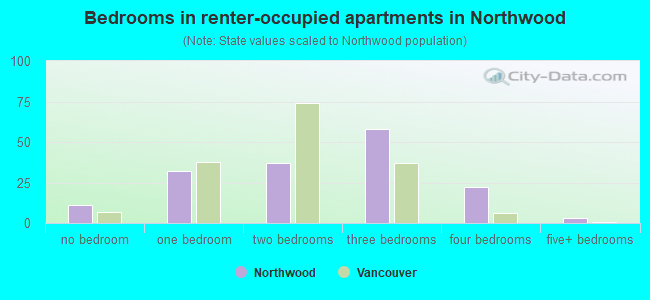
- Bedrooms in renter-occupied apartments in Northwood
- 11no bedroom
- 321 bedroom
- 372 bedrooms
- 583 bedrooms
- 224 bedrooms
- 35+ bedrooms
Average number of cars or other vehicles available in houses/condos:
Average number of cars or other vehicles available in apartments:
| This neighborhood: | 2.4 |
| Vancouver: | 2.2 |
Average number of cars or other vehicles available in apartments:
| Here: | 1.8 |
| city: | 1.4 |
Percentage of units with a mortgage:
| Northwood: | 65.7% |
| Vancouver: | 64.8% |
Average estimated value of detached houses in 2022 (83.9% of all units):
| Northwood: | $503,564 |
| Washington: | $734,307 |
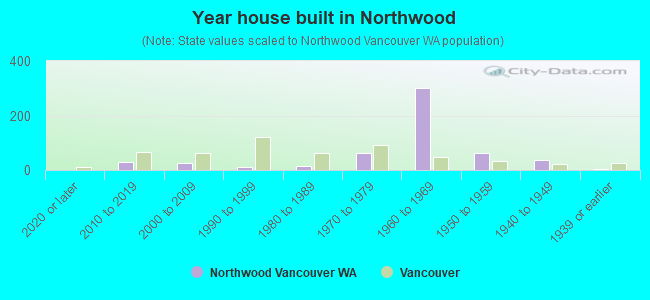
- Year house built in Northwood
- 02020 or later
- 292010 to 2019
- 262000 to 2009
- 111990 to 1999
- 151980 to 1989
- 621970 to 1979
- 3011960 to 1969
- 631950 to 1959
- 361940 to 1949
- 21939 or earlier
City-data.com crime index for city in 2020 (higher means more crime):
| City: | 339.4 |
| U.S. average: | 219.5 |
Travel time to work (commute)
![Travel time to work (commute)]()
- 2Less than 5 minutes
- 165 to 9 minutes
- 7010 to 14 minutes
- 6315 to 19 minutes
- 3620 to 24 minutes
- 3025 to 29 minutes
- 6230 to 34 minutes
- 635 to 39 minutes
- 1140 to 44 minutes
- 3845 to 59 minutes
- 1660 to 89 minutes
- 990 or more minutes

Means of transportation to work
![Means of transportation to work]()
- 74.8%443Drove a car alone
- 10.8%64Carpooled
- 4.9%29Bus
- 1.9%11Subway or elevated rail
- 0.7%4Motorcycle
- 0.8%5Walked
- 2.7%16Other means
- 10.5%62Worked at home

Time leaving home to go to work
![Time leaving home to go to work]()
- 3112:00 a.m. to 4:59 a.m.
- 115:00 a.m. to 5:29 a.m.
- 135:30 a.m. to 5:59 a.m.
- 286:00 a.m. to 6:29 a.m.
- 196:30 a.m. to 6:59 a.m.
- 477:00 a.m. to 7:29 a.m.
- 287:30 a.m. to 7:59 a.m.
- 468:00 a.m. to 8:29 a.m.
- 268:30 a.m. to 8:59 a.m.
- 229:00 a.m. to 9:59 a.m.
- 1610:00 a.m. to 10:59 a.m.
- 211:00 a.m. to 11:59 a.m.
- 1112:00 p.m. to 3:59 p.m.
- 404:00 p.m. to 11:59 p.m.

Occupations of males:
- Percentage of males in management occupations (except farmers):
Here: 6.6% city: 9.6%
- Percentage of males in business and financial operations occupations:
Here: 1.9% city: 5.2%
- Percentage of males in computer and mathematical occupations:
Here: 3.6% city: 4.9%
- Percentage of males in architecture and engineering occupations:
Here: 2.3% city: 3.6%
- Percentage of males in community and social services occupations:
Here: 1.5% city: 1.0%
- Percentage of males in education, training, and library occupations:
Here: 1.8% city: 2.4%
- Percentage of males in arts, design, entertainment, sports, and media occupations:
Here: 2.7% city: 1.7%
- Percentage of males in healthcare practitioners and technical occupations:
Here: 3.4% city: 2.3%
- Percentage of males in service occupations:
Here: 6.8% city: 12.4%
- Percentage of males in sales and office occupations:
Here: 24.6% city: 15.7%
- Percentage of males in farming, fishing, and forestry occupations:
Here: 1.5% city: 0.5%
- Percentage of males in construction, extraction, and maintenance occupations:
Here: 16.9% city: 11.5%
- Percentage of males in production occupations:
Here: 6.2% city: 8.2%
- Percentage of males in transportation occupations:
Here: 11.7% city: 8.9%
- Percentage of males in material moving occupations:
Here: 6.0% city: 5.8%
Occupations of females:
- Percentage of females in management occupations (except farmers):
Here: 12.5% city: 8.2%
- Percentage of females in business and financial operations occupations:
Here: 4.9% city: 7.3%
- Percentage of females in architecture and engineering occupations:
Here: 1.6% city: 0.7%
- Percentage of females in life, physical, and social science occupations:
Here: 1.1% city: 1.0%
- Percentage of females in community and social services occupations:
Here: 2.9% city: 1.9%
- Percentage of females in education, training, and library occupations:
Here: 9.5% city: 6.5%
- Percentage of females in arts, design, entertainment, sports, and media occupations:
Here: 2.0% city: 2.2%
- Percentage of females in healthcare practitioners and technical occupations:
Here: 13.9% city: 9.1%
- Percentage of females in service occupations:
Here: 21.6% city: 24.5%
- Percentage of females in sales and office occupations:
Here: 26.8% city: 26.7%
- Percentage of females in transportation occupations:
Here: 1.5% city: 2.0%
- Percentage of females in material moving occupations:
Here: 1.6% city: 2.3%
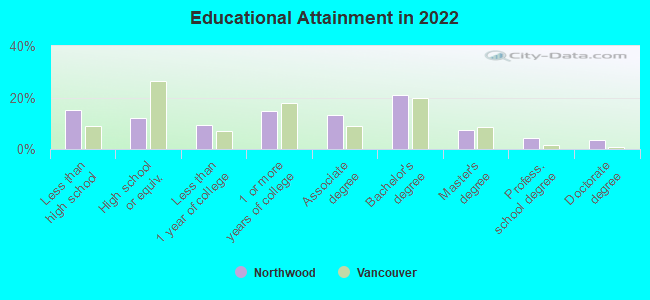
Education in this neighborhood (subdivision or community):
- Percentage of people 3 years and older in K-12 schools:
Northwood: 22.1% Vancouver: 16.4%
- Percentage of people 3 years and older in undergraduate colleges:
Northwood: 4.1% Vancouver: 4.1%
- Percentage of people 3 years and older in grad. or professional schools:
Northwood: 2.9% Vancouver: 1.0%
- Percentage of students K-12 enrolled in private schools:
Northwood: 17.9% Vancouver: 6.8%
Percentage of population below poverty level:
| Northwood: | 14.0% |
| Vancouver: | 10.0% |
Median year owner moved in (as recorded in 2022):
Median year renter moved in (as recorded in 2022):
| Northwood: | 2009 |
| Vancouver: | 2012 |
Median year renter moved in (as recorded in 2022):
| Northwood: | 2018 |
| Vancouver: | 2020 |
Percentage of married-couple families with both working:
| Northwood: | 63.7% |
| Vancouver: | 55.7% |
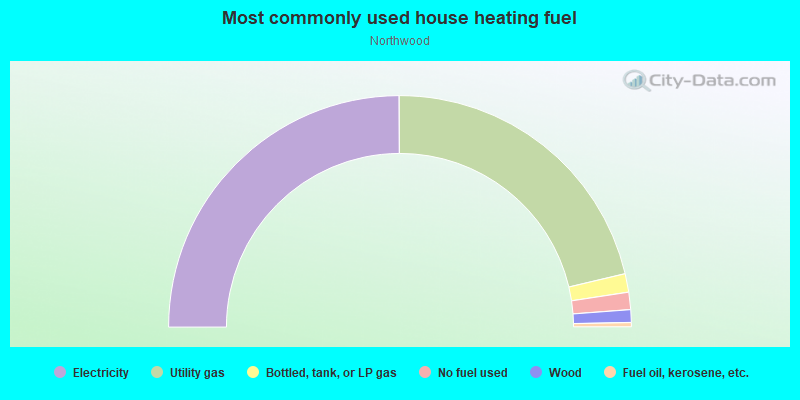
- 49.9%Electricity
- 42.7%Utility gas
- 2.6%Bottled, tank, or LP gas
- 2.4%No fuel used
- 1.8%Wood
- 0.6%Fuel oil, kerosene, etc.
Roads and streets:
Kansas St
Length: 1.18 miles
Directions: E-W, N-S, SE-NW
Address range: 5600 to 7399
Directions: E-W, N-S, SE-NW
Address range: 5600 to 7399
Montana Ln
Length: 0.88 miles
Directions: E-W, N-S, SE-NW, SW-NE
Address range: 1100 to 6799
Directions: E-W, N-S, SE-NW, SW-NE
Address range: 1100 to 6799
E Mill Plain Blvd
Length: 0.76 miles
Direction: E-W
Address range: 6001 to 7199
Direction: E-W
Address range: 6001 to 7199
Indiana St
Length: 0.66 miles
Directions: E-W, SE-NW
Address range: 6900 to 7799
Directions: E-W, SE-NW
Address range: 6900 to 7799
Idaho St
Length: 0.65 miles
Direction: E-W
Address range: 5700 to 6799
Direction: E-W
Address range: 5700 to 6799
NE 14th St
Length: 0.56 miles
Directions: E-W, N-S, SE-NW, SW-NE
Address range: 7100 to 7799
Directions: E-W, N-S, SE-NW, SW-NE
Address range: 7100 to 7799
N Garrison Rd
Length: 0.52 miles
Direction: N-S
Address range: 800 to 1450
Direction: N-S
Address range: 800 to 1450
Topeka Ln
Length: 0.40 miles
Directions: E-W, N-S, SE-NW, SW-NE
Address range: 800 to 7199
Directions: E-W, N-S, SE-NW, SW-NE
Address range: 800 to 7199
Michigan St
Length: 0.29 miles
Directions: E-W, SE-NW
Address range: 7300 to 7749
Directions: E-W, SE-NW
Address range: 7300 to 7749
N Andresen Rd (Andresen Rd)
Length: 0.27 miles
Direction: N-S
Address range: 800 to 1349
Direction: N-S
Address range: 800 to 1349
Wyoming St
Length: 0.25 miles
Direction: E-W
Address range: 6300 to 6699
Direction: E-W
Address range: 6300 to 6699
Iowa Ln
Length: 0.21 miles
Directions: E-W, N-S, SE-NW, SW-NE
Address range: 900 to 7099
Directions: E-W, N-S, SE-NW, SW-NE
Address range: 900 to 7099
Helena Ave
Length: 0.20 miles
Directions: N-S, SW-NE
Address range: 900 to 1299
Directions: N-S, SW-NE
Address range: 900 to 1299
Flint Ave
Length: 0.19 miles
Directions: N-S, SW-NE
Address range: 700 to 999
Directions: N-S, SW-NE
Address range: 700 to 999
Missoula Ave
Length: 0.19 miles
Directions: N-S, SW-NE
Address range: 900 to 1249
Directions: N-S, SW-NE
Address range: 900 to 1249
Pocatello Ave
Length: 0.13 miles
Directions: N-S, SW-NE
Address range: 1100 to 1299
Directions: N-S, SW-NE
Address range: 1100 to 1299
Detroit Ave
Length: 0.11 miles
Directions: E-W, SW-NE
Address range: 700 to 899
Directions: E-W, SW-NE
Address range: 700 to 899
Morrison Ave (N Morrison Rd, NE Morrison Ave)
Length: 0.09 miles
Directions: N-S, SW-NE
Address range: 700 to 899
Directions: N-S, SW-NE
Address range: 700 to 899
Akron Ave
Length: 0.09 miles
Direction: SW-NE
Address range: 600 to 799
Direction: SW-NE
Address range: 600 to 799
Dayton Ave
Length: 0.09 miles
Direction: SW-NE
Address range: 700 to 799
Direction: SW-NE
Address range: 700 to 799
Garrison Ter
Length: 0.08 miles
Direction: N-S
Address range: 600 to 799
Direction: N-S
Address range: 600 to 799
Broadview Ln
Length: 0.06 miles
Direction: E-W
Address range: 6128 to 6144
Direction: E-W
Address range: 6128 to 6144
Billings Ct
Length: 0.04 miles
Direction: SE-NW
Address range: 1200 to 1249
Direction: SE-NW
Address range: 1200 to 1249
Nampa Ct
Length: 0.03 miles
Directions: N-S, SW-NE
Address range: 1200 to 1299
Directions: N-S, SW-NE
Address range: 1200 to 1299