O-Conee (O-Conee Estates) neighborhood in Bay Shore, New York (NY), 11718, 11706 detailed profile
Settings
X


Business Search - 14 Million verified businesses
Area: 0.438 square miles
Population: 2,238
Population density:
| O-Conee (O-Conee Estates): | 5,114 people per square mile |
| Bay Shore: | 5,796 people per square mile |

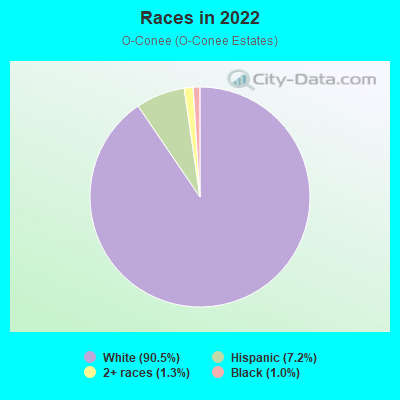
- 2,07390.5%White
- 1657.2%Hispanic or Latino
- 291.3%Two or more races
- 221.0%Black
- 20.09%Asian

Median household income in 2022:
| O-Conee (O-Conee Estates): | $189,000 |
| Bay Shore: | $103,272 |
Distribution of median household income
![Distribution of median household income]()
- 2$10,000 to $19,999
- 5$20,000 to $29,999
- 17$30,000 to $39,999
- 34$40,000 to $49,999
- 9$50,000 to $59,999
- 29$60,000 to $74,999
- 36$75,000 to $99,999
- 47$100,000 to $124,999
- 82$125,000 to $149,999
- 120$150,000 to $199,999
- 292$200,000 or more

Distribution of owner-occupied house/condo value
![Distribution of owner-occupied house/condo value]()
- 3Less than $50,000
- 32$50,000 to $99,999
- 11$100,000 to $149,999
- 1$150,000 to $199,999
- 2$300,000 to $399,999
- 18$400,000 to $499,999
- 184$500,000 to $749,999
- 168$750,000 to $999,999
- 216$1,000,000 or more

Distribution of rent paid by renters
![Distribution of rent paid by renters]()
- 5$1,500 to $1,999
- 12$2,000 or more

| Males: | 1,121 |
| Females: | 1,116 |
Males:
| This neighborhood: | 39.4 years |
| Whole city: | 35.0 years |
| This neighborhood: | 37.4 years |
| Whole city: | 38.1 years |
Average household size:
| O-Conee (O-Conee Estates): | 3.4 people |
| Bay Shore: | 3.1 people |
Percentage of family households:
| O-Conee (O-Conee Estates): | 71.5% |
| Bay Shore: | 46.8% |
| Here: | 82.0% |
| Bay Shore: | 43.8% |
Percentage of married-couple families with children (among all households):
| O-Conee (O-Conee Estates): | 29.1% |
| Bay Shore: | 24.1% |
Percentage of single-mother households (among all households):
| O-Conee (O-Conee Estates): | 0.5% |
| Bay Shore: | 7.1% |
Percentage of never married males 15 years old and over:
Percentage of never married females 15 years old and over:
| O-Conee (O-Conee Estates): | 16.8% |
| Bay Shore: | 22.6% |
Percentage of never married females 15 years old and over:
| O-Conee (O-Conee Estates): | 11.3% |
| place: | 17.6% |
Percentage of people that speak English not well or not at all:
| O-Conee (O-Conee Estates): | 0.0% |
| Bay Shore: | 6.1% |
Percentage of people born in this state:
Percentage of people born in another U.S. state:
Percentage of native residents but born outside the U.S.:
Percentage of foreign born residents:
| Here: | 87.5% |
| Bay Shore: | 63.0% |
Percentage of people born in another U.S. state:
| O-Conee (O-Conee Estates): | 5.7% |
| Bay Shore: | 5.5% |
Percentage of native residents but born outside the U.S.:
| Here: | 1.6% |
| place: | 3.8% |
Percentage of foreign born residents:
| Here: | 5.2% |
| Bay Shore: | 27.7% |
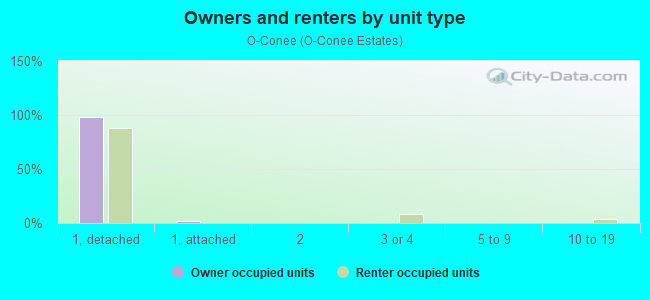
Owner-occupied
Renter-occupied

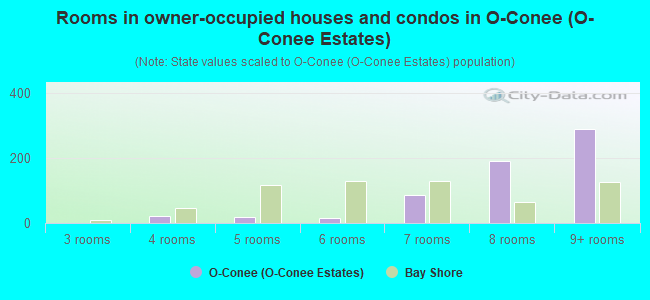
- Rooms in owner-occupied houses and condos in O-Conee <
> - 01 room
- 02 rooms
- 03 rooms
- 234 rooms
- 175 rooms
- 166 rooms
- 857 rooms
- 1928 rooms
- 2899+ rooms
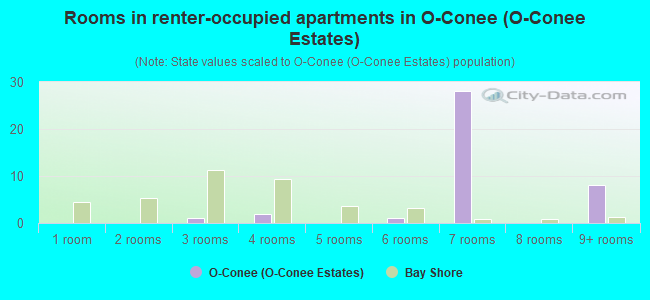
- Rooms in renter-occupied apartments in O-Conee <
> - 01 room
- 02 rooms
- 13 rooms
- 24 rooms
- 05 rooms
- 16 rooms
- 287 rooms
- 08 rooms
- 89+ rooms
Owner-occupied
Renter-occupied
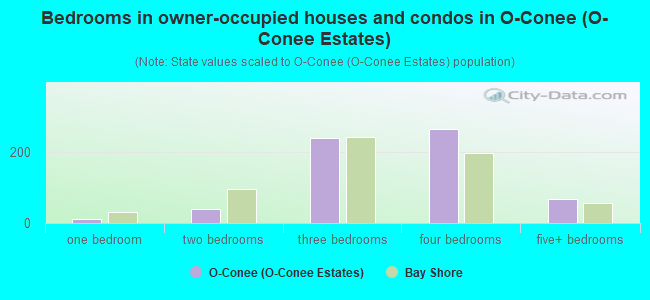
- Bedrooms in owner-occupied houses and condos in O-Conee <
> - 0no bedroom
- 101 bedroom
- 402 bedrooms
- 2403 bedrooms
- 2644 bedrooms
- 675+ bedrooms
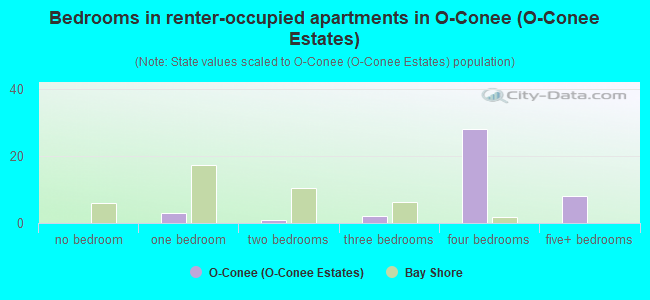
- Bedrooms in renter-occupied apartments in O-Conee <
> - 0no bedroom
- 31 bedroom
- 12 bedrooms
- 23 bedrooms
- 284 bedrooms
- 85+ bedrooms
Average number of cars or other vehicles available in houses/condos:
Average number of cars or other vehicles available in apartments:
| This neighborhood: | 0.8 |
| Bay Shore: | 2.1 |
Average number of cars or other vehicles available in apartments:
| Here: | 0.4 |
| place: | 1.2 |
Percentage of units with a mortgage:
| O-Conee (O-Conee Estates): | 78.1% |
| Bay Shore: | 70.9% |
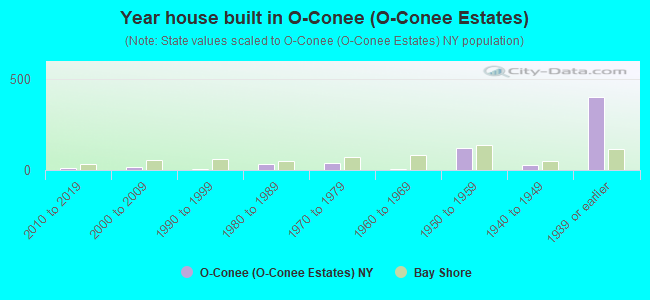
- Year house built in O-Conee <
> - 02020 or later
- 102010 to 2019
- 172000 to 2009
- 71990 to 1999
- 321980 to 1989
- 371970 to 1979
- 51960 to 1969
- 1221950 to 1959
- 281940 to 1949
- 4001939 or earlier
Travel time to work (commute)
![Travel time to work (commute)]()
- 14Less than 5 minutes
- 375 to 9 minutes
- 5010 to 14 minutes
- 4115 to 19 minutes
- 4720 to 24 minutes
- 1525 to 29 minutes
- 3330 to 34 minutes
- 135 to 39 minutes
- 1640 to 44 minutes
- 4645 to 59 minutes
- 1960 to 89 minutes
- 1690 or more minutes

Means of transportation to work
![Means of transportation to work]()
- 58.1%672Drove a car alone
- 2.6%30Carpooled
- 0.9%10Bus
- 3.6%42Long-distance train or commuter rail
- 3.4%39Walked
- 5.0%58Other means
- 26.1%302Worked at home

Time leaving home to go to work
![Time leaving home to go to work]()
- 212:00 a.m. to 4:59 a.m.
- 65:00 a.m. to 5:29 a.m.
- 85:30 a.m. to 5:59 a.m.
- 266:00 a.m. to 6:29 a.m.
- 126:30 a.m. to 6:59 a.m.
- 577:00 a.m. to 7:29 a.m.
- 137:30 a.m. to 7:59 a.m.
- 768:00 a.m. to 8:29 a.m.
- 308:30 a.m. to 8:59 a.m.
- 319:00 a.m. to 9:59 a.m.
- 1910:00 a.m. to 10:59 a.m.
- 211:00 a.m. to 11:59 a.m.
- 1512:00 p.m. to 3:59 p.m.
- 104:00 p.m. to 11:59 p.m.

Occupations of males:
- Percentage of males in management occupations (except farmers):
Here: 23.9% place: 11.9%
- Percentage of males in business and financial operations occupations:
Here: 14.1% place: 3.1%
- Percentage of males in computer and mathematical occupations:
Here: 1.6% place: 2.9%
- Percentage of males in architecture and engineering occupations:
Here: 4.8% place: 2.2%
- Percentage of males in life, physical, and social science occupations:
Here: 1.3% place: 0.7%
- Percentage of males in community and social services occupations:
Here: 38.7% place: 1.4%
- Percentage of males in legal occupations:
Here: 3.7% place: 3.0%
- Percentage of males in education, training, and library occupations:
Here: 2.7% place: 2.1%
- Percentage of males in arts, design, entertainment, sports, and media occupations:
Here: 2.7% place: 1.3%
- Percentage of males in healthcare practitioners and technical occupations:
Here: 9.5% place: 2.8%
- Percentage of males in service occupations:
Here: 15.6% place: 14.9%
- Percentage of males in sales and office occupations:
Here: 15.4% place: 15.5%
- Percentage of males in construction, extraction, and maintenance occupations:
Here: 1.6% place: 9.5%
- Percentage of males in production occupations:
Here: 1.9% place: 6.1%
- Percentage of males in transportation occupations:
Here: 27.3% place: 13.9%
- Percentage of males in material moving occupations:
Here: 1.3% place: 5.9%
Occupations of females:
- Percentage of females in management occupations (except farmers):
Here: 13.9% place: 5.5%
- Percentage of females in business and financial operations occupations:
Here: 2.9% place: 4.7%
- Percentage of females in computer and mathematical occupations:
Here: 1.8% place: 0.5%
- Percentage of females in architecture and engineering occupations:
Here: 2.9% place: 0.0%
- Percentage of females in life, physical, and social science occupations:
Here: 2.9% place: 0.6%
- Percentage of females in community and social services occupations:
Here: 1.8% place: 4.3%
- Percentage of females in legal occupations:
Here: 15.7% place: 0.6%
- Percentage of females in education, training, and library occupations:
Here: 22.7% place: 15.5%
- Percentage of females in arts, design, entertainment, sports, and media occupations:
Here: 7.0% place: 1.1%
- Percentage of females in healthcare practitioners and technical occupations:
Here: 3.3% place: 8.3%
- Percentage of females in service occupations:
Here: 3.7% place: 18.3%
- Percentage of females in sales and office occupations:
Here: 29.7% place: 32.4%
- Percentage of females in construction, extraction, and maintenance occupations:
Here: 5.1% place: 0.3%
- Percentage of females in production occupations:
Here: 2.2% place: 4.4%
- Percentage of females in transportation occupations:
Here: 44.0% place: 1.4%
Percentage of people 16-64 in Armed Forces:
| O-Conee (O-Conee Estates): | 0.3% |
| Bay Shore: | 0.1% |
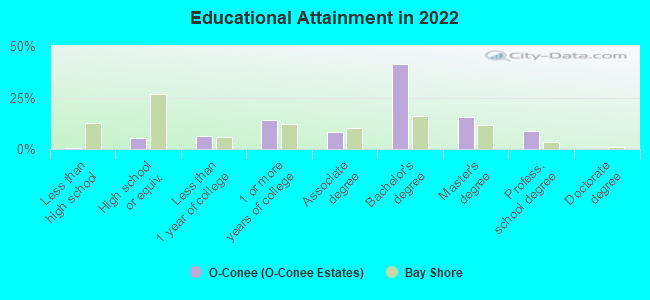
Education in this neighborhood (subdivision or community):
- Percentage of people 3 years and older in K-12 schools:
O-Conee (O-Conee Estates): 25.8% Bay Shore: 20.7%
- Percentage of people 3 years and older in undergraduate colleges:
O-Conee (O-Conee Estates): 3.4% Bay Shore: 5.1%
- Percentage of people 3 years and older in grad. or professional schools:
O-Conee (O-Conee Estates): 0.4% Bay Shore: 1.4%
- Percentage of students K-12 enrolled in private schools:
O-Conee (O-Conee Estates): 11.1% Bay Shore: 4.6%
Percentage of population below poverty level:
| O-Conee (O-Conee Estates): | 0.3% |
| Bay Shore: | 7.3% |
Median year owner moved in (as recorded in 2022):
| O-Conee (O-Conee Estates): | 2010 |
| Bay Shore: | 2007 |
Percentage of married-couple families with both working:
| O-Conee (O-Conee Estates): | 55.3% |
| Bay Shore: | 71.1% |
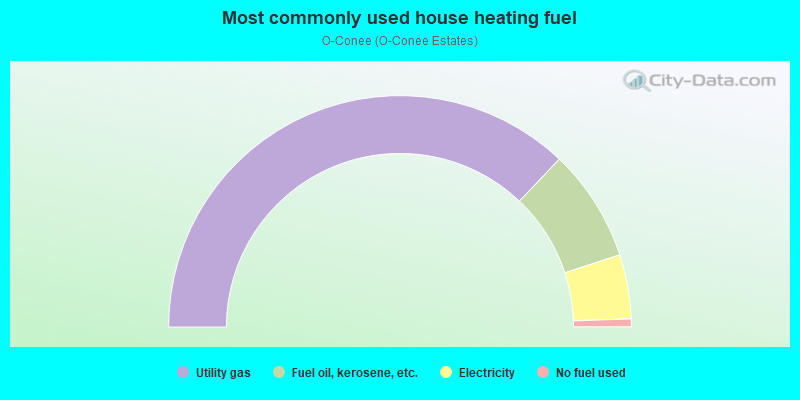
- 74.2%Utility gas
- 15.7%Fuel oil, kerosene, etc.
- 9.0%Electricity
- 1.1%No fuel used
Highways in this neighborhood:
Montauk Hwy (State Hwy 27A, Main St)
Length: 0.33 miles
Direction: SW-NE
Address range: 219 to 320
Direction: SW-NE
Address range: 219 to 320
Montauk Hwy (State Hwy 27A, S Country Rd)
Length: 0.21 miles
Direction: SW-NE
Direction: SW-NE
W Main St (State Hwy 27A)
Length: 0.04 miles
Direction: SW-NE
Address range: 300 to 316
Direction: SW-NE
Address range: 300 to 316
Roads and streets:
Concourse E
Length: 0.89 miles
Direction: SE-NW
Address range: 38 to 138
Direction: SE-NW
Address range: 38 to 138
West Ln
Length: 0.85 miles
Directions: N-S, SE-NW, SW-NE
Address range: 2 to 105
Directions: N-S, SE-NW, SW-NE
Address range: 2 to 105
Lawrence Ln
Length: 0.81 miles
Directions: N-S, SE-NW
Address range: 1 to 73
Directions: N-S, SE-NW
Address range: 1 to 73
S Windsor Ave
Length: 0.77 miles
Direction: SE-NW
Address range: 2 to 198
Direction: SE-NW
Address range: 2 to 198
Garner Ln
Length: 0.72 miles
Directions: E-W, SE-NW
Address range: 1 to 99
Directions: E-W, SE-NW
Address range: 1 to 99
Manatuck Ln
Length: 0.43 miles
Directions: SE-NW, SW-NE
Directions: SE-NW, SW-NE
Cove Walk
Length: 0.13 miles
Direction: SW-NE
Direction: SW-NE
Windsor Pl
Length: 0.11 miles
Direction: SW-NE
Direction: SW-NE
Lagoon Ct
Length: 0.10 miles
Direction: SW-NE
Direction: SW-NE
Shore Rd E
Length: 0.10 miles
Directions: E-W, SW-NE
Address range: 10 to 31
Directions: E-W, SW-NE
Address range: 10 to 31
Marine Ct
Length: 0.10 miles
Direction: SW-NE
Direction: SW-NE
Oconee Walk
Length: 0.08 miles
Direction: SW-NE
Direction: SW-NE