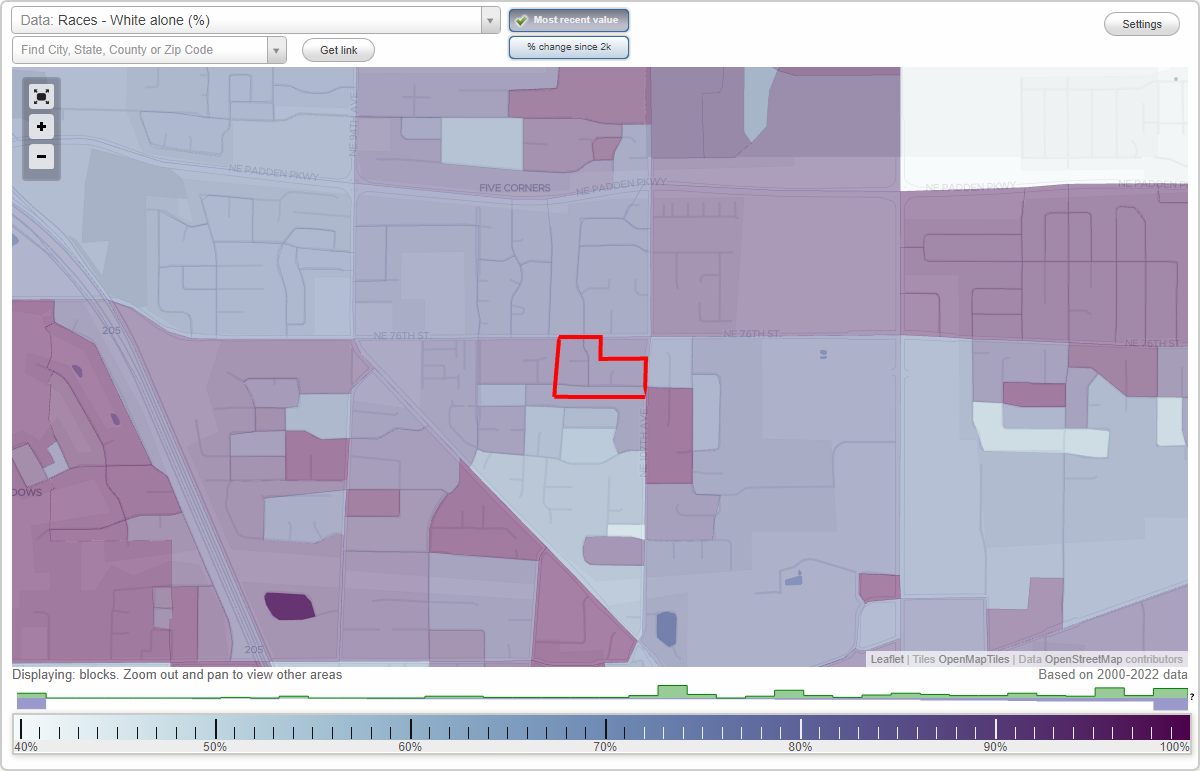
Orchard Crest neighborhood in Vancouver, Washington (WA), 98662 detailed profile
Settings
X

Business Search - 14 Million verified businesses
Area: 0.019 square miles
Population: 84
Population density:
| Orchard Crest: | 4,512 people per square mile |
| Vancouver: | 4,545 people per square mile |

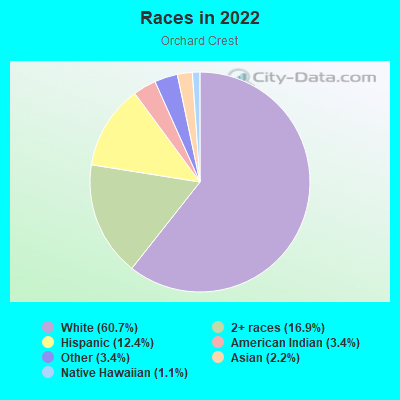
- 5460.7%White
- 1516.9%Two or more races
- 1112.4%Hispanic or Latino
- 33.4%American Indian
- 33.4%Some other race
- 22.2%Asian
- 11.1%Native Hawaiian and Other
Pacific Islander
Median household income in 2022:
| Orchard Crest: | $84,125 |
| Vancouver: | $76,799 |
Distribution of median household income
![Distribution of median household income]()
- 1Less than $10,000
- 1$10,000 to $19,999
- 3$20,000 to $29,999
- 3$30,000 to $39,999
- 5$40,000 to $49,999
- 7$50,000 to $59,999
- 9$60,000 to $74,999
- 4$75,000 to $99,999
- 2$100,000 to $124,999
- 4$125,000 to $149,999
- 3$150,000 to $199,999
- 2$200,000 or more

Distribution of owner-occupied house/condo value
![Distribution of owner-occupied house/condo value]()
- 11Less than $50,000
- 4$50,000 to $99,999
- 1$150,000 to $199,999
- 1$200,000 to $249,999
- 4$250,000 to $299,999
- 7$300,000 to $399,999
- 6$400,000 to $499,999
- 2$500,000 to $749,999
- 1$750,000 to $999,999

Distribution of rent paid by renters
![Distribution of rent paid by renters]()
- 3$600 to $699
- 1$1,250 to $1,499
- 6$1,500 to $1,999
- 1$2,000 or more

Median rent in 2022:
| Orchard Crest: | $1,601 |
| Vancouver: | $1,452 |
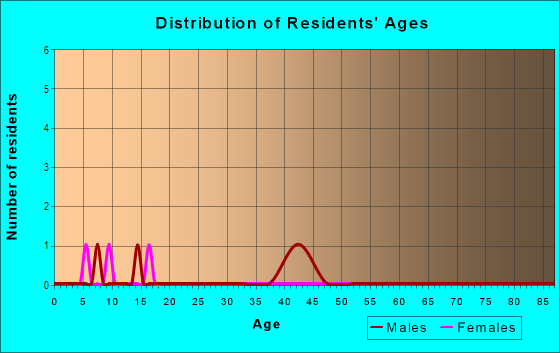
| Males: | 31 |
| Females: | 53 |
Males:
| This neighborhood: | 41.4 years |
| Whole city: | 34.7 years |
| This neighborhood: | 33.1 years |
| Whole city: | 39.9 years |
Average household size:
| Orchard Crest: | 3.2 people |
| Vancouver: | 2.4 people |
Percentage of family households:
| Orchard Crest: | 72.5% |
| Vancouver: | 40.5% |
| Here: | 65.4% |
| Vancouver: | 40.2% |
Percentage of married-couple families with children (among all households):
| Orchard Crest: | 26.1% |
| Vancouver: | 27.2% |
Percentage of single-mother households (among all households):
| Orchard Crest: | 13.1% |
| Vancouver: | 9.7% |
Percentage of never married males 15 years old and over:
Percentage of never married females 15 years old and over:
| Orchard Crest: | 5.3% |
| Vancouver: | 18.8% |
Percentage of never married females 15 years old and over:
| Orchard Crest: | 21.5% |
| city: | 17.6% |
Percentage of people that speak English not well or not at all:
| Orchard Crest: | 0.0% |
| Vancouver: | 4.9% |
Percentage of people born in this state:
Percentage of people born in another U.S. state:
Percentage of native residents but born outside the U.S.:
Percentage of foreign born residents:
| Here: | 43.5% |
| Vancouver: | 30.3% |
Percentage of people born in another U.S. state:
| Orchard Crest: | 48.9% |
| Vancouver: | 54.5% |
Percentage of native residents but born outside the U.S.:
| Here: | 0.0% |
| city: | 1.4% |
Percentage of foreign born residents:
| Here: | 7.6% |
| Vancouver: | 13.8% |
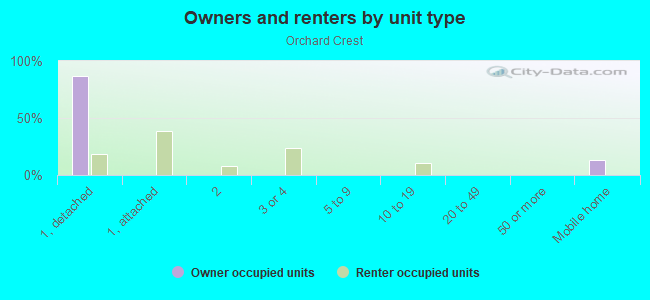
Owner-occupied
Renter-occupied

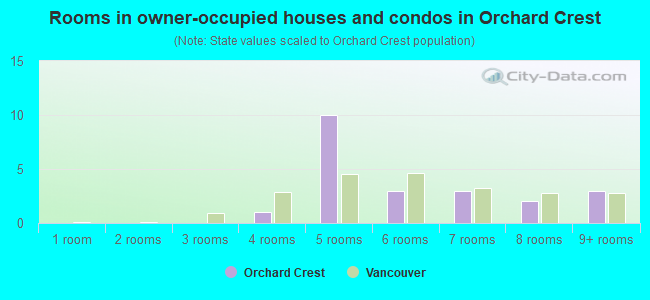
- Rooms in owner-occupied houses and condos in Orchard Crest
- 01 room
- 02 rooms
- 03 rooms
- 14 rooms
- 105 rooms
- 36 rooms
- 37 rooms
- 28 rooms
- 39+ rooms
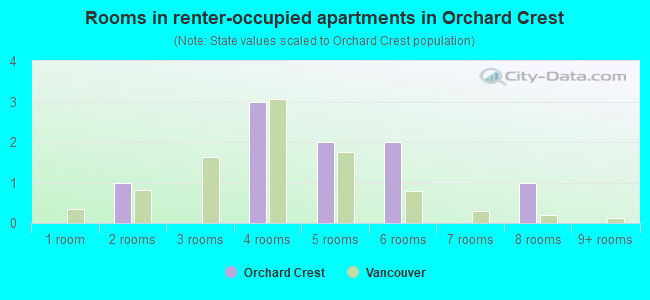
- Rooms in renter-occupied apartments in Orchard Crest
- 01 room
- 12 rooms
- 03 rooms
- 34 rooms
- 25 rooms
- 26 rooms
- 07 rooms
- 18 rooms
- 09+ rooms
Owner-occupied
Renter-occupied
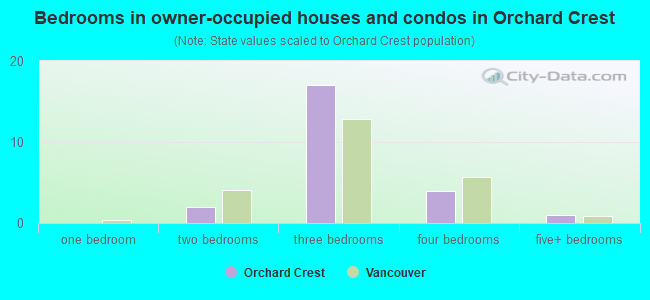
- Bedrooms in owner-occupied houses and condos in Orchard Crest
- 0no bedroom
- 01 bedroom
- 22 bedrooms
- 173 bedrooms
- 44 bedrooms
- 15+ bedrooms
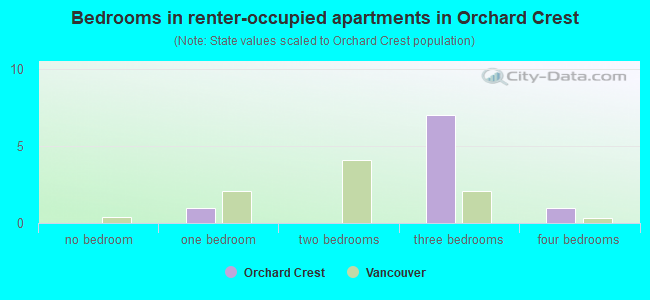
- Bedrooms in renter-occupied apartments in Orchard Crest
- 0no bedroom
- 11 bedroom
- 02 bedrooms
- 73 bedrooms
- 14 bedrooms
- 05+ bedrooms
Average number of cars or other vehicles available in houses/condos:
Average number of cars or other vehicles available in apartments:
| This neighborhood: | 1.8 |
| Vancouver: | 2.2 |
Average number of cars or other vehicles available in apartments:
| Here: | 2.0 |
| city: | 1.4 |
Percentage of units with a mortgage:
| Orchard Crest: | 65.3% |
| Vancouver: | 64.8% |
Housing prices:
- Average estimated value of detached houses in 2022 (65.7% of all units):
Orchard Crest: $335,962 Washington: $734,307
- Average estimated value of mobile home in 2022 (8.6% of all units):
Orchard Crest: $155,733 Washington: $218,362
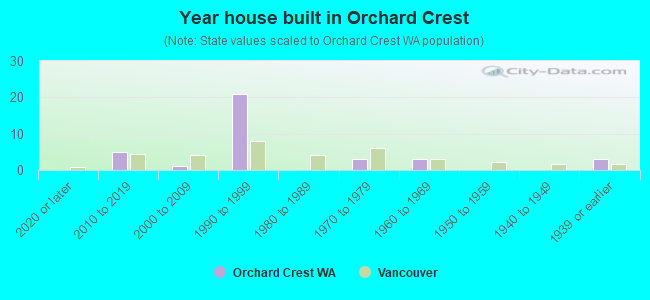
- Year house built in Orchard Crest
- 02020 or later
- 52010 to 2019
- 12000 to 2009
- 211990 to 1999
- 01980 to 1989
- 31970 to 1979
- 31960 to 1969
- 01950 to 1959
- 01940 to 1949
- 31939 or earlier
City-data.com crime index for city in 2020 (higher means more crime):
| City: | 339.4 |
| U.S. average: | 219.5 |
Travel time to work (commute)
![Travel time to work (commute)]()
- 1Less than 5 minutes
- 15 to 9 minutes
- 810 to 14 minutes
- 515 to 19 minutes
- 1120 to 24 minutes
- 325 to 29 minutes
- 730 to 34 minutes
- 135 to 39 minutes
- 245 to 59 minutes
- 190 or more minutes

Means of transportation to work
![Means of transportation to work]()
- 83.7%41Drove a car alone
- 8.2%4Carpooled
- 6.1%3Worked at home

Time leaving home to go to work
![Time leaving home to go to work]()
- 412:00 a.m. to 4:59 a.m.
- 25:00 a.m. to 5:29 a.m.
- 25:30 a.m. to 5:59 a.m.
- 36:00 a.m. to 6:29 a.m.
- 36:30 a.m. to 6:59 a.m.
- 27:00 a.m. to 7:29 a.m.
- 57:30 a.m. to 7:59 a.m.
- 38:00 a.m. to 8:29 a.m.
- 18:30 a.m. to 8:59 a.m.
- 79:00 a.m. to 9:59 a.m.
- 110:00 a.m. to 10:59 a.m.
- 212:00 p.m. to 3:59 p.m.
- 54:00 p.m. to 11:59 p.m.

Occupations of males:
- Percentage of males in management occupations (except farmers):
Here: 8.6% city: 9.6%
- Percentage of males in business and financial operations occupations:
Here: 10.1% city: 5.2%
- Percentage of males in computer and mathematical occupations:
Here: 6.6% city: 4.9%
- Percentage of males in community and social services occupations:
Here: 1.4% city: 1.0%
- Percentage of males in arts, design, entertainment, sports, and media occupations:
Here: 1.7% city: 1.7%
- Percentage of males in service occupations:
Here: 15.5% city: 12.4%
- Percentage of males in farming, fishing, and forestry occupations:
Here: 1.9% city: 0.5%
- Percentage of males in construction, extraction, and maintenance occupations:
Here: 37.3% city: 11.5%
- Percentage of males in production occupations:
Here: 7.8% city: 8.2%
- Percentage of males in material moving occupations:
Here: 9.3% city: 5.8%
Occupations of females:
- Percentage of females in management occupations (except farmers):
Here: 4.1% city: 8.2%
- Percentage of females in business and financial operations occupations:
Here: 9.6% city: 7.3%
- Percentage of females in community and social services occupations:
Here: 8.2% city: 1.9%
- Percentage of females in education, training, and library occupations:
Here: 4.5% city: 6.5%
- Percentage of females in arts, design, entertainment, sports, and media occupations:
Here: 1.2% city: 2.2%
- Percentage of females in service occupations:
Here: 17.8% city: 24.5%
- Percentage of females in sales and office occupations:
Here: 38.0% city: 26.7%
- Percentage of females in construction, extraction, and maintenance occupations:
Here: 1.5% city: 0.2%
- Percentage of females in production occupations:
Here: 5.6% city: 3.4%
- Percentage of females in transportation occupations:
Here: 3.7% city: 2.0%
- Percentage of females in material moving occupations:
Here: 8.5% city: 2.3%
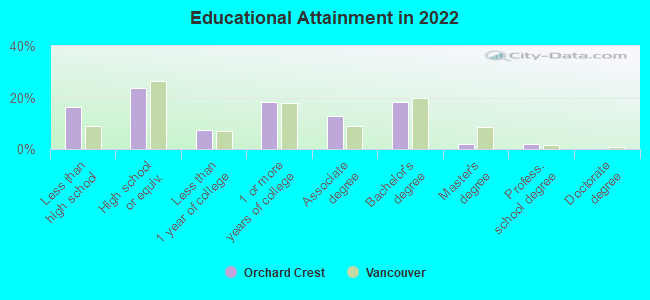
Education in this neighborhood (subdivision or community):
- Percentage of people 3 years and older in K-12 schools:
Orchard Crest: 23.8% Vancouver: 16.4%
- Percentage of people 3 years and older in undergraduate colleges:
Orchard Crest: 3.8% Vancouver: 4.1%
- Percentage of people 3 years and older in grad. or professional schools:
Orchard Crest: 0.0% Vancouver: 1.0%
- Percentage of students K-12 enrolled in private schools:
Orchard Crest: 0.0% Vancouver: 6.8%
Percentage of population below poverty level:
| Orchard Crest: | 10.3% |
| Vancouver: | 10.0% |
Median year owner moved in (as recorded in 2022):
Median year renter moved in (as recorded in 2022):
| Orchard Crest: | 2010 |
| Vancouver: | 2012 |
Median year renter moved in (as recorded in 2022):
| Orchard Crest: | 2017 |
| Vancouver: | 2020 |
Percentage of married-couple families with both working:
| Orchard Crest: | 134.7% |
| Vancouver: | 55.7% |
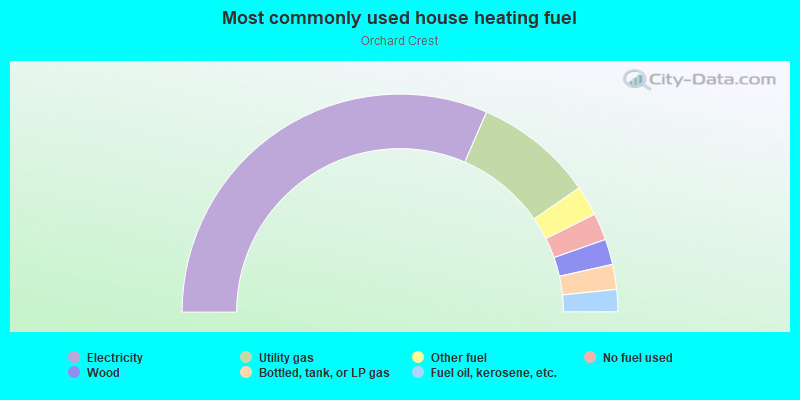
- 63.0%Electricity
- 17.7%Utility gas
- 4.5%Other fuel
- 4.0%No fuel used
- 3.8%Wood
- 3.7%Bottled, tank, or LP gas
- 3.3%Fuel oil, kerosene, etc.
Roads and streets:
NE 75th St
Length: 0.17 miles
Direction: E-W
Address range: 10400 to 10699
Direction: E-W
Address range: 10400 to 10699
NE 75th Pl
Length: 0.05 miles
Direction: E-W
Address range: 10300 to 10399
Direction: E-W
Address range: 10300 to 10399
NE 104th Ave
Length: 0.05 miles
Direction: N-S
Address range: 7500 to 7516
Direction: N-S
Address range: 7500 to 7516
NE 105th Ct
Length: 0.03 miles
Directions: N-S, SW-NE
Address range: 7500 to 7599
Directions: N-S, SW-NE
Address range: 7500 to 7599