Rose Garden neighborhood in San Jose, California (CA), 95126, 95128 detailed profile
Settings
X


Business Search - 14 Million verified businesses
Area: 0.580 square miles
Population: 3,188
Population density:
| Rose Garden: | 5,501 people per square mile |
| San Jose: | 5,554 people per square mile |

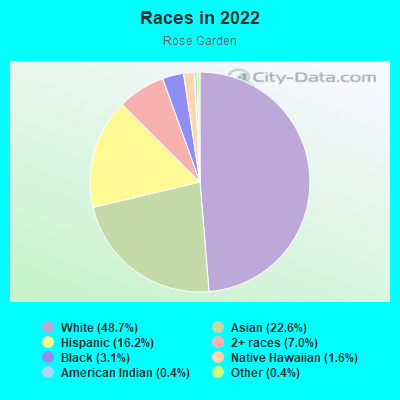
- 1,63148.7%White
- 75722.6%Asian
- 54416.2%Hispanic or Latino
- 2357.0%Two or more races
- 1053.1%Black
- 521.6%Native Hawaiian and Other
Pacific Islander - 140.4%American Indian
- 120.4%Some other race
Median household income in 2022:
| Rose Garden: | $162,717 |
| San Jose: | $133,835 |
Distribution of median household income
![Distribution of median household income]()
- 50Less than $10,000
- 88$10,000 to $19,999
- 125$20,000 to $29,999
- 56$30,000 to $39,999
- 53$40,000 to $49,999
- 41$50,000 to $59,999
- 65$60,000 to $74,999
- 247$75,000 to $99,999
- 82$100,000 to $124,999
- 51$125,000 to $149,999
- 185$150,000 to $199,999
- 674$200,000 or more

Distribution of owner-occupied house/condo value
![Distribution of owner-occupied house/condo value]()
- 20Less than $50,000
- 44$100,000 to $149,999
- 30$150,000 to $199,999
- 13$250,000 to $299,999
- 11$400,000 to $499,999
- 24$500,000 to $749,999
- 46$750,000 to $999,999
- 860$1,000,000 or more

Distribution of rent paid by renters
![Distribution of rent paid by renters]()
- 13$200 to $299
- 185$300 to $399
- 95$500 to $599
- 10$600 to $699
- 133$700 to $799
- 133$800 to $899
- 15$900 to $999
- 44$1,000 to $1,249
- 45$1,250 to $1,499
- 106$1,500 to $1,999
- 392$2,000 or more

Median rent in 2022:
| Rose Garden: | $2,439 |
| San Jose: | $2,001 |
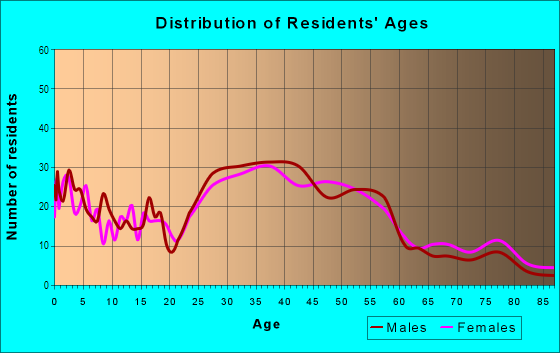
| Males: | 1,693 |
| Females: | 1,495 |
Males:
| This neighborhood: | 38.8 years |
| Whole city: | 37.6 years |
| This neighborhood: | 40.7 years |
| Whole city: | 39.1 years |
Average household size:
| Rose Garden: | 2.4 people |
| San Jose: | 2.9 people |
Percentage of family households:
| Rose Garden: | 48.3% |
| San Jose: | 49.9% |
| Here: | 54.4% |
| San Jose: | 53.0% |
Percentage of married-couple families with children (among all households):
| Rose Garden: | 40.3% |
| San Jose: | 25.8% |
Percentage of single-mother households (among all households):
| Rose Garden: | 4.0% |
| San Jose: | 5.2% |
Percentage of never married males 15 years old and over:
Percentage of never married females 15 years old and over:
| Rose Garden: | 20.9% |
| San Jose: | 20.9% |
Percentage of never married females 15 years old and over:
| Rose Garden: | 14.9% |
| city: | 16.7% |
Percentage of people that speak English not well or not at all:
| Rose Garden: | 1.4% |
| San Jose: | 11.4% |
Percentage of people born in this state:
Percentage of people born in another U.S. state:
Percentage of native residents but born outside the U.S.:
Percentage of foreign born residents:
| Here: | 49.6% |
| San Jose: | 46.1% |
Percentage of people born in another U.S. state:
| Rose Garden: | 18.9% |
| San Jose: | 10.4% |
Percentage of native residents but born outside the U.S.:
| Here: | 2.5% |
| city: | 1.7% |
Percentage of foreign born residents:
| Here: | 29.9% |
| San Jose: | 41.8% |
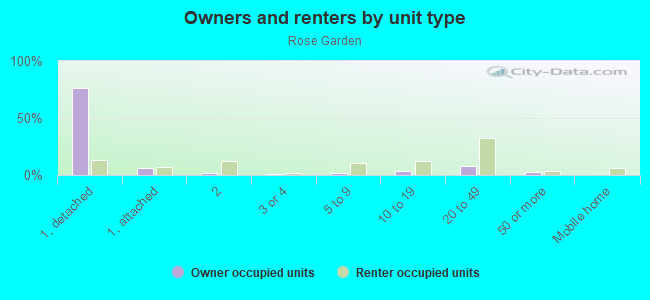
Owner-occupied
Renter-occupied

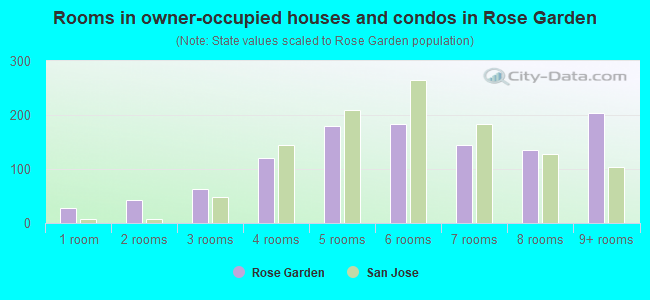
- Rooms in owner-occupied houses and condos in Rose Garden
- 281 room
- 422 rooms
- 633 rooms
- 1204 rooms
- 1795 rooms
- 1846 rooms
- 1447 rooms
- 1358 rooms
- 2039+ rooms
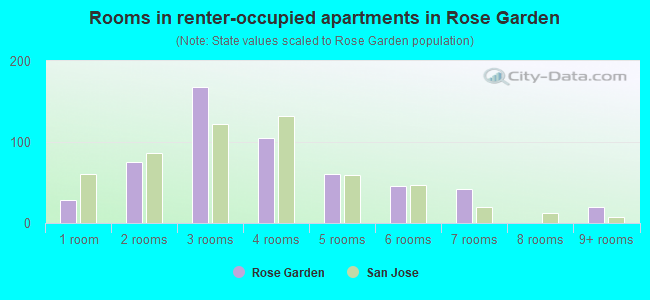
- Rooms in renter-occupied apartments in Rose Garden
- 291 room
- 752 rooms
- 1683 rooms
- 1054 rooms
- 605 rooms
- 466 rooms
- 427 rooms
- 08 rooms
- 209+ rooms
Owner-occupied
Renter-occupied
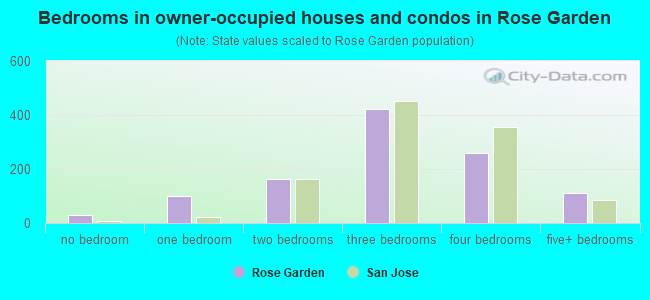
- Bedrooms in owner-occupied houses and condos in Rose Garden
- 28no bedroom
- 1001 bedroom
- 1632 bedrooms
- 4233 bedrooms
- 2584 bedrooms
- 1105+ bedrooms
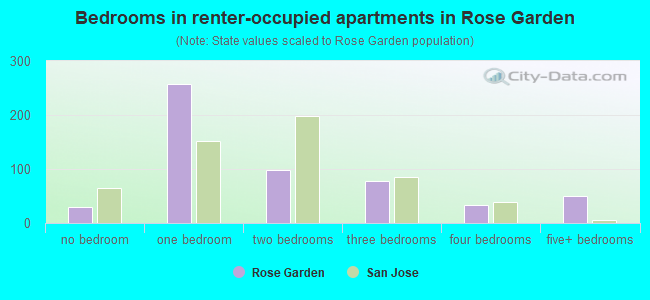
- Bedrooms in renter-occupied apartments in Rose Garden
- 29no bedroom
- 2571 bedroom
- 992 bedrooms
- 773 bedrooms
- 334 bedrooms
- 505+ bedrooms
Average number of cars or other vehicles available in houses/condos:
Average number of cars or other vehicles available in apartments:
| This neighborhood: | 2.5 |
| San Jose: | 2.3 |
Average number of cars or other vehicles available in apartments:
| Here: | 1.2 |
| city: | 1.6 |
Percentage of units with a mortgage:
| Rose Garden: | 73.4% |
| San Jose: | 66.9% |
Average estimated value of detached houses in 2022 (72.0% of all units):
| Rose Garden: | $1,899,347 |
| San Jose: | $1,532,815 |
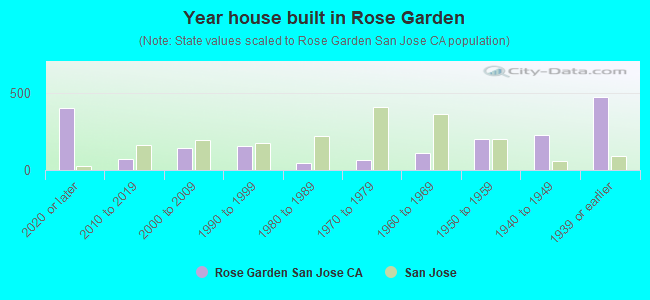
- Year house built in Rose Garden
- 4002020 or later
- 722010 to 2019
- 1402000 to 2009
- 1581990 to 1999
- 481980 to 1989
- 641970 to 1979
- 1091960 to 1969
- 2031950 to 1959
- 2251940 to 1949
- 4691939 or earlier
City-data.com crime index for city in 2020 (higher means more crime):
| City: | 268.4 |
| U.S. average: | 219.5 |
Travel time to work (commute)
![Travel time to work (commute)]()
- 26Less than 5 minutes
- 1435 to 9 minutes
- 23510 to 14 minutes
- 23015 to 19 minutes
- 13520 to 24 minutes
- 9025 to 29 minutes
- 20530 to 34 minutes
- 6035 to 39 minutes
- 3040 to 44 minutes
- 13345 to 59 minutes
- 9060 to 89 minutes
- 3990 or more minutes

Means of transportation to work
![Means of transportation to work]()
- 56.2%981Drove a car alone
- 4.6%80Carpooled
- 8.6%150Bus
- 1.7%30Subway or elevated rail
- 5.0%87Long-distance train or commuter rail
- 6.8%119Light rail, streetcar or trolley
- 6.0%104Taxi
- 3.5%61Motorcycle
- 1.7%29Bicycle
- 2.5%43Walked
- 2.9%50Other means
- 23.8%416Worked at home

Time leaving home to go to work
![Time leaving home to go to work]()
- 5212:00 a.m. to 4:59 a.m.
- 295:00 a.m. to 5:29 a.m.
- 245:30 a.m. to 5:59 a.m.
- 516:00 a.m. to 6:29 a.m.
- 1096:30 a.m. to 6:59 a.m.
- 1797:00 a.m. to 7:29 a.m.
- 2167:30 a.m. to 7:59 a.m.
- 3128:00 a.m. to 8:29 a.m.
- 1388:30 a.m. to 8:59 a.m.
- 1139:00 a.m. to 9:59 a.m.
- 3410:00 a.m. to 10:59 a.m.
- 2411:00 a.m. to 11:59 a.m.
- 6612:00 p.m. to 3:59 p.m.
- 904:00 p.m. to 11:59 p.m.

Occupations of males:
- Percentage of males in management occupations (except farmers):
Here: 29.2% city: 13.0%
- Percentage of males in business and financial operations occupations:
Here: 9.0% city: 4.6%
- Percentage of males in computer and mathematical occupations:
Here: 13.5% city: 13.6%
- Percentage of males in architecture and engineering occupations:
Here: 8.5% city: 10.2%
- Percentage of males in life, physical, and social science occupations:
Here: 3.3% city: 1.1%
- Percentage of males in legal occupations:
Here: 2.4% city: 0.8%
- Percentage of males in education, training, and library occupations:
Here: 2.3% city: 2.8%
- Percentage of males in arts, design, entertainment, sports, and media occupations:
Here: 2.6% city: 1.8%
- Percentage of males in healthcare practitioners and technical occupations:
Here: 3.8% city: 2.0%
- Percentage of males in service occupations:
Here: 8.4% city: 12.7%
- Percentage of males in sales and office occupations:
Here: 6.3% city: 12.8%
- Percentage of males in construction, extraction, and maintenance occupations:
Here: 4.6% city: 7.8%
- Percentage of males in production occupations:
Here: 1.0% city: 5.5%
- Percentage of males in transportation occupations:
Here: 1.9% city: 3.6%
- Percentage of males in material moving occupations:
Here: 2.9% city: 3.1%
Occupations of females:
- Percentage of females in management occupations (except farmers):
Here: 23.3% city: 11.0%
- Percentage of females in business and financial operations occupations:
Here: 8.1% city: 8.6%
- Percentage of females in computer and mathematical occupations:
Here: 5.0% city: 5.4%
- Percentage of females in architecture and engineering occupations:
Here: 5.8% city: 2.8%
- Percentage of females in life, physical, and social science occupations:
Here: 1.2% city: 1.7%
- Percentage of females in community and social services occupations:
Here: 1.7% city: 1.8%
- Percentage of females in education, training, and library occupations:
Here: 12.9% city: 8.1%
- Percentage of females in arts, design, entertainment, sports, and media occupations:
Here: 1.5% city: 2.0%
- Percentage of females in healthcare practitioners and technical occupations:
Here: 8.6% city: 6.8%
- Percentage of females in service occupations:
Here: 11.1% city: 21.7%
- Percentage of females in sales and office occupations:
Here: 15.0% city: 22.0%
- Percentage of females in material moving occupations:
Here: 4.9% city: 1.5%
Percentage of people 16-64 in Armed Forces:
| Rose Garden: | 0.3% |
| San Jose: | 0.0% |
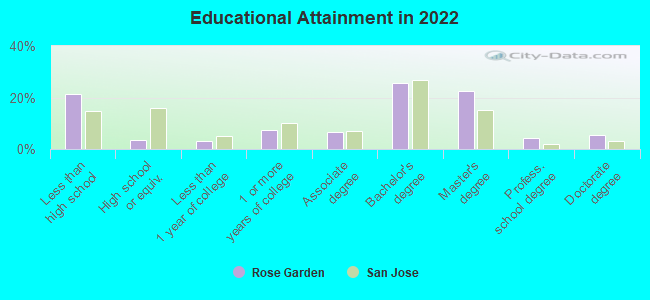
Education in this neighborhood (subdivision or community):
- Percentage of people 3 years and older in K-12 schools:
Rose Garden: 19.0% San Jose: 16.1%
- Percentage of people 3 years and older in undergraduate colleges:
Rose Garden: 9.6% San Jose: 6.5%
- Percentage of people 3 years and older in grad. or professional schools:
Rose Garden: 2.0% San Jose: 2.0%
- Percentage of students K-12 enrolled in private schools:
Rose Garden: 76.8% San Jose: 14.9%
Percentage of population below poverty level:
| Rose Garden: | 7.3% |
| San Jose: | 9.0% |
Median year owner moved in (as recorded in 2022):
Median year renter moved in (as recorded in 2022):
| Rose Garden: | 2008 |
| San Jose: | 2008 |
Median year renter moved in (as recorded in 2022):
| Rose Garden: | 2017 |
| San Jose: | 2020 |
Percentage of married-couple families with both working:
| Rose Garden: | 71.9% |
| San Jose: | 72.5% |
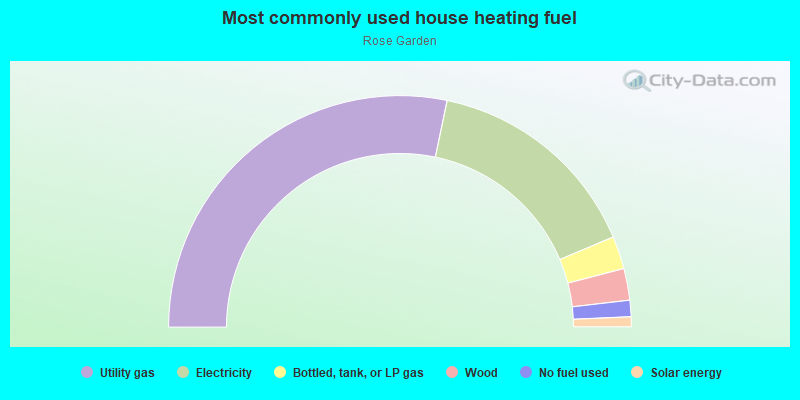
- 56.5%Utility gas
- 30.7%Electricity
- 4.6%Bottled, tank, or LP gas
- 4.4%Wood
- 2.3%No fuel used
- 1.4%Solar energy
Limited-access highways (interstate or state) in this neighborhood:
Nimitz Fwy (I- 880)
Length: 0.78 miles
Directions: E-W, SW-NE
Directions: E-W, SW-NE
Highways in this neighborhood:
The Alameda (State Hwy 82)
Length: 0.54 miles
Directions: E-W, SE-NW
Address range: 1701 to 1999
Directions: E-W, SE-NW
Address range: 1701 to 1999
Roads and streets:
Naglee Ave
Length: 1.08 miles
Direction: SW-NE
Address range: 1100 to 1899
Direction: SW-NE
Address range: 1100 to 1899
Dana Ave
Length: 0.99 miles
Direction: SE-NW
Address range: 500 to 999
Direction: SE-NW
Address range: 500 to 999
Emory St
Length: 0.83 miles
Directions: E-W, SW-NE
Address range: 1100 to 1699
Directions: E-W, SW-NE
Address range: 1100 to 1699
University Ave
Length: 0.82 miles
Direction: SW-NE
Address range: 1100 to 1699
Direction: SW-NE
Address range: 1100 to 1699
W Hedding St
Length: 0.82 miles
Direction: SW-NE
Address range: 1100 to 1699
Direction: SW-NE
Address range: 1100 to 1699
Davis St
Length: 0.78 miles
Directions: E-W, N-S, SE-NW, SW-NE
Address range: 1200 to 1999
Directions: E-W, N-S, SE-NW, SW-NE
Address range: 1200 to 1999
Mc Kendrie St
Length: 0.67 miles
Direction: SW-NE
Address range: 1100 to 1599
Direction: SW-NE
Address range: 1100 to 1599
Garden Dr
Length: 0.58 miles
Directions: E-W, N-S, SE-NW, SW-NE
Address range: 700 to 999
Directions: E-W, N-S, SE-NW, SW-NE
Address range: 700 to 999
Park Ave
Length: 0.56 miles
Direction: SE-NW
Address range: 1700 to 2049
Direction: SE-NW
Address range: 1700 to 2049
Morse St
Length: 0.55 miles
Directions: E-W, SE-NW
Address range: 700 to 999
Directions: E-W, SE-NW
Address range: 700 to 999
Chapman St
Length: 0.54 miles
Direction: SE-NW
Address range: 700 to 999
Direction: SE-NW
Address range: 700 to 999
el Dorado Ave
Length: 0.28 miles
Directions: E-W, SE-NW, SW-NE
Address range: 1600 to 1999
Directions: E-W, SE-NW, SW-NE
Address range: 1600 to 1999
Mc Daniel Ave
Length: 0.24 miles
Direction: SW-NE
Address range: 1400 to 1599
Direction: SW-NE
Address range: 1400 to 1599
Cleveland Ave
Length: 0.24 miles
Direction: SW-NE
Direction: SW-NE
Burrell Ct
Length: 0.24 miles
Directions: E-W, N-S, SE-NW, SW-NE
Address range: 1448 to 1599
Directions: E-W, N-S, SE-NW, SW-NE
Address range: 1448 to 1599
Topeka Ave
Length: 0.24 miles
Direction: SW-NE
Address range: 1600 to 1849
Direction: SW-NE
Address range: 1600 to 1849
Hadley Ave
Length: 0.19 miles
Direction: SE-NW
Address range: 550 to 700
Direction: SE-NW
Address range: 550 to 700
Brooklyn Ave
Length: 0.16 miles
Direction: SW-NE
Address range: 299 to 1799
Direction: SW-NE
Address range: 299 to 1799
University Way
Length: 0.15 miles
Directions: E-W, SW-NE
Address range: 1600 to 1699
Directions: E-W, SW-NE
Address range: 1600 to 1699
Bel Air Ave
Length: 0.15 miles
Direction: SW-NE
Address range: 1600 to 1699
Direction: SW-NE
Address range: 1600 to 1699
Emerson Ct
Length: 0.13 miles
Direction: SE-NW
Address range: 700 to 799
Direction: SE-NW
Address range: 700 to 799
Trace Ave
Length: 0.13 miles
Direction: SE-NW
Address range: 600 to 699
Direction: SE-NW
Address range: 600 to 699
Katherine Ct
Length: 0.10 miles
Direction: SE-NW
Address range: 900 to 999
Direction: SE-NW
Address range: 900 to 999