Royal Crest Estate neighborhood in Las Vegas, Nevada (NV), 89119 detailed profile
Settings
X

Business Search - 14 Million verified businesses
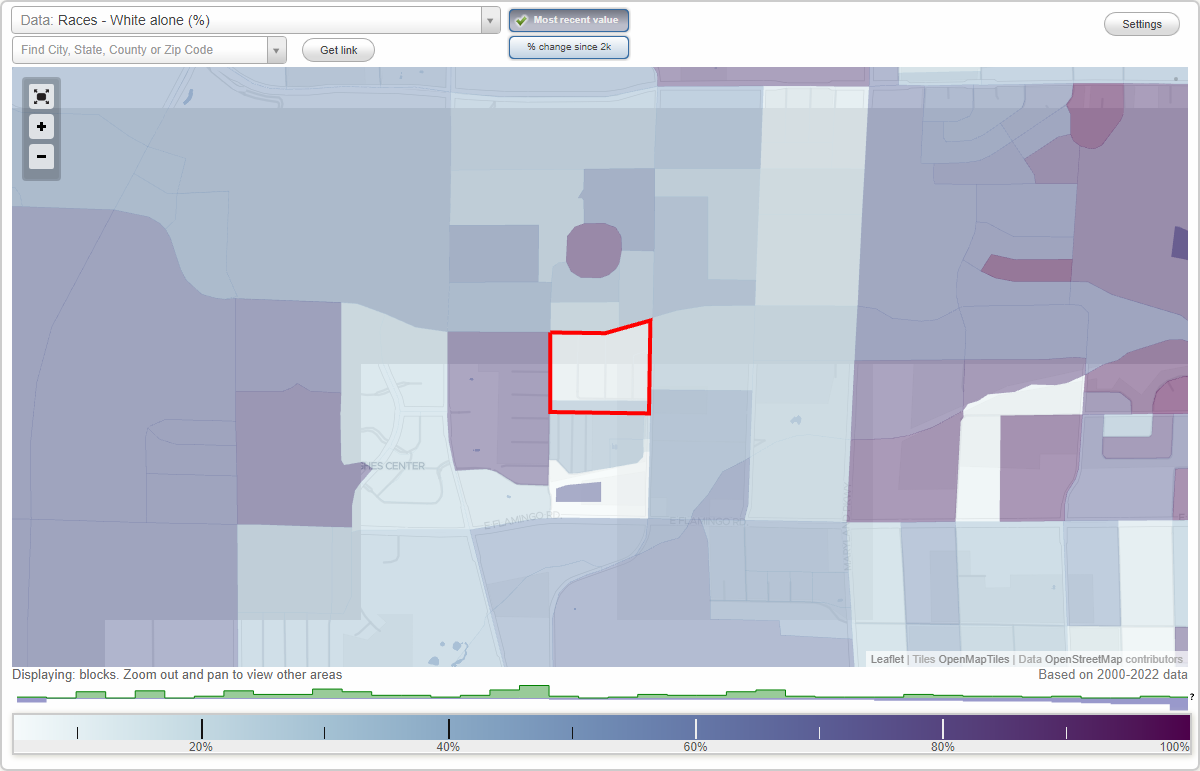
Area: 0.047 square miles
Population: 487
Population density:
| Royal Crest Estate: | 10,318 people per square mile |
| Las Vegas: | 5,792 people per square mile |

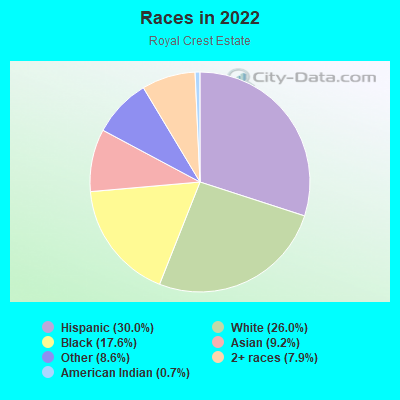
- 16030.0%Hispanic or Latino
- 13926.0%White
- 9417.6%Black
- 499.2%Asian
- 468.6%Some other race
- 427.9%Two or more races
- 40.7%American Indian
Median household income in 2022:
| Royal Crest Estate: | $33,492 |
| Las Vegas: | $68,905 |
Distribution of median household income
![Distribution of median household income]()
- 15Less than $10,000
- 68$10,000 to $19,999
- 40$20,000 to $29,999
- 43$30,000 to $39,999
- 55$40,000 to $49,999
- 48$50,000 to $59,999
- 16$60,000 to $74,999
- 6$75,000 to $99,999
- 16$100,000 to $124,999
- 9$125,000 to $149,999
- 8$150,000 to $199,999
- 12$200,000 or more

Distribution of owner-occupied house/condo value
![Distribution of owner-occupied house/condo value]()
- 3Less than $50,000
- 11$50,000 to $99,999
- 16$100,000 to $149,999
- 7$150,000 to $199,999
- 12$1,000,000 or more

Distribution of rent paid by renters
![Distribution of rent paid by renters]()
- 6$100 to $199
- 15$200 to $299
- 6$300 to $399
- 19$400 to $499
- 23$500 to $599
- 113$600 to $699
- 84$700 to $799
- 77$800 to $899
- 27$900 to $999
- 26$1,000 to $1,249
- 18$1,250 to $1,499
- 14$1,500 to $1,999

Median rent in 2022:
| Royal Crest Estate: | $799 |
| Las Vegas: | $1,277 |
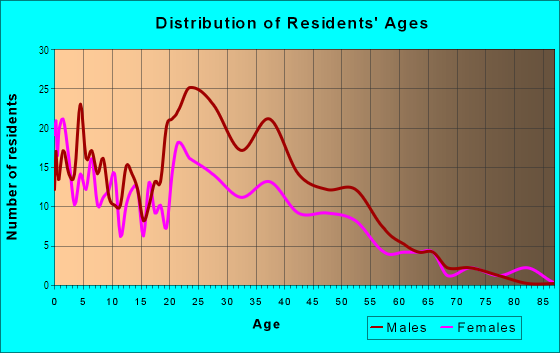
| Males: | 256 |
| Females: | 230 |
Males:
| This neighborhood: | 43.1 years |
| Whole city: | 38.4 years |
| This neighborhood: | 43.2 years |
| Whole city: | 38.9 years |
Average household size:
| Royal Crest Estate: | 1.5 people |
| Las Vegas: | 2.7 people |
Percentage of family households:
| Royal Crest Estate: | 22.5% |
| Las Vegas: | 45.8% |
| Here: | 7.5% |
| Las Vegas: | 40.9% |
Percentage of married-couple families with children (among all households):
| Royal Crest Estate: | 31.4% |
| Las Vegas: | 23.4% |
Percentage of single-mother households (among all households):
| Royal Crest Estate: | 57.7% |
| Las Vegas: | 10.1% |
Percentage of never married males 15 years old and over:
Percentage of never married females 15 years old and over:
| Royal Crest Estate: | 30.1% |
| Las Vegas: | 19.7% |
Percentage of never married females 15 years old and over:
| Royal Crest Estate: | 23.6% |
| city: | 17.0% |
Percentage of people that speak English not well or not at all:
| Royal Crest Estate: | 17.1% |
| Las Vegas: | 7.0% |
Percentage of people born in this state:
Percentage of people born in another U.S. state:
Percentage of native residents but born outside the U.S.:
Percentage of foreign born residents:
| Here: | 15.9% |
| Las Vegas: | 27.3% |
Percentage of people born in another U.S. state:
| Royal Crest Estate: | 47.3% |
| Las Vegas: | 49.8% |
Percentage of native residents but born outside the U.S.:
| Here: | 4.0% |
| city: | 1.9% |
Percentage of foreign born residents:
| Here: | 32.8% |
| Las Vegas: | 21.0% |
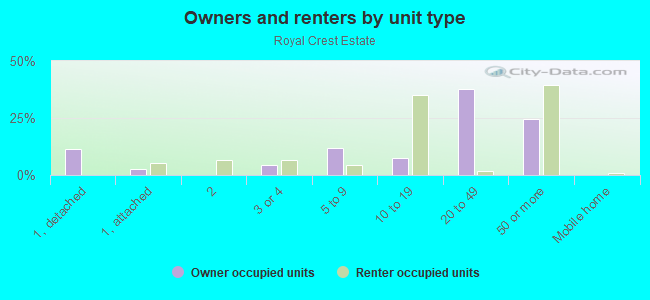
Owner-occupied
Renter-occupied

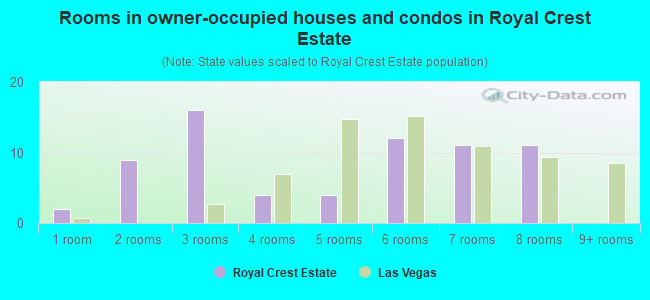
- Rooms in owner-occupied houses and condos in Royal Crest Estate
- 21 room
- 92 rooms
- 163 rooms
- 44 rooms
- 45 rooms
- 126 rooms
- 117 rooms
- 118 rooms
- 09+ rooms
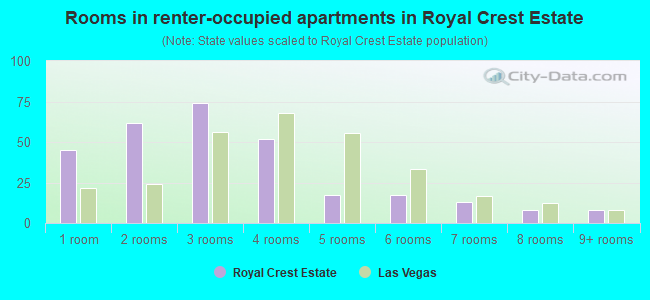
- Rooms in renter-occupied apartments in Royal Crest Estate
- 451 room
- 622 rooms
- 743 rooms
- 524 rooms
- 175 rooms
- 176 rooms
- 137 rooms
- 88 rooms
- 89+ rooms
Owner-occupied
Renter-occupied
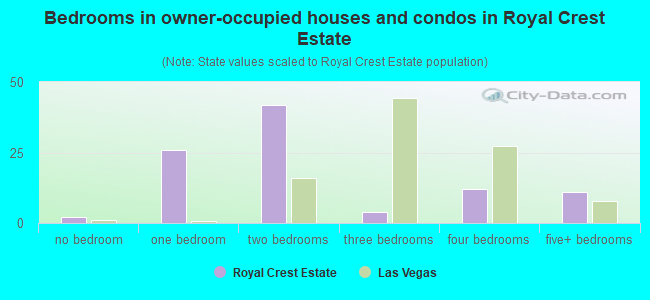
- Bedrooms in owner-occupied houses and condos in Royal Crest Estate
- 2no bedroom
- 261 bedroom
- 422 bedrooms
- 43 bedrooms
- 124 bedrooms
- 115+ bedrooms
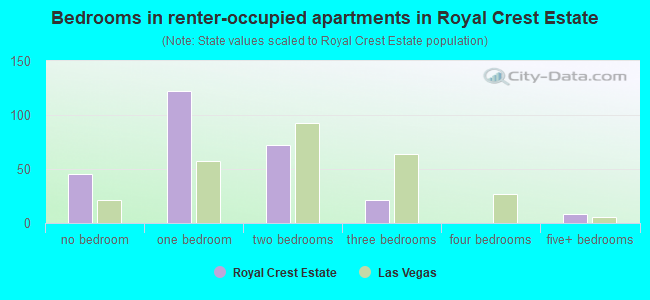
- Bedrooms in renter-occupied apartments in Royal Crest Estate
- 45no bedroom
- 1221 bedroom
- 722 bedrooms
- 213 bedrooms
- 04 bedrooms
- 85+ bedrooms
Average number of cars or other vehicles available in houses/condos:
Average number of cars or other vehicles available in apartments:
| This neighborhood: | |
| Las Vegas: |
Average number of cars or other vehicles available in apartments:
| Here: | 0.7 |
| city: | 1.3 |
Percentage of units with a mortgage:
| Royal Crest Estate: | 61.9% |
| Las Vegas: | 69.3% |
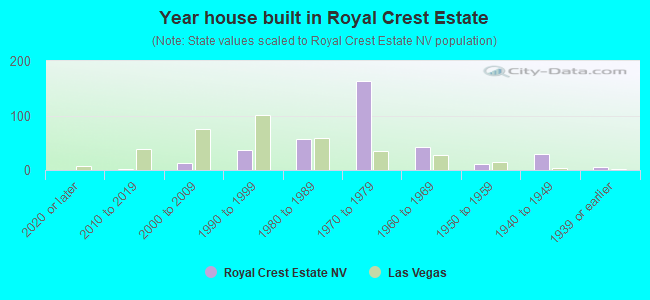
- Year house built in Royal Crest Estate
- 02020 or later
- 22010 to 2019
- 132000 to 2009
- 371990 to 1999
- 571980 to 1989
- 1631970 to 1979
- 421960 to 1969
- 111950 to 1959
- 301940 to 1949
- 51939 or earlier
City-data.com crime index for city in 2020 (higher means more crime):
| City: | 280.7 |
| U.S. average: | 219.5 |
Travel time to work (commute)
![Travel time to work (commute)]()
- 12Less than 5 minutes
- 255 to 9 minutes
- 2110 to 14 minutes
- 7315 to 19 minutes
- 5920 to 24 minutes
- 425 to 29 minutes
- 6030 to 34 minutes
- 540 to 44 minutes
- 2445 to 59 minutes
- 1960 to 89 minutes
- 1490 or more minutes

Means of transportation to work
![Means of transportation to work]()
- 69.0%193Drove a car alone
- 7.2%20Carpooled
- 15.7%44Bus
- 0.7%2Taxi
- 4.3%12Bicycle
- 12.9%36Walked
- 2.5%7Other means
- 1.4%4Worked at home

Time leaving home to go to work
![Time leaving home to go to work]()
- 1412:00 a.m. to 4:59 a.m.
- 275:00 a.m. to 5:29 a.m.
- 15:30 a.m. to 5:59 a.m.
- 336:00 a.m. to 6:29 a.m.
- 46:30 a.m. to 6:59 a.m.
- 417:00 a.m. to 7:29 a.m.
- 277:30 a.m. to 7:59 a.m.
- 28:00 a.m. to 8:29 a.m.
- 168:30 a.m. to 8:59 a.m.
- 129:00 a.m. to 9:59 a.m.
- 1510:00 a.m. to 10:59 a.m.
- 1211:00 a.m. to 11:59 a.m.
- 3912:00 p.m. to 3:59 p.m.
- 534:00 p.m. to 11:59 p.m.

Occupations of males:
- Percentage of males in education, training, and library occupations:
Here: 2.5% city: 2.5%
- Percentage of males in arts, design, entertainment, sports, and media occupations:
Here: 2.1% city: 2.5%
- Percentage of males in service occupations:
Here: 66.7% city: 23.3%
- Percentage of males in sales and office occupations:
Here: 15.7% city: 16.6%
- Percentage of males in construction, extraction, and maintenance occupations:
Here: 3.8% city: 10.6%
- Percentage of males in transportation occupations:
Here: 2.1% city: 6.6%
- Percentage of males in material moving occupations:
Here: 6.0% city: 5.4%
Occupations of females:
- Percentage of females in computer and mathematical occupations:
Here: 9.7% city: 1.1%
- Percentage of females in arts, design, entertainment, sports, and media occupations:
Here: 3.2% city: 1.8%
- Percentage of females in service occupations:
Here: 48.4% city: 26.5%
- Percentage of females in sales and office occupations:
Here: 19.5% city: 30.5%
- Percentage of females in production occupations:
Here: 8.5% city: 1.8%
- Percentage of females in material moving occupations:
Here: 2.7% city: 2.2%
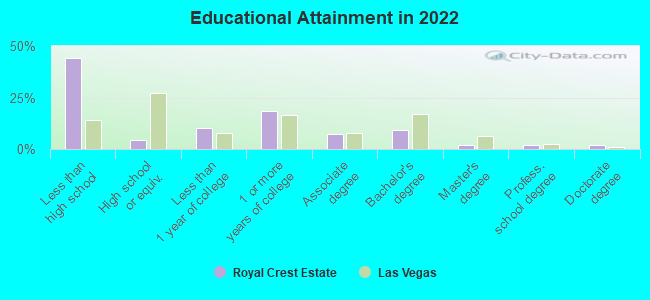
Education in this neighborhood (subdivision or community):
- Percentage of people 3 years and older in K-12 schools:
Royal Crest Estate: 12.9% Las Vegas: 17.4%
- Percentage of people 3 years and older in undergraduate colleges:
Royal Crest Estate: 3.4% Las Vegas: 4.2%
- Percentage of people 3 years and older in grad. or professional schools:
Royal Crest Estate: 0.6% Las Vegas: 1.0%
- Percentage of students K-12 enrolled in private schools:
Royal Crest Estate: 6.6% Las Vegas: 12.9%
Percentage of population below poverty level:
| Royal Crest Estate: | 23.9% |
| Las Vegas: | 14.1% |
Median year renter moved in (as recorded in 2022):
| Royal Crest Estate: | 2016 |
| Las Vegas: | 2020 |
Percentage of married-couple families with both working:
| Royal Crest Estate: | 144.5% |
| Las Vegas: | 62.0% |
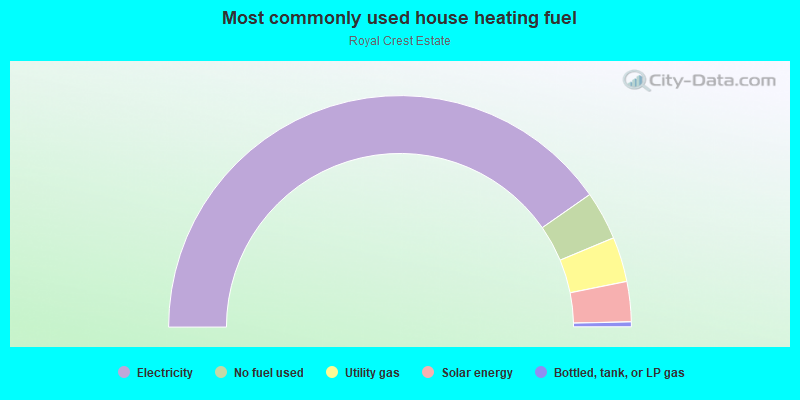
- 80.7%Electricity
- 6.8%No fuel used
- 6.3%Utility gas
- 5.6%Solar energy
- 0.7%Bottled, tank, or LP gas
Roads and streets:
Northrop Ave
Length: 0.21 miles
Directions: E-W, SE-NW
Address range: 500 to 799
Directions: E-W, SE-NW
Address range: 500 to 799
Daisy St
Length: 0.09 miles
Direction: N-S
Address range: 3700 to 3899
Direction: N-S
Address range: 3700 to 3899
Mark Ave
Length: 0.07 miles
Directions: E-W, N-S, SW-NE
Address range: 700 to 799
Directions: E-W, N-S, SW-NE
Address range: 700 to 799