Ryan neighborhood in San Jose, California (CA), 95127 detailed profile
Settings
X


Business Search - 14 Million verified businesses
Area: 0.060 square miles
Population: 678
Population density:
| Ryan: | 11,378 people per square mile |
| San Jose: | 5,554 people per square mile |

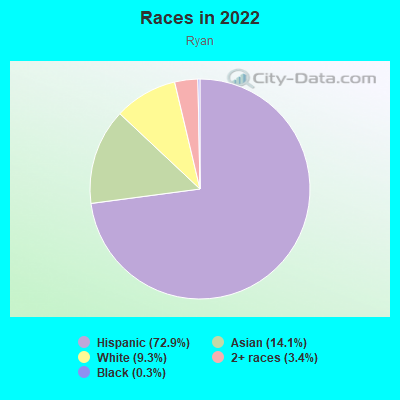
- 51072.9%Hispanic or Latino
- 9914.1%Asian
- 659.3%White
- 243.4%Two or more races
- 20.3%Black
Median household income in 2022:
| Ryan: | $84,712 |
| San Jose: | $133,835 |
Distribution of median household income
![Distribution of median household income]()
- 16$10,000 to $19,999
- 6$20,000 to $29,999
- 10$30,000 to $39,999
- 17$40,000 to $49,999
- 12$50,000 to $59,999
- 20$60,000 to $74,999
- 53$75,000 to $99,999
- 25$100,000 to $124,999
- 8$125,000 to $149,999
- 19$150,000 to $199,999
- 8$200,000 or more

Distribution of owner-occupied house/condo value
![Distribution of owner-occupied house/condo value]()
- 1$50,000 to $99,999
- 2$200,000 to $249,999
- 9$300,000 to $399,999
- 13$400,000 to $499,999
- 7$500,000 to $749,999
- 42$750,000 to $999,999
- 11$1,000,000 or more

Distribution of rent paid by renters
![Distribution of rent paid by renters]()
- 2$800 to $899
- 12$1,250 to $1,499
- 20$1,500 to $1,999
- 87$2,000 or more

Median rent in 2022:
| Ryan: | $2,182 |
| San Jose: | $2,001 |
| Males: | 407 |
| Females: | 270 |
Males:
| This neighborhood: | 21.7 years |
| Whole city: | 37.6 years |
| This neighborhood: | 38.7 years |
| Whole city: | 39.1 years |
Average household size:
| Ryan: | 3.7 people |
| San Jose: | 2.9 people |
Percentage of family households:
| Ryan: | 80.1% |
| San Jose: | 49.9% |
| Here: | 34.4% |
| San Jose: | 53.0% |
Percentage of married-couple families with children (among all households):
| Ryan: | 7.3% |
| San Jose: | 25.8% |
Percentage of single-mother households (among all households):
| Ryan: | 14.8% |
| San Jose: | 5.2% |
Percentage of never married males 15 years old and over:
Percentage of never married females 15 years old and over:
| Ryan: | 32.4% |
| San Jose: | 20.9% |
Percentage of never married females 15 years old and over:
| Ryan: | 20.1% |
| city: | 16.7% |
Percentage of people that speak English not well or not at all:
| Ryan: | 22.1% |
| San Jose: | 11.4% |
Percentage of people born in this state:
Percentage of people born in another U.S. state:
Percentage of native residents but born outside the U.S.:
Percentage of foreign born residents:
| Here: | 60.6% |
| San Jose: | 46.1% |
Percentage of people born in another U.S. state:
| Ryan: | 1.8% |
| San Jose: | 10.4% |
Percentage of native residents but born outside the U.S.:
| Here: | 1.4% |
| city: | 1.7% |
Percentage of foreign born residents:
| Here: | 36.3% |
| San Jose: | 41.8% |
Owner-occupied
Renter-occupied


- Rooms in owner-occupied houses and condos in Ryan
- 21 room
- 02 rooms
- 03 rooms
- 54 rooms
- 365 rooms
- 66 rooms
- 147 rooms
- 88 rooms
- 29+ rooms
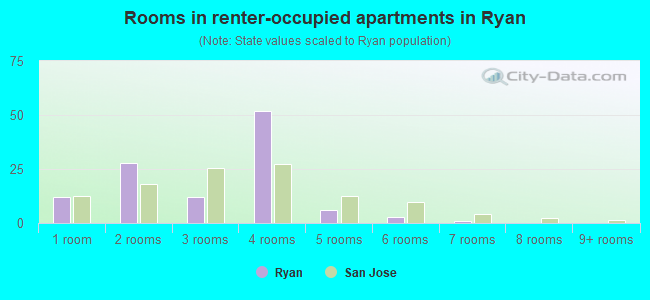
- Rooms in renter-occupied apartments in Ryan
- 121 room
- 282 rooms
- 123 rooms
- 524 rooms
- 65 rooms
- 36 rooms
- 17 rooms
- 08 rooms
- 09+ rooms
Owner-occupied
Renter-occupied
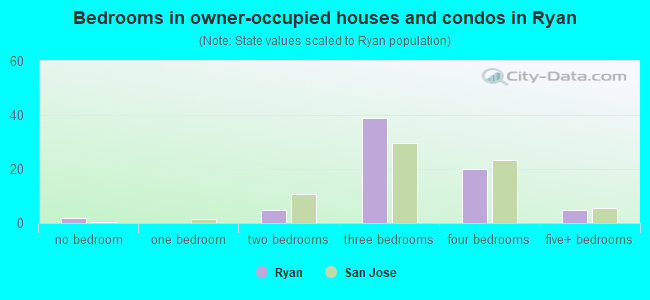
- Bedrooms in owner-occupied houses and condos in Ryan
- 2no bedroom
- 01 bedroom
- 52 bedrooms
- 393 bedrooms
- 204 bedrooms
- 55+ bedrooms
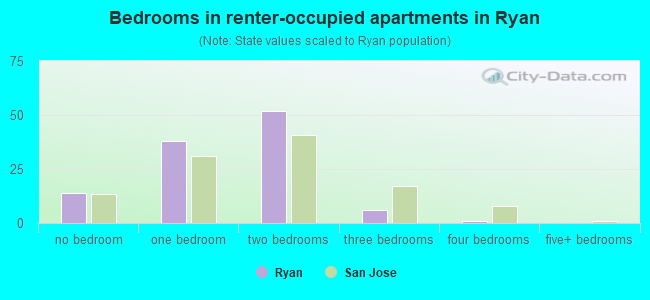
- Bedrooms in renter-occupied apartments in Ryan
- 14no bedroom
- 381 bedroom
- 522 bedrooms
- 63 bedrooms
- 14 bedrooms
- 05+ bedrooms
Average number of cars or other vehicles available in houses/condos:
Average number of cars or other vehicles available in apartments:
| This neighborhood: | 2.7 |
| San Jose: | 2.3 |
Average number of cars or other vehicles available in apartments:
| Here: | 1.7 |
| city: | 1.6 |
Percentage of units with a mortgage:
| Ryan: | 80.5% |
| San Jose: | 66.9% |
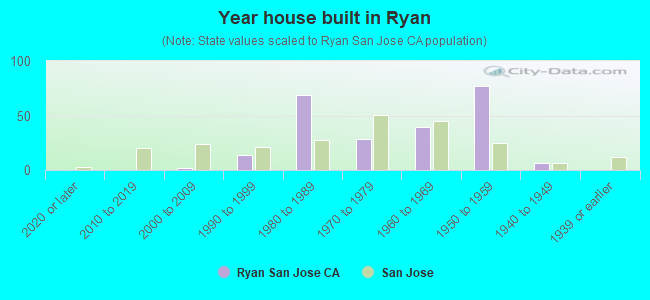
- Year house built in Ryan
- 02020 or later
- 02010 to 2019
- 22000 to 2009
- 141990 to 1999
- 691980 to 1989
- 281970 to 1979
- 391960 to 1969
- 771950 to 1959
- 61940 to 1949
- 01939 or earlier
City-data.com crime index for city in 2020 (higher means more crime):
| City: | 268.4 |
| U.S. average: | 219.5 |
Travel time to work (commute)
![Travel time to work (commute)]()
- 2Less than 5 minutes
- 65 to 9 minutes
- 6510 to 14 minutes
- 7015 to 19 minutes
- 3120 to 24 minutes
- 1325 to 29 minutes
- 5730 to 34 minutes
- 735 to 39 minutes
- 1240 to 44 minutes
- 2545 to 59 minutes
- 1360 to 89 minutes
- 1190 or more minutes

Means of transportation to work
![Means of transportation to work]()
- 59.0%200Drove a car alone
- 23.3%79Carpooled
- 0.6%2Bus
- 0.3%1Long-distance train or commuter rail
- 0.9%3Light rail, streetcar or trolley
- 0.6%2Walked
- 15.6%53Worked at home

Time leaving home to go to work
![Time leaving home to go to work]()
- 2212:00 a.m. to 4:59 a.m.
- 155:00 a.m. to 5:29 a.m.
- 215:30 a.m. to 5:59 a.m.
- 456:00 a.m. to 6:29 a.m.
- 106:30 a.m. to 6:59 a.m.
- 567:00 a.m. to 7:29 a.m.
- 217:30 a.m. to 7:59 a.m.
- 478:00 a.m. to 8:29 a.m.
- 98:30 a.m. to 8:59 a.m.
- 169:00 a.m. to 9:59 a.m.
- 210:00 a.m. to 10:59 a.m.
- 711:00 a.m. to 11:59 a.m.
- 1212:00 p.m. to 3:59 p.m.
- 264:00 p.m. to 11:59 p.m.

Occupations of males:
- Percentage of males in management occupations (except farmers):
Here: 4.0% city: 13.0%
- Percentage of males in business and financial operations occupations:
Here: 2.8% city: 4.6%
- Percentage of males in architecture and engineering occupations:
Here: 9.1% city: 10.2%
- Percentage of males in life, physical, and social science occupations:
Here: 2.5% city: 1.1%
- Percentage of males in community and social services occupations:
Here: 2.1% city: 0.8%
- Percentage of males in service occupations:
Here: 35.8% city: 12.7%
- Percentage of males in sales and office occupations:
Here: 19.8% city: 12.8%
- Percentage of males in construction, extraction, and maintenance occupations:
Here: 8.1% city: 7.8%
- Percentage of males in production occupations:
Here: 6.1% city: 5.5%
- Percentage of males in transportation occupations:
Here: 9.3% city: 3.6%
- Percentage of males in material moving occupations:
Here: 5.7% city: 3.1%
Occupations of females:
- Percentage of females in management occupations (except farmers):
Here: 3.2% city: 11.0%
- Percentage of females in community and social services occupations:
Here: 2.0% city: 1.8%
- Percentage of females in education, training, and library occupations:
Here: 9.4% city: 8.1%
- Percentage of females in arts, design, entertainment, sports, and media occupations:
Here: 1.3% city: 2.0%
- Percentage of females in healthcare practitioners and technical occupations:
Here: 11.8% city: 6.8%
- Percentage of females in service occupations:
Here: 19.5% city: 21.7%
- Percentage of females in sales and office occupations:
Here: 42.5% city: 22.0%
- Percentage of females in farming, fishing, and forestry occupations:
Here: 1.5% city: 0.2%
- Percentage of females in construction, extraction, and maintenance occupations:
Here: 1.4% city: 0.2%
- Percentage of females in production occupations:
Here: 3.9% city: 4.0%
- Percentage of females in transportation occupations:
Here: 6.4% city: 0.7%
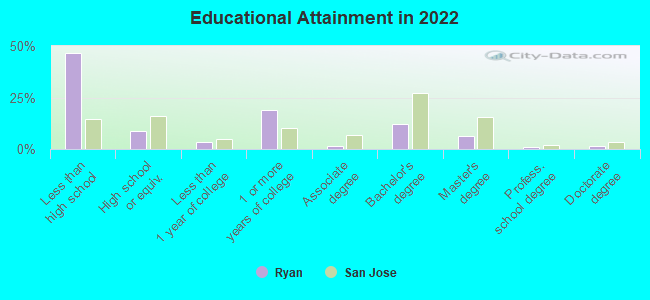
Education in this neighborhood (subdivision or community):
- Percentage of people 3 years and older in K-12 schools:
Ryan: 21.3% San Jose: 16.1%
- Percentage of people 3 years and older in undergraduate colleges:
Ryan: 13.6% San Jose: 6.5%
- Percentage of people 3 years and older in grad. or professional schools:
Ryan: 0.9% San Jose: 2.0%
- Percentage of students K-12 enrolled in private schools:
Ryan: 28.2% San Jose: 14.9%
Percentage of population below poverty level:
| Ryan: | 6.2% |
| San Jose: | 9.0% |
Median year owner moved in (as recorded in 2022):
Median year renter moved in (as recorded in 2022):
| Ryan: | 2005 |
| San Jose: | 2008 |
Median year renter moved in (as recorded in 2022):
| Ryan: | 2014 |
| San Jose: | 2020 |
Percentage of married-couple families with both working:
| Ryan: | 90.8% |
| San Jose: | 72.5% |
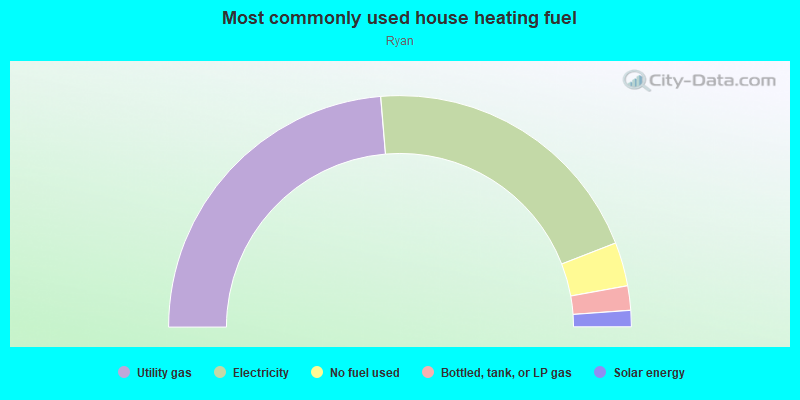
- 47.3%Utility gas
- 40.8%Electricity
- 6.1%No fuel used
- 3.4%Bottled, tank, or LP gas
- 2.3%Solar energy
Roads and streets:
Sussex Dr
Length: 0.21 miles
Directions: N-S, SW-NE
Address range: 2700 to 2799
Directions: N-S, SW-NE
Address range: 2700 to 2799
Sundown Ln
Length: 0.13 miles
Directions: N-S, SE-NW
Address range: 1100 to 1199
Directions: N-S, SE-NW
Address range: 1100 to 1199
Monteagle Dr
Length: 0.11 miles
Directions: E-W, SE-NW
Address range: 1200 to 1299
Directions: E-W, SE-NW
Address range: 1200 to 1299
S Capitol Ave
Length: 0.10 miles
Direction: SE-NW
Address range: 1186 to 1278
Direction: SE-NW
Address range: 1186 to 1278
Singing Rain Pl
Length: 0.10 miles
Directions: N-S, SE-NW, SW-NE
Address range: 2850 to 2899
Directions: N-S, SE-NW, SW-NE
Address range: 2850 to 2899
Mc Ginness Ave
Length: 0.08 miles
Directions: E-W, SE-NW
Address range: 1193 to 1291
Directions: E-W, SE-NW
Address range: 1193 to 1291
Brightside Ct
Length: 0.08 miles
Directions: E-W, SE-NW, SW-NE
Address range: 1100 to 1199
Directions: E-W, SE-NW, SW-NE
Address range: 1100 to 1199
Everglow Ct
Length: 0.04 miles
Direction: SW-NE
Address range: 2900 to 2999
Direction: SW-NE
Address range: 2900 to 2999
Tudor Ct
Length: 0.03 miles
Direction: SW-NE
Address range: 1200 to 1299
Direction: SW-NE
Address range: 1200 to 1299
Capitol Ct
Length: 0.02 miles
Directions: E-W, SW-NE
Address range: 1200 to 1299
Directions: E-W, SW-NE
Address range: 1200 to 1299
Other features:
Silver Crk
Length: 0.06 miles
Direction: SE-NW
Direction: SE-NW