Saint James (St. James) neighborhood in Birmingham, Michigan (MI), 48009 detailed profile
Settings
X


Business Search - 14 Million verified businesses
Area: 0.103 square miles
Population: 707
Population density:
| Saint James (St. James): | 6,897 people per square mile |
| Birmingham: | 4,551 people per square mile |

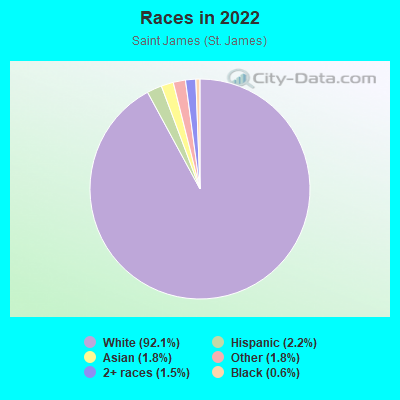
- 66192.1%White
- 162.2%Hispanic or Latino
- 131.8%Asian
- 131.8%Some other race
- 111.5%Two or more races
- 40.6%Black
Median household income in 2022:
| Saint James (St. James): | $185,875 |
| Birmingham: | $151,556 |
Distribution of median household income
![Distribution of median household income]()
- 5Less than $10,000
- 15$10,000 to $19,999
- 25$20,000 to $29,999
- 48$30,000 to $39,999
- 10$40,000 to $49,999
- 41$50,000 to $59,999
- 7$60,000 to $74,999
- 14$75,000 to $99,999
- 6$100,000 to $124,999
- 13$125,000 to $149,999
- 31$150,000 to $199,999
- 151$200,000 or more

Distribution of owner-occupied house/condo value
![Distribution of owner-occupied house/condo value]()
- 26Less than $50,000
- 7$50,000 to $99,999
- 4$100,000 to $149,999
- 22$150,000 to $199,999
- 4$200,000 to $249,999
- 6$250,000 to $299,999
- 58$300,000 to $399,999
- 41$400,000 to $499,999
- 53$500,000 to $749,999
- 48$750,000 to $999,999
- 42$1,000,000 or more

Distribution of rent paid by renters
![Distribution of rent paid by renters]()
- 2$300 to $399
- 6$500 to $599
- 6$900 to $999
- 46$1,000 to $1,249
- 9$1,250 to $1,499
- 15$1,500 to $1,999
- 35$2,000 or more

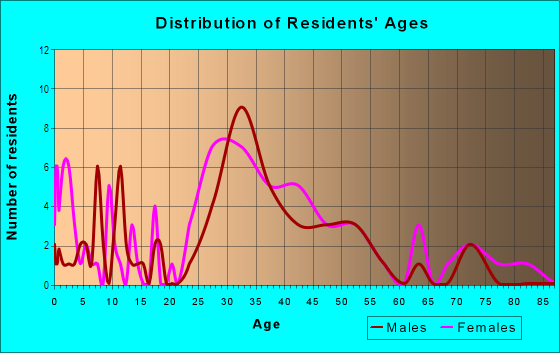
| Males: | 358 |
| Females: | 349 |
Males:
| This neighborhood: | 44.8 years |
| Whole city: | 41.0 years |
| This neighborhood: | 47.8 years |
| Whole city: | 43.2 years |
Average household size:
| Saint James (St. James): | 2.4 people |
| Birmingham: | 2.3 people |
Percentage of family households:
| Saint James (St. James): | 42.4% |
| Birmingham: | 43.8% |
| Here: | 50.4% |
| Birmingham: | 50.8% |
Percentage of married-couple families with children (among all households):
| Saint James (St. James): | 40.8% |
| Birmingham: | 35.7% |
Percentage of single-mother households (among all households):
| Saint James (St. James): | 10.2% |
| Birmingham: | 5.2% |
Percentage of never married males 15 years old and over:
Percentage of never married females 15 years old and over:
| Saint James (St. James): | 12.2% |
| Birmingham: | 12.6% |
Percentage of never married females 15 years old and over:
| Saint James (St. James): | 10.6% |
| city: | 13.4% |
Percentage of people that speak English not well or not at all:
| Saint James (St. James): | 0.0% |
| Birmingham: | 0.2% |
Percentage of people born in this state:
Percentage of people born in another U.S. state:
Percentage of native residents but born outside the U.S.:
Percentage of foreign born residents:
| Here: | 64.2% |
| Birmingham: | 65.9% |
Percentage of people born in another U.S. state:
| Saint James (St. James): | 20.2% |
| Birmingham: | 21.8% |
Percentage of native residents but born outside the U.S.:
| Here: | 1.1% |
| city: | 1.5% |
Percentage of foreign born residents:
| Here: | 14.4% |
| Birmingham: | 10.8% |
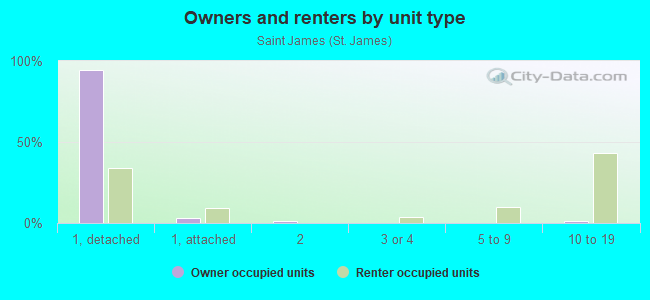
Owner-occupied
Renter-occupied

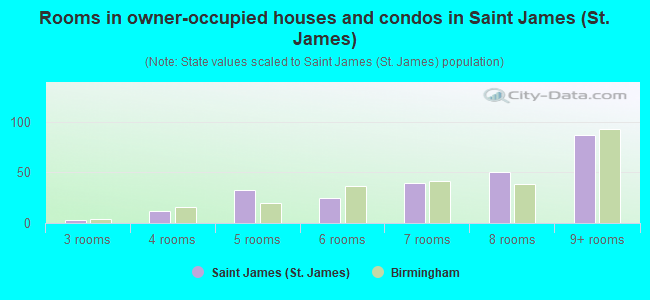
- Rooms in owner-occupied houses and condos in Saint James <
> - 01 room
- 02 rooms
- 33 rooms
- 124 rooms
- 335 rooms
- 256 rooms
- 407 rooms
- 508 rooms
- 879+ rooms
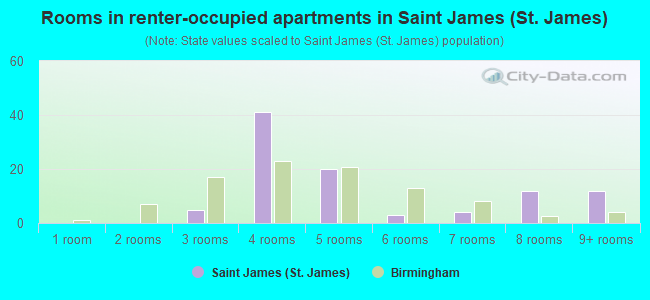
- Rooms in renter-occupied apartments in Saint James <
> - 01 room
- 02 rooms
- 53 rooms
- 414 rooms
- 205 rooms
- 36 rooms
- 47 rooms
- 128 rooms
- 129+ rooms
Owner-occupied
Renter-occupied
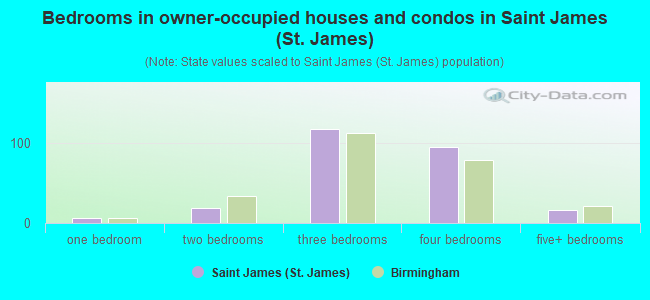
- Bedrooms in owner-occupied houses and condos in Saint James <
> - 0no bedroom
- 61 bedroom
- 192 bedrooms
- 1173 bedrooms
- 944 bedrooms
- 165+ bedrooms
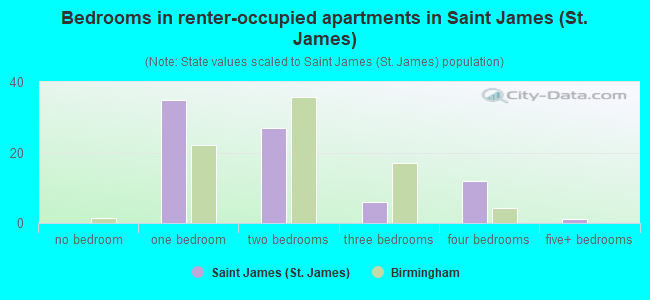
- Bedrooms in renter-occupied apartments in Saint James <
> - 0no bedroom
- 351 bedroom
- 272 bedrooms
- 63 bedrooms
- 124 bedrooms
- 15+ bedrooms
Average number of cars or other vehicles available in houses/condos:
Average number of cars or other vehicles available in apartments:
| This neighborhood: | 1.9 |
| Birmingham: | 1.9 |
Average number of cars or other vehicles available in apartments:
| Here: | |
| city: |
Percentage of units with a mortgage:
| Saint James (St. James): | 68.2% |
| Birmingham: | 69.3% |
Housing prices:
- Average estimated value of detached houses in 2022 (82.0% of all units):
Saint James (St. James): $280,634 Michigan: $280,038
- Average estimated value of townhouses or other attached units in 2022 (1.9% of all units):
This neighborhood: $426,942 Michigan: $239,520
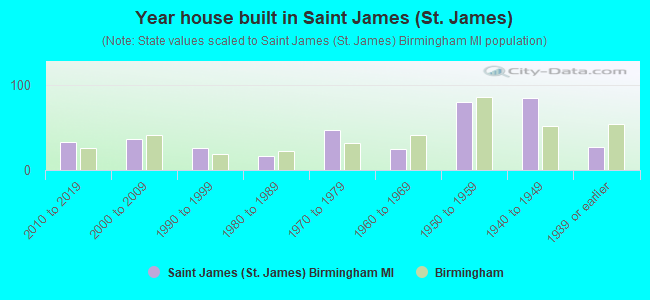
- Year house built in Saint James <
> - 02020 or later
- 332010 to 2019
- 362000 to 2009
- 261990 to 1999
- 161980 to 1989
- 471970 to 1979
- 241960 to 1969
- 791950 to 1959
- 841940 to 1949
- 271939 or earlier
City-data.com crime index for city in 2020 (higher means more crime):
| City: | 27.8 |
| U.S. average: | 219.5 |
Travel time to work (commute)
![Travel time to work (commute)]()
- 8Less than 5 minutes
- 495 to 9 minutes
- 4010 to 14 minutes
- 4915 to 19 minutes
- 4220 to 24 minutes
- 2125 to 29 minutes
- 6630 to 34 minutes
- 2435 to 39 minutes
- 740 to 44 minutes
- 445 to 59 minutes
- 560 to 89 minutes
- 490 or more minutes

Means of transportation to work
![Means of transportation to work]()
- 63.4%249Drove a car alone
- 9.4%37Carpooled
- 1.3%5Bicycle
- 3.1%12Walked
- 23.9%94Worked at home

Time leaving home to go to work
![Time leaving home to go to work]()
- 312:00 a.m. to 4:59 a.m.
- 35:00 a.m. to 5:29 a.m.
- 15:30 a.m. to 5:59 a.m.
- 146:00 a.m. to 6:29 a.m.
- 96:30 a.m. to 6:59 a.m.
- 547:00 a.m. to 7:29 a.m.
- 607:30 a.m. to 7:59 a.m.
- 458:00 a.m. to 8:29 a.m.
- 578:30 a.m. to 8:59 a.m.
- 339:00 a.m. to 9:59 a.m.
- 1510:00 a.m. to 10:59 a.m.
- 211:00 a.m. to 11:59 a.m.
- 612:00 p.m. to 3:59 p.m.
- 114:00 p.m. to 11:59 p.m.

Occupations of males:
- Percentage of males in management occupations (except farmers):
Here: 30.7% city: 28.7%
- Percentage of males in business and financial operations occupations:
Here: 9.0% city: 10.2%
- Percentage of males in architecture and engineering occupations:
Here: 5.5% city: 6.7%
- Percentage of males in legal occupations:
Here: 14.0% city: 9.5%
- Percentage of males in education, training, and library occupations:
Here: 2.2% city: 2.3%
- Percentage of males in arts, design, entertainment, sports, and media occupations:
Here: 2.3% city: 2.5%
- Percentage of males in healthcare practitioners and technical occupations:
Here: 7.3% city: 7.4%
- Percentage of males in service occupations:
Here: 7.0% city: 6.1%
- Percentage of males in sales and office occupations:
Here: 9.0% city: 14.1%
- Percentage of males in construction, extraction, and maintenance occupations:
Here: 6.1% city: 3.4%
- Percentage of males in material moving occupations:
Here: 5.9% city: 1.3%
Occupations of females:
- Percentage of females in management occupations (except farmers):
Here: 24.1% city: 17.0%
- Percentage of females in business and financial operations occupations:
Here: 10.7% city: 12.9%
- Percentage of females in computer and mathematical occupations:
Here: 1.1% city: 2.4%
- Percentage of females in legal occupations:
Here: 10.2% city: 6.0%
- Percentage of females in education, training, and library occupations:
Here: 11.2% city: 5.7%
- Percentage of females in arts, design, entertainment, sports, and media occupations:
Here: 3.4% city: 3.0%
- Percentage of females in healthcare practitioners and technical occupations:
Here: 7.3% city: 13.7%
- Percentage of females in service occupations:
Here: 3.2% city: 13.1%
- Percentage of females in sales and office occupations:
Here: 27.7% city: 19.7%
- Percentage of females in production occupations:
Here: 1.8% city: 0.9%
- Percentage of females in material moving occupations:
Here: 1.8% city: 0.3%
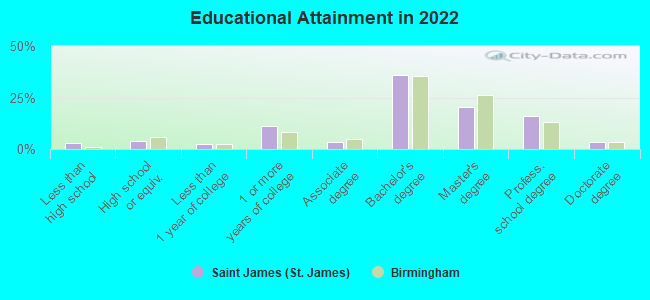
Education in this neighborhood (subdivision or community):
- Percentage of people 3 years and older in K-12 schools:
Saint James (St. James): 20.5% Birmingham: 20.3%
- Percentage of people 3 years and older in undergraduate colleges:
Saint James (St. James): 1.6% Birmingham: 1.7%
- Percentage of people 3 years and older in grad. or professional schools:
Saint James (St. James): 1.9% Birmingham: 1.1%
- Percentage of students K-12 enrolled in private schools:
Saint James (St. James): 23.8% Birmingham: 22.5%
Percentage of population below poverty level:
| Saint James (St. James): | 3.4% |
| Birmingham: | 5.5% |
Median year owner moved in (as recorded in 2022):
| Saint James (St. James): | 2006 |
| Birmingham: | 2009 |
Percentage of married-couple families with both working:
| Saint James (St. James): | 89.5% |
| Birmingham: | 71.9% |
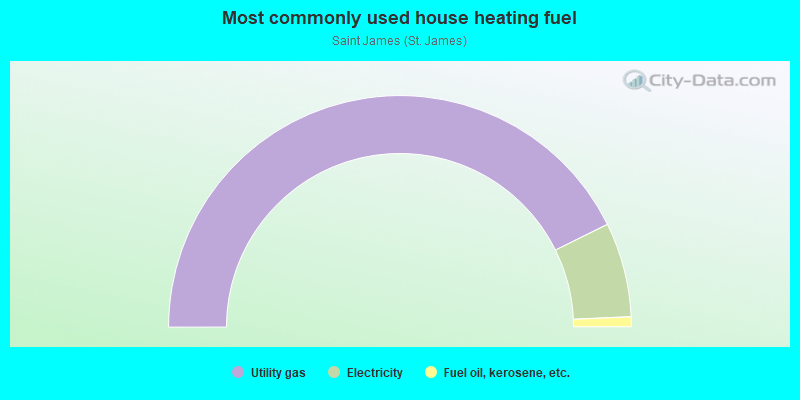
- 85.4%Utility gas
- 13.2%Electricity
- 1.4%Fuel oil, kerosene, etc.
Roads and streets:
W 14 Mile Rd
Length: 0.34 miles
Direction: E-W
Direction: E-W
Bird Ave
Length: 0.34 miles
Direction: E-W
Address range: 100 to 599
Direction: E-W
Address range: 100 to 599
Grant St
Length: 0.33 miles
Direction: N-S
Address range: 1322 to 1999
Direction: N-S
Address range: 1322 to 1999
E Southlawn Blvd
Length: 0.33 miles
Direction: E-W
Address range: 100 to 599
Direction: E-W
Address range: 100 to 599
Catalpa Dr
Length: 0.33 miles
Direction: E-W
Address range: 100 to 599
Direction: E-W
Address range: 100 to 599
Edgewood Rd
Length: 0.32 miles
Directions: N-S, SE-NW
Address range: 1401 to 1999
Directions: N-S, SE-NW
Address range: 1401 to 1999
Pierce St
Length: 0.26 miles
Direction: N-S
Address range: 1500 to 1999
Direction: N-S
Address range: 1500 to 1999
Bennaville Ave
Length: 0.15 miles
Direction: E-W
Address range: 400 to 599
Direction: E-W
Address range: 400 to 599
Smith Ave
Length: 0.14 miles
Direction: E-W
Address range: 400 to 599
Direction: E-W
Address range: 400 to 599