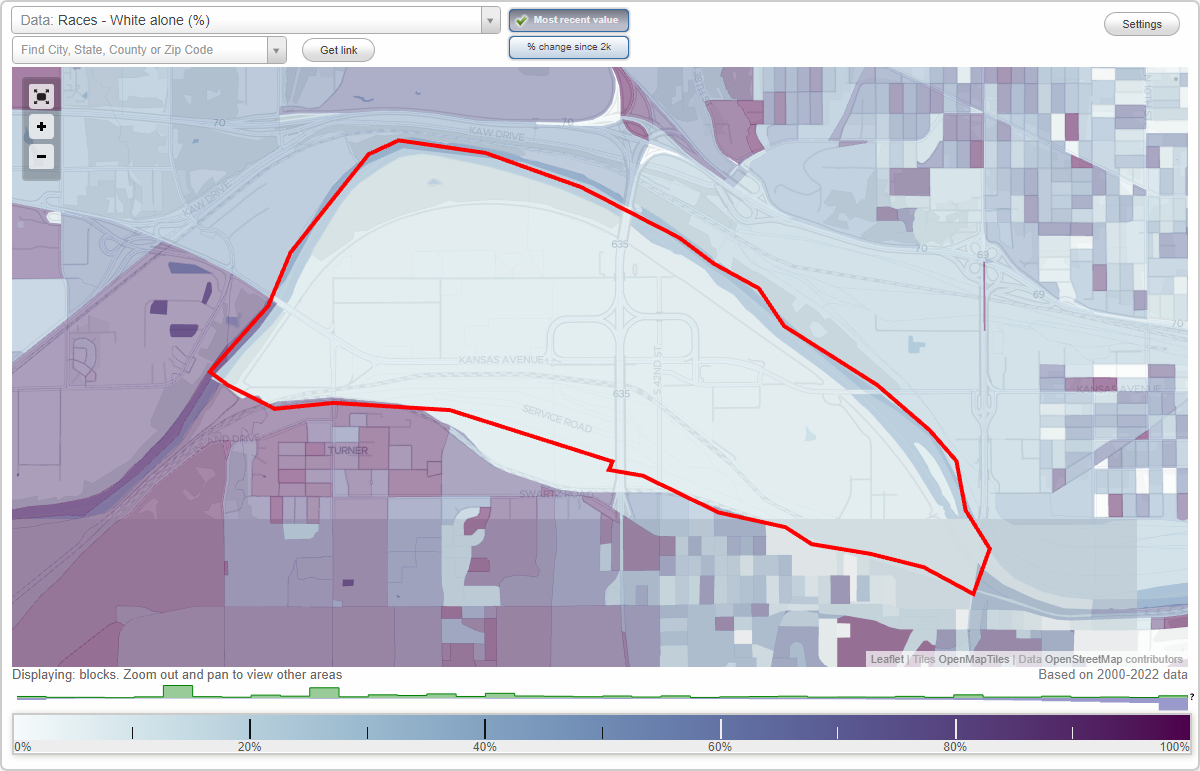
Santa Fe neighborhood in Kansas City, Kansas (KS), 66106 detailed profile
Settings
X

Business Search - 14 Million verified businesses
Area: 3.384 square miles
Population: 4,079
Population density:
| Santa Fe: | 1,205 people per square mile |
| Kansas City: | 1,228 people per square mile |

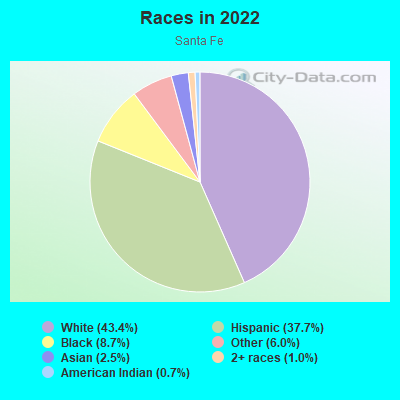
- 1,89643.4%White
- 1,64837.7%Hispanic or Latino
- 3808.7%Black
- 2626.0%Some other race
- 1082.5%Asian
- 451.0%Two or more races
- 300.7%American Indian
Median household income in 2022:
| Santa Fe: | $66,574 |
| Kansas City: | $58,233 |
Distribution of median household income
![Distribution of median household income]()
- 148Less than $10,000
- 416$10,000 to $19,999
- 558$20,000 to $29,999
- 240$30,000 to $39,999
- 108$40,000 to $49,999
- 348$50,000 to $59,999
- 154$60,000 to $74,999
- 248$75,000 to $99,999
- 223$100,000 to $124,999
- 27$125,000 to $149,999
- 43$150,000 to $199,999
- 112$200,000 or more

Distribution of owner-occupied house/condo value
![Distribution of owner-occupied house/condo value]()
- 242Less than $50,000
- 471$50,000 to $99,999
- 410$100,000 to $149,999
- 241$150,000 to $199,999
- 88$200,000 to $249,999
- 48$250,000 to $299,999
- 58$300,000 to $399,999
- 17$400,000 to $499,999
- 65$500,000 to $749,999
- 7$1,000,000 or more

Distribution of rent paid by renters
![Distribution of rent paid by renters]()
- 429Less than $100
- 63$100 to $199
- 186$200 to $299
- 528$300 to $399
- 1,052$400 to $499
- 483$500 to $599
- 914$600 to $699
- 882$700 to $799
- 276$800 to $899
- 28$900 to $999
- 23$1,000 to $1,249
- 48$1,250 to $1,499
- 5$2,000 or more

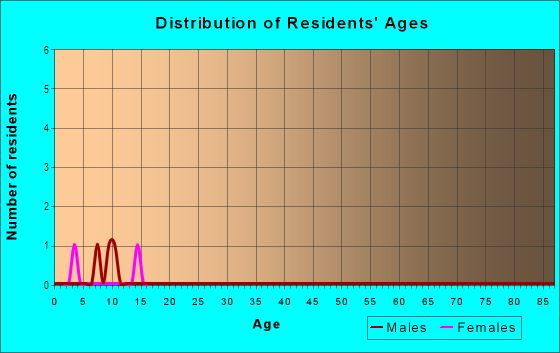
| Males: | 1,865 |
| Females: | 2,214 |
Males:
| This neighborhood: | 39.9 years |
| Whole city: | 33.8 years |
| This neighborhood: | 34.4 years |
| Whole city: | 35.4 years |
Average household size:
| Santa Fe: | 6.9 people |
| Kansas City: | 2.6 people |
Percentage of family households:
| Santa Fe: | 49.2% |
| Kansas City: | 46.3% |
| Here: | 48.1% |
| Kansas City: | 36.4% |
Percentage of married-couple families with children (among all households):
| Santa Fe: | 26.8% |
| Kansas City: | 21.3% |
Percentage of single-mother households (among all households):
| Santa Fe: | 26.7% |
| Kansas City: | 11.5% |
Percentage of never married males 15 years old and over:
Percentage of never married females 15 years old and over:
| Santa Fe: | 22.6% |
| Kansas City: | 21.9% |
Percentage of never married females 15 years old and over:
| Santa Fe: | 11.5% |
| city: | 19.6% |
Percentage of people that speak English not well or not at all:
| Santa Fe: | 3.4% |
| Kansas City: | 8.4% |
Percentage of people born in this state:
Percentage of people born in another U.S. state:
Percentage of native residents but born outside the U.S.:
Percentage of foreign born residents:
| Here: | 59.0% |
| Kansas City: | 53.9% |
Percentage of people born in another U.S. state:
| Santa Fe: | 27.2% |
| Kansas City: | 28.8% |
Percentage of native residents but born outside the U.S.:
| Here: | 0.5% |
| city: | 1.1% |
Percentage of foreign born residents:
| Here: | 13.5% |
| Kansas City: | 16.3% |
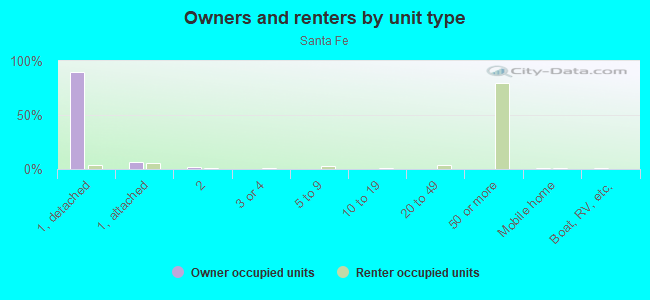
Owner-occupied
Renter-occupied

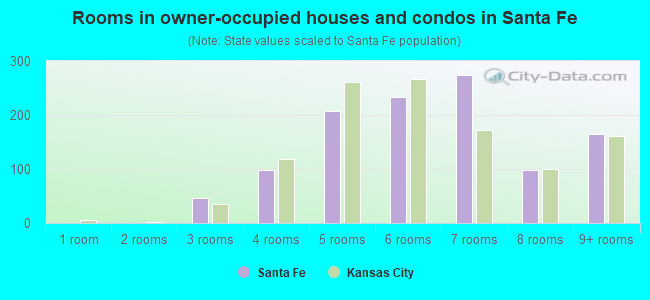
- Rooms in owner-occupied houses and condos in Santa Fe
- 01 room
- 02 rooms
- 473 rooms
- 994 rooms
- 2075 rooms
- 2346 rooms
- 2747 rooms
- 988 rooms
- 1649+ rooms
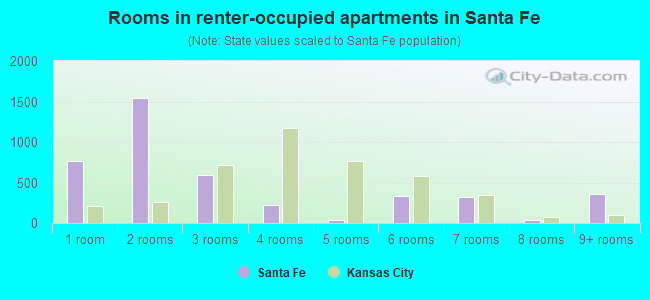
- Rooms in renter-occupied apartments in Santa Fe
- 7641 room
- 1,5472 rooms
- 5893 rooms
- 2204 rooms
- 425 rooms
- 3346 rooms
- 3207 rooms
- 388 rooms
- 3559+ rooms
Owner-occupied
Renter-occupied
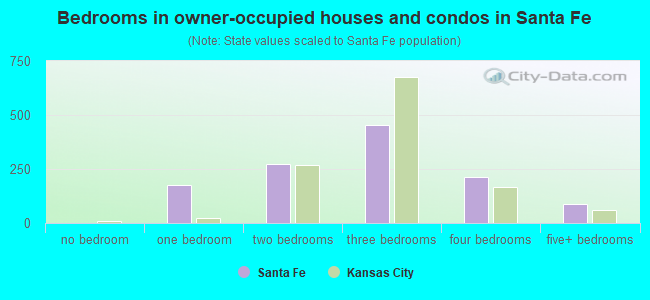
- Bedrooms in owner-occupied houses and condos in Santa Fe
- 0no bedroom
- 1751 bedroom
- 2752 bedrooms
- 4553 bedrooms
- 2134 bedrooms
- 895+ bedrooms
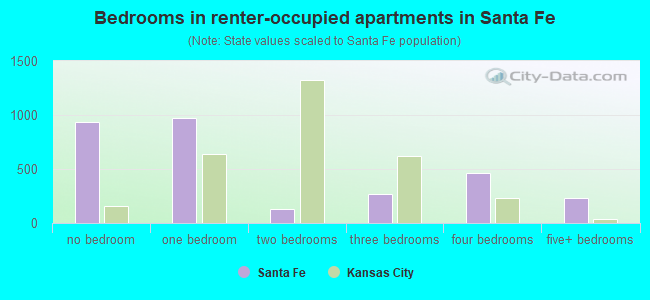
- Bedrooms in renter-occupied apartments in Santa Fe
- 931no bedroom
- 9741 bedroom
- 1292 bedrooms
- 2693 bedrooms
- 4654 bedrooms
- 2335+ bedrooms
Average number of cars or other vehicles available in houses/condos:
Average number of cars or other vehicles available in apartments:
| This neighborhood: | 4.7 |
| Kansas City: | 2.2 |
Average number of cars or other vehicles available in apartments:
| Here: | 3.2 |
| city: | 1.4 |
Percentage of units with a mortgage:
| Santa Fe: | 56.9% |
| Kansas City: | 55.3% |
Average estimated value of detached houses in 2022 (79.7% of all units):
| Santa Fe: | $137,765 |
| Kansas City: | $175,100 |
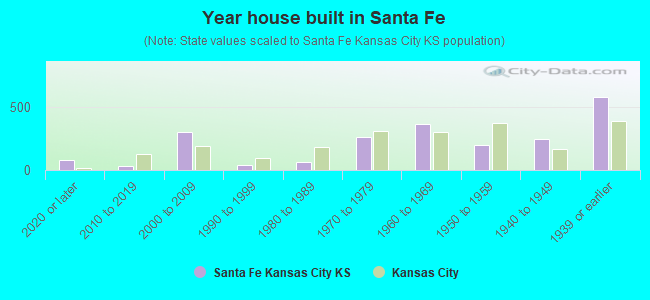
- Year house built in Santa Fe
- 762020 or later
- 282010 to 2019
- 2972000 to 2009
- 411990 to 1999
- 601980 to 1989
- 2591970 to 1979
- 3601960 to 1969
- 1971950 to 1959
- 2431940 to 1949
- 5741939 or earlier
City-data.com crime index for city in 2015 (higher means more crime):
| City: | 553.9 |
| U.S. average: | 243.4 |
Travel time to work (commute)
![Travel time to work (commute)]()
- 13Less than 5 minutes
- 1245 to 9 minutes
- 28310 to 14 minutes
- 47615 to 19 minutes
- 41220 to 24 minutes
- 13125 to 29 minutes
- 26330 to 34 minutes
- 10635 to 39 minutes
- 6740 to 44 minutes
- 3345 to 59 minutes
- 2060 to 89 minutes
- 3890 or more minutes

Means of transportation to work
![Means of transportation to work]()
- 83.6%1,459Drove a car alone
- 4.5%79Carpooled
- 1.2%21Bus
- 9.1%159Ferryboat
- 7.9%138Taxi
- 5.6%98Bicycle
- 6.4%111Walked
- 0.2%4Other means
- 32.4%565Worked at home

Time leaving home to go to work
![Time leaving home to go to work]()
- 20212:00 a.m. to 4:59 a.m.
- 885:00 a.m. to 5:29 a.m.
- 685:30 a.m. to 5:59 a.m.
- 2826:00 a.m. to 6:29 a.m.
- 2826:30 a.m. to 6:59 a.m.
- 1047:00 a.m. to 7:29 a.m.
- 2447:30 a.m. to 7:59 a.m.
- 948:00 a.m. to 8:29 a.m.
- 888:30 a.m. to 8:59 a.m.
- 359:00 a.m. to 9:59 a.m.
- 8010:00 a.m. to 10:59 a.m.
- 8111:00 a.m. to 11:59 a.m.
- 9612:00 p.m. to 3:59 p.m.
- 2354:00 p.m. to 11:59 p.m.

Occupations of males:
- Percentage of males in management occupations (except farmers):
Here: 9.6% city: 7.1%
- Percentage of males in computer and mathematical occupations:
Here: 1.2% city: 3.3%
- Percentage of males in architecture and engineering occupations:
Here: 2.6% city: 1.7%
- Percentage of males in education, training, and library occupations:
Here: 1.1% city: 2.0%
- Percentage of males in service occupations:
Here: 6.8% city: 14.6%
- Percentage of males in sales and office occupations:
Here: 3.0% city: 10.9%
- Percentage of males in farming, fishing, and forestry occupations:
Here: 1.0% city: 0.5%
- Percentage of males in construction, extraction, and maintenance occupations:
Here: 27.0% city: 15.4%
- Percentage of males in production occupations:
Here: 10.8% city: 11.9%
- Percentage of males in transportation occupations:
Here: 28.6% city: 6.8%
- Percentage of males in material moving occupations:
Here: 7.7% city: 12.2%
Occupations of females:
- Percentage of females in management occupations (except farmers):
Here: 7.6% city: 6.8%
- Percentage of females in business and financial operations occupations:
Here: 27.5% city: 5.3%
- Percentage of females in life, physical, and social science occupations:
Here: 1.1% city: 1.0%
- Percentage of females in community and social services occupations:
Here: 2.3% city: 2.3%
- Percentage of females in education, training, and library occupations:
Here: 6.7% city: 7.0%
- Percentage of females in healthcare practitioners and technical occupations:
Here: 4.6% city: 6.3%
- Percentage of females in service occupations:
Here: 16.6% city: 22.4%
- Percentage of females in sales and office occupations:
Here: 15.7% city: 28.6%
- Percentage of females in farming, fishing, and forestry occupations:
Here: 2.8% city: 0.2%
- Percentage of females in construction, extraction, and maintenance occupations:
Here: 4.3% city: 0.8%
- Percentage of females in production occupations:
Here: 4.0% city: 7.5%
- Percentage of females in transportation occupations:
Here: 3.7% city: 1.7%
- Percentage of females in material moving occupations:
Here: 2.5% city: 5.5%
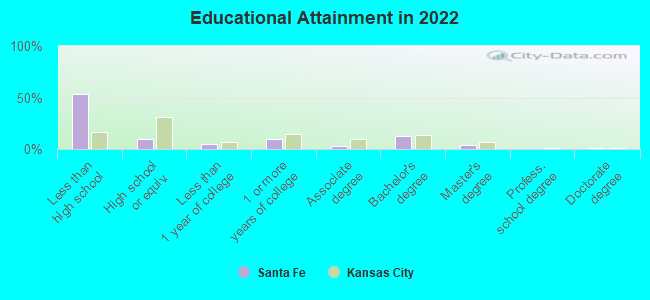
Education in this neighborhood (subdivision or community):
- Percentage of people 3 years and older in K-12 schools:
Santa Fe: 58.6% Kansas City: 20.0%
- Percentage of people 3 years and older in undergraduate colleges:
Santa Fe: 8.2% Kansas City: 3.8%
- Percentage of people 3 years and older in grad. or professional schools:
Santa Fe: 2.0% Kansas City: 2.1%
- Percentage of students K-12 enrolled in private schools:
Santa Fe: 11.3% Kansas City: 12.7%
Percentage of population below poverty level:
| Santa Fe: | 21.7% |
| Kansas City: | 14.3% |
Median year owner moved in (as recorded in 2022):
| Santa Fe: | 2001 |
| Kansas City: | 2010 |
Percentage of married-couple families with both working:
| Santa Fe: | 146.2% |
| Kansas City: | 69.9% |
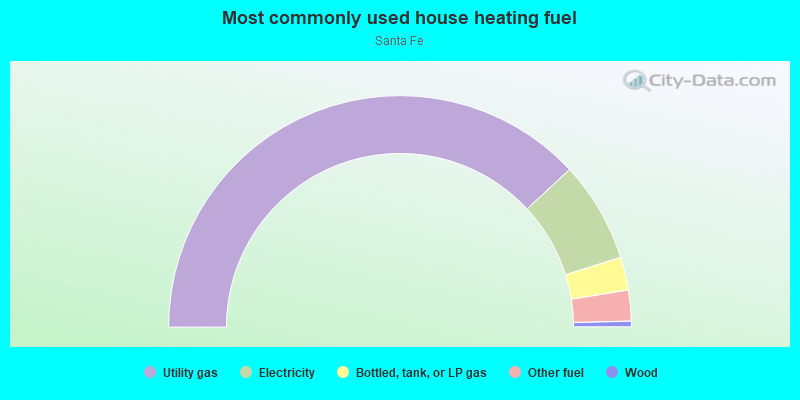
- 76.2%Utility gas
- 14.1%Electricity
- 4.6%Bottled, tank, or LP gas
- 4.3%Other fuel
- 0.8%Wood
Limited-access highways (interstate or state) in this neighborhood:
I- 635
Length: 2.19 miles
Direction: N-S
Direction: N-S
Highways in this neighborhood:
Old Hwy 132 (State Hwy 32, Turner Diagonal Fwy)
Length: 3.63 miles
Directions: E-W, SE-NW
Address range: 2500 to 5499
Directions: E-W, SE-NW
Address range: 2500 to 5499
State Hwy 32 (Turner Diagonal Hwy)
Length: 0.50 miles
Direction: SE-NW
Direction: SE-NW
S 18th St Expy (State Hwy 58, US Hwy 69)
Length: 0.50 miles
Direction: N-S
Direction: N-S
Roads and streets:
Levee Rd
Length: 4.29 miles
Directions: E-W, N-S, SE-NW, SW-NE
Address range: 3000 to 3999
Directions: E-W, N-S, SE-NW, SW-NE
Address range: 3000 to 3999
Speaker Rd
Length: 2.00 miles
Directions: E-W, SW-NE
Address range: 4000 to 5499
Directions: E-W, SW-NE
Address range: 4000 to 5499
Thorn Dr
Length: 1.28 miles
Directions: E-W, SW-NE
Address range: 5701 to 5799
Directions: E-W, SW-NE
Address range: 5701 to 5799
S 42 St (S 42nd St)
Length: 0.88 miles
Direction: N-S
Address range: 200 to 799
Direction: N-S
Address range: 200 to 799
Kansas Ave
Length: 0.87 miles
Directions: E-W, N-S, SE-NW, SW-NE
Address range: 5300 to 5813
Directions: E-W, N-S, SE-NW, SW-NE
Address range: 5300 to 5813
S 26 St (S 26th St)
Length: 0.75 miles
Directions: E-W, N-S, SE-NW
Address range: 500 to 1199
Directions: E-W, N-S, SE-NW
Address range: 500 to 1199
S 55th St
Length: 0.74 miles
Directions: N-S, SE-NW
Address range: 200 to 651
Directions: N-S, SE-NW
Address range: 200 to 651
Service Rd
Length: 0.73 miles
Directions: E-W, SE-NW, SW-NE
Directions: E-W, SE-NW, SW-NE
Richland Ave
Length: 0.64 miles
Direction: E-W
Address range: 5100 to 5499
Direction: E-W
Address range: 5100 to 5499
Argentine Blvd
Length: 0.56 miles
Direction: E-W
Address range: 2200 to 2799
Direction: E-W
Address range: 2200 to 2799
Fairbanks Rd
Length: 0.50 miles
Direction: E-W
Address range: 3400 to 3889
Direction: E-W
Address range: 3400 to 3889
S 51st St (S 51 St)
Length: 0.39 miles
Direction: N-S
Address range: 200 to 299
Direction: N-S
Address range: 200 to 299
Old 132 Hwy
Length: 0.24 miles
Directions: E-W, N-S, SE-NW
Directions: E-W, N-S, SE-NW
Bnsf RR Svc Rd
Length: 0.22 miles
Directions: SE-NW, SW-NE
Directions: SE-NW, SW-NE
Fairbanks Ave
Length: 0.20 miles
Direction: E-W
Address range: 3800 to 4199
Direction: E-W
Address range: 3800 to 4199
S 38th St
Length: 0.18 miles
Direction: N-S
Address range: 400 to 599
Direction: N-S
Address range: 400 to 599
S 38 St (S 38th St)
Length: 0.17 miles
Direction: N-S
Address range: 600 to 799
Direction: N-S
Address range: 600 to 799
Cheyenne St
Length: 0.15 miles
Direction: E-W
Address range: 2400 to 2599
Direction: E-W
Address range: 2400 to 2599
Goddard Viaduct
Length: 0.14 miles
Directions: N-S, SW-NE
Directions: N-S, SW-NE
S 25 St (S 25th St)
Length: 0.14 miles
Direction: N-S
Address range: 950 to 1099
Direction: N-S
Address range: 950 to 1099
Goddard Ave
Length: 0.12 miles
Directions: N-S, SW-NE
Directions: N-S, SW-NE
Miami Ave
Length: 0.12 miles
Direction: E-W
Direction: E-W
Goddard Viaduct Via
Length: 0.07 miles
Direction: SW-NE
Direction: SW-NE
S 39 St (S 39th St)
Length: 0.07 miles
Direction: N-S
Address range: 600 to 699
Direction: N-S
Address range: 600 to 699
Railroad features:
at and Sf Rlwy
Length: 13.22 miles
Directions: E-W, SE-NW, SW-NE
Directions: E-W, SE-NW, SW-NE
Burlington Northern Santa Fe RR
Length: 5.05 miles
Directions: E-W, N-S, SE-NW, SW-NE
Directions: E-W, N-S, SE-NW, SW-NE