Sequoia neighborhood in Redwood City, California (CA), 94062, 94063 detailed profile
Settings
X

Business Search - 14 Million verified businesses
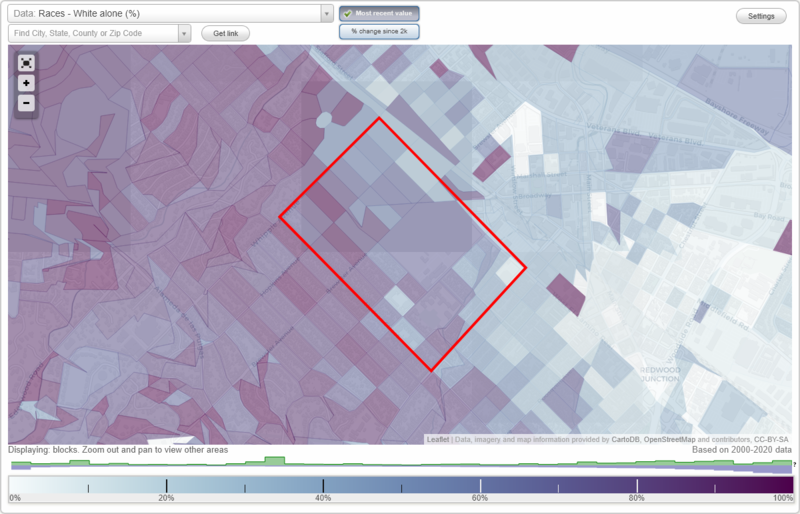
Area: 0.372 square miles
Population: 3,178
Population density:
| Sequoia: | 8,549 people per square mile |
| Redwood City: | 4,134 people per square mile |

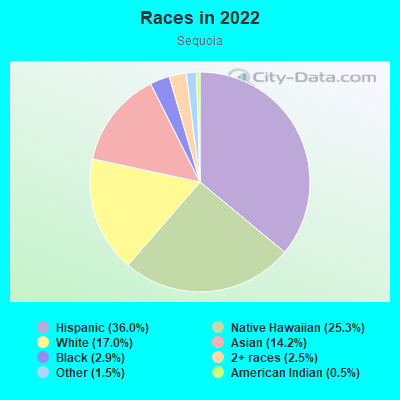
- 1,47936.0%Hispanic or Latino
- 1,04225.3%Native Hawaiian and Other
Pacific Islander - 69917.0%White
- 58514.2%Asian
- 1192.9%Black
- 1032.5%Two or more races
- 631.5%Some other race
- 210.5%American Indian
Median household income in 2022:
| Sequoia: | $500,200 |
| Redwood City: | $137,512 |
Distribution of median household income
![Distribution of median household income]()
- 125Less than $10,000
- 83$10,000 to $19,999
- 123$20,000 to $29,999
- 23$30,000 to $39,999
- 126$40,000 to $49,999
- 83$50,000 to $59,999
- 124$60,000 to $74,999
- 119$75,000 to $99,999
- 94$100,000 to $124,999
- 86$125,000 to $149,999
- 78$150,000 to $199,999
- 406$200,000 or more

Distribution of owner-occupied house/condo value
![Distribution of owner-occupied house/condo value]()
- 78$200,000 to $249,999
- 37$250,000 to $299,999
- 7$300,000 to $399,999
- 4$400,000 to $499,999
- 22$500,000 to $749,999
- 25$750,000 to $999,999
- 470$1,000,000 or more

Distribution of rent paid by renters
![Distribution of rent paid by renters]()
- 2Less than $100
- 5$100 to $199
- 68$200 to $299
- 9$300 to $399
- 11$400 to $499
- 56$500 to $599
- 26$700 to $799
- 21$800 to $899
- 4$900 to $999
- 11$1,000 to $1,249
- 59$1,250 to $1,499
- 207$1,500 to $1,999
- 781$2,000 or more

Median rent in 2022:
| Sequoia: | $8,629 |
| Redwood City: | $2,001 |
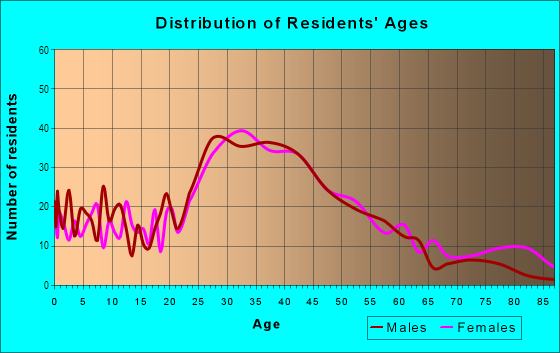
| Males: | 1,524 |
| Females: | 1,654 |
Males:
| This neighborhood: | 114.0 years |
| Whole city: | 34.0 years |
| This neighborhood: | 108.2 years |
| Whole city: | 37.5 years |
Average household size:
| Sequoia: | 8.7 people |
| Redwood City: | 2.6 people |
Percentage of family households:
| Sequoia: | 44.8% |
| Redwood City: | 48.9% |
| Here: | 38.3% |
| Redwood City: | 49.5% |
Percentage of married-couple families with children (among all households):
| Sequoia: | 27.1% |
| Redwood City: | 30.8% |
Percentage of single-mother households (among all households):
| Sequoia: | 12.1% |
| Redwood City: | 5.0% |
Percentage of never married males 15 years old and over:
Percentage of never married females 15 years old and over:
| Sequoia: | 22.8% |
| Redwood City: | 20.9% |
Percentage of never married females 15 years old and over:
| Sequoia: | 24.4% |
| city: | 15.9% |
Percentage of people that speak English not well or not at all:
| Sequoia: | 10.5% |
| Redwood City: | 7.0% |
Percentage of people born in this state:
Percentage of people born in another U.S. state:
Percentage of native residents but born outside the U.S.:
Percentage of foreign born residents:
| Here: | 51.9% |
| Redwood City: | 50.0% |
Percentage of people born in another U.S. state:
| Sequoia: | 22.3% |
| Redwood City: | 16.0% |
Percentage of native residents but born outside the U.S.:
| Here: | 0.8% |
| city: | 2.1% |
Percentage of foreign born residents:
| Here: | 25.0% |
| Redwood City: | 31.9% |
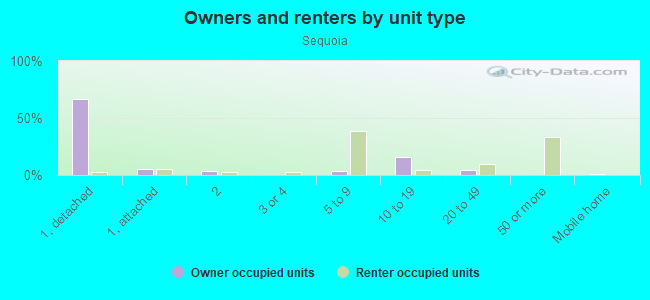
Owner-occupied
Renter-occupied

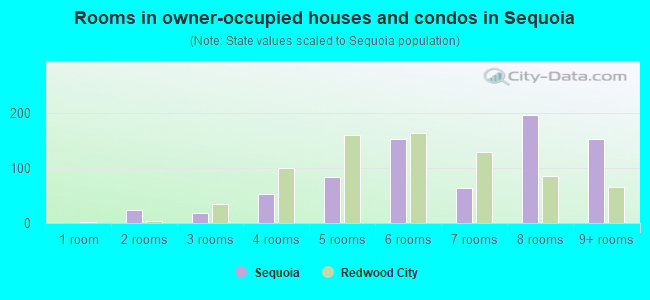
- Rooms in owner-occupied houses and condos in Sequoia
- 01 room
- 242 rooms
- 193 rooms
- 534 rooms
- 835 rooms
- 1546 rooms
- 647 rooms
- 1978 rooms
- 1539+ rooms
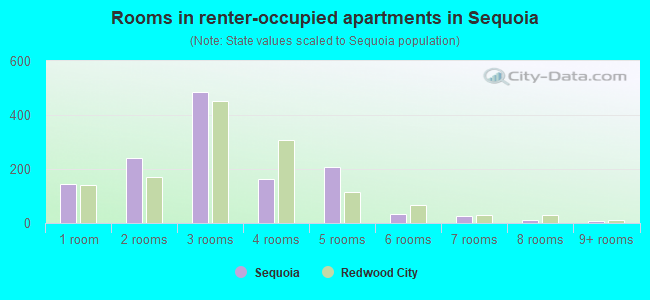
- Rooms in renter-occupied apartments in Sequoia
- 1451 room
- 2422 rooms
- 4873 rooms
- 1624 rooms
- 2085 rooms
- 326 rooms
- 257 rooms
- 108 rooms
- 89+ rooms
Owner-occupied
Renter-occupied
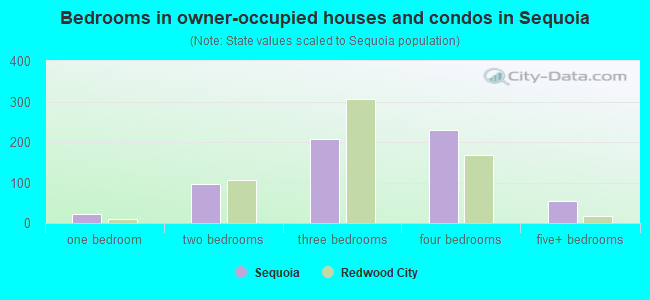
- Bedrooms in owner-occupied houses and condos in Sequoia
- 0no bedroom
- 231 bedroom
- 962 bedrooms
- 2073 bedrooms
- 2304 bedrooms
- 545+ bedrooms
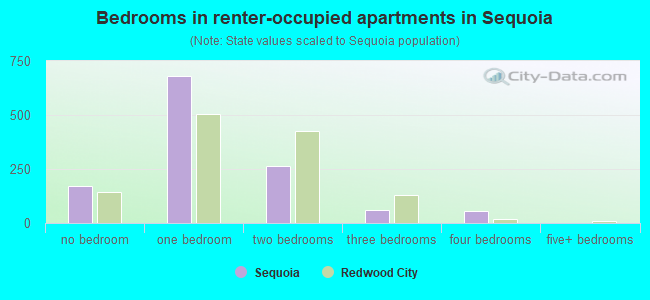
- Bedrooms in renter-occupied apartments in Sequoia
- 169no bedroom
- 6811 bedroom
- 2632 bedrooms
- 583 bedrooms
- 564 bedrooms
- 15+ bedrooms
Average number of cars or other vehicles available in houses/condos:
Average number of cars or other vehicles available in apartments:
| This neighborhood: | 8.1 |
| Redwood City: | 2.1 |
Average number of cars or other vehicles available in apartments:
| Here: | 2.7 |
| city: | 1.5 |
Percentage of units with a mortgage:
| Sequoia: | 80.8% |
| Redwood City: | 71.1% |
Housing prices:
- Average estimated value of detached houses in 2022 (10.5% of all units):
Sequoia: $2,650,481 California: $988,808
- Average estimated '22 value of housing units in 5-or-more-unit structures (52.6% of all units):
Sequoia: $1,046,131 California: $730,996
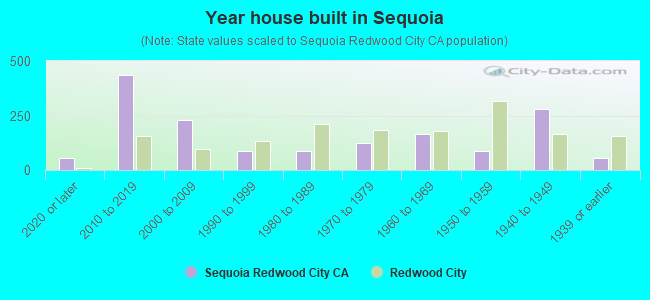
- Year house built in Sequoia
- 532020 or later
- 4352010 to 2019
- 2292000 to 2009
- 881990 to 1999
- 861980 to 1989
- 1251970 to 1979
- 1651960 to 1969
- 851950 to 1959
- 2821940 to 1949
- 571939 or earlier
City-data.com crime index for city in 2020 (higher means more crime):
| City: | 167.5 |
| U.S. average: | 219.5 |
Travel time to work (commute)
![Travel time to work (commute)]()
- 13Less than 5 minutes
- 205 to 9 minutes
- 4210 to 14 minutes
- 7515 to 19 minutes
- 6120 to 24 minutes
- 3625 to 29 minutes
- 4030 to 34 minutes
- 1335 to 39 minutes
- 2240 to 44 minutes
- 9345 to 59 minutes
- 2260 to 89 minutes
- 190 or more minutes

Means of transportation to work
![Means of transportation to work]()
- 45.5%858Drove a car alone
- 29.8%561Carpooled
- 4.9%93Bus
- 2.0%38Subway or elevated rail
- 5.0%95Long-distance train or commuter rail
- 0.1%2Light rail, streetcar or trolley
- 1.9%36Taxi
- 2.7%50Motorcycle
- 8.1%153Bicycle
- 6.6%125Walked
- 10.1%191Other means
- 30.5%575Worked at home

Time leaving home to go to work
![Time leaving home to go to work]()
- 512:00 a.m. to 4:59 a.m.
- 75:00 a.m. to 5:29 a.m.
- 55:30 a.m. to 5:59 a.m.
- 96:00 a.m. to 6:29 a.m.
- 216:30 a.m. to 6:59 a.m.
- 297:00 a.m. to 7:29 a.m.
- 917:30 a.m. to 7:59 a.m.
- 598:00 a.m. to 8:29 a.m.
- 418:30 a.m. to 8:59 a.m.
- 739:00 a.m. to 9:59 a.m.
- 1110:00 a.m. to 10:59 a.m.
- 1411:00 a.m. to 11:59 a.m.
- 912:00 p.m. to 3:59 p.m.
- 84:00 p.m. to 11:59 p.m.

Occupations of males:
- Percentage of males in management occupations (except farmers):
Here: 10.3% city: 16.8%
- Percentage of males in business and financial operations occupations:
Here: 4.6% city: 5.3%
- Percentage of males in computer and mathematical occupations:
Here: 10.0% city: 12.5%
- Percentage of males in architecture and engineering occupations:
Here: 4.1% city: 5.7%
- Percentage of males in life, physical, and social science occupations:
Here: 7.1% city: 3.9%
- Percentage of males in community and social services occupations:
Here: 1.2% city: 0.8%
- Percentage of males in legal occupations:
Here: 1.1% city: 1.2%
- Percentage of males in education, training, and library occupations:
Here: 2.4% city: 3.3%
- Percentage of males in arts, design, entertainment, sports, and media occupations:
Here: 2.6% city: 2.7%
- Percentage of males in healthcare practitioners and technical occupations:
Here: 2.0% city: 2.6%
- Percentage of males in service occupations:
Here: 16.2% city: 13.8%
- Percentage of males in sales and office occupations:
Here: 11.9% city: 10.3%
- Percentage of males in construction, extraction, and maintenance occupations:
Here: 12.1% city: 9.2%
- Percentage of males in transportation occupations:
Here: 5.4% city: 3.3%
- Percentage of males in material moving occupations:
Here: 5.9% city: 3.3%
Occupations of females:
- Percentage of females in management occupations (except farmers):
Here: 12.5% city: 15.2%
- Percentage of females in business and financial operations occupations:
Here: 7.1% city: 7.3%
- Percentage of females in computer and mathematical occupations:
Here: 5.4% city: 5.3%
- Percentage of females in architecture and engineering occupations:
Here: 4.5% city: 1.4%
- Percentage of females in life, physical, and social science occupations:
Here: 3.4% city: 4.4%
- Percentage of females in legal occupations:
Here: 1.9% city: 2.3%
- Percentage of females in education, training, and library occupations:
Here: 5.2% city: 9.3%
- Percentage of females in arts, design, entertainment, sports, and media occupations:
Here: 3.1% city: 2.9%
- Percentage of females in healthcare practitioners and technical occupations:
Here: 6.6% city: 7.4%
- Percentage of females in service occupations:
Here: 20.2% city: 17.8%
- Percentage of females in sales and office occupations:
Here: 25.6% city: 20.9%
- Percentage of females in production occupations:
Here: 3.3% city: 2.0%
Percentage of people 16-64 in Armed Forces:
| Sequoia: | 0.2% |
| Redwood City: | 0.1% |
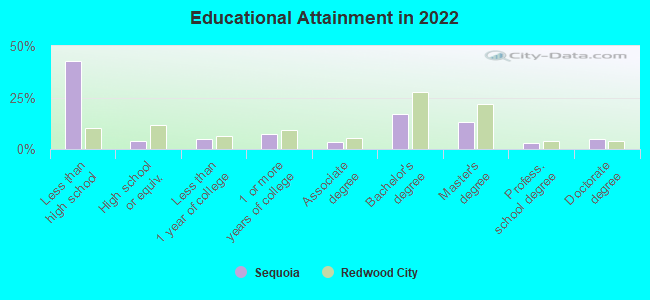
Education in this neighborhood (subdivision or community):
- Percentage of people 3 years and older in K-12 schools:
Sequoia: 41.7% Redwood City: 16.6%
- Percentage of people 3 years and older in undergraduate colleges:
Sequoia: 6.0% Redwood City: 5.1%
- Percentage of people 3 years and older in grad. or professional schools:
Sequoia: 1.1% Redwood City: 2.0%
- Percentage of students K-12 enrolled in private schools:
Sequoia: 51.1% Redwood City: 23.2%
Percentage of population below poverty level:
| Sequoia: | 7.2% |
| Redwood City: | 6.2% |
Median year renter moved in (as recorded in 2022):
| Sequoia: | 6667 |
| Redwood City: | 2020 |
Percentage of married-couple families with both working:
| Sequoia: | 113.8% |
| Redwood City: | 67.4% |
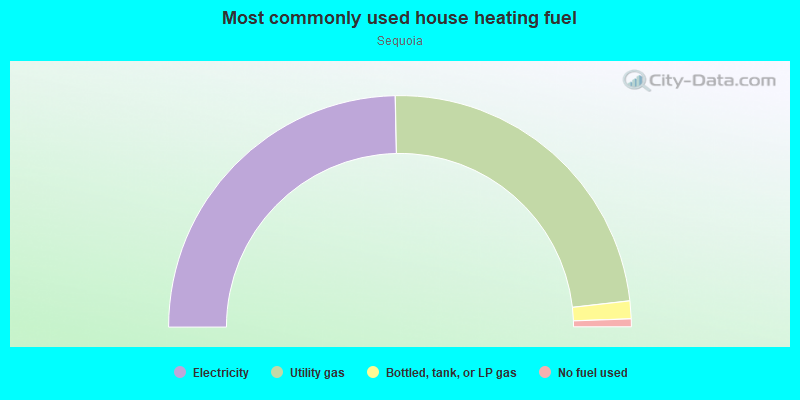
- 49.4%Electricity
- 47.1%Utility gas
- 2.5%Bottled, tank, or LP gas
- 1.1%No fuel used
Highways in this neighborhood:
el Camino Real (State Hwy 82)
Length: 0.67 miles
Direction: SE-NW
Address range: 719 to 799
Direction: SE-NW
Address range: 719 to 799
Roads and streets:
Grand St
Length: 0.86 miles
Direction: SE-NW
Address range: 1 to 599
Direction: SE-NW
Address range: 1 to 599
Fulton St
Length: 0.74 miles
Directions: E-W, SE-NW, SW-NE
Address range: 1 to 599
Directions: E-W, SE-NW, SW-NE
Address range: 1 to 599
Hopkins Ave
Length: 0.66 miles
Directions: SE-NW, SW-NE
Address range: 1000 to 1699
Directions: SE-NW, SW-NE
Address range: 1000 to 1699
Elwood St
Length: 0.63 miles
Direction: SE-NW
Address range: 1 to 399
Direction: SE-NW
Address range: 1 to 399
Clinton St
Length: 0.57 miles
Direction: SE-NW
Address range: 1 to 599
Direction: SE-NW
Address range: 1 to 599
Jefferson Ave
Length: 0.54 miles
Direction: SW-NE
Address range: 1200 to 1799
Direction: SW-NE
Address range: 1200 to 1799
James Ave
Length: 0.54 miles
Direction: SW-NE
Address range: 60 to 799
Direction: SW-NE
Address range: 60 to 799
Harrison Ave
Length: 0.53 miles
Directions: E-W, SW-NE
Address range: 100 to 799
Directions: E-W, SW-NE
Address range: 100 to 799
Duane St
Length: 0.49 miles
Direction: SE-NW
Address range: 1 to 499
Direction: SE-NW
Address range: 1 to 499
Brewster Ave
Length: 0.48 miles
Direction: SW-NE
Address range: 1000 to 1699
Direction: SW-NE
Address range: 1000 to 1699
Broadway St (Broadway)
Length: 0.48 miles
Directions: E-W, N-S
Address range: 2700 to 3199
Directions: E-W, N-S
Address range: 2700 to 3199
Hudson St
Length: 0.35 miles
Direction: SE-NW
Address range: 300 to 599
Direction: SE-NW
Address range: 300 to 599
Arch St
Length: 0.29 miles
Direction: SE-NW
Address range: 100 to 499
Direction: SE-NW
Address range: 100 to 499
Whipple Ave
Length: 0.27 miles
Direction: SW-NE
Address range: 1300 to 1699
Direction: SW-NE
Address range: 1300 to 1699
Birch St
Length: 0.25 miles
Direction: SE-NW
Address range: 100 to 499
Direction: SE-NW
Address range: 100 to 499
Katherine Ave
Length: 0.21 miles
Direction: SW-NE
Address range: 500 to 799
Direction: SW-NE
Address range: 500 to 799
Lexington Ave
Length: 0.14 miles
Directions: N-S, SW-NE
Address range: 100 to 299
Directions: N-S, SW-NE
Address range: 100 to 299
Cleveland St
Length: 0.08 miles
Direction: SE-NW
Address range: 500 to 599
Direction: SE-NW
Address range: 500 to 599
Adams St
Length: 0.07 miles
Direction: SE-NW
Address range: 500 to 599
Direction: SE-NW
Address range: 500 to 599
Other features:
Redwood Crk
Length: 0.42 miles
Directions: N-S, SW-NE
Directions: N-S, SW-NE