Sharon Hills neighborhood in Des Moines, Iowa (IA), 50315 detailed profile
Settings
X

Business Search - 14 Million verified businesses
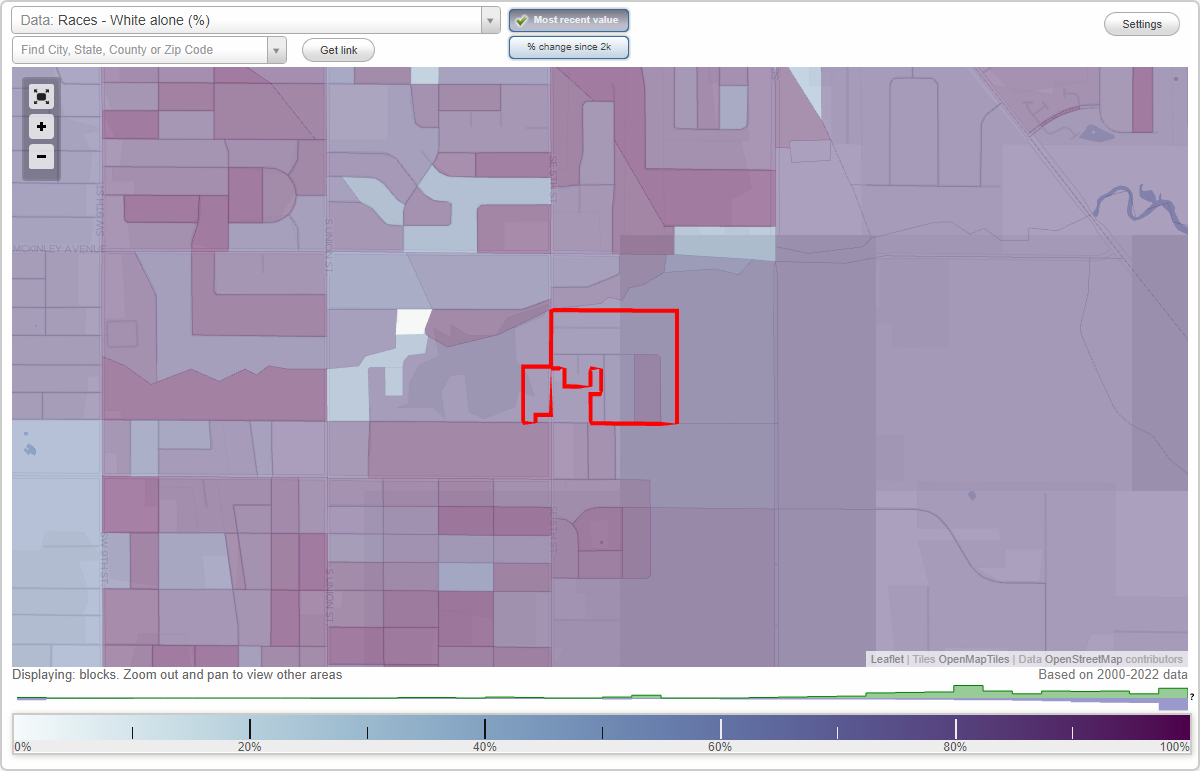
Area: 0.068 square miles
Population: 234
Population density:
| Sharon Hills: | 3,465 people per square mile |
| Des Moines: | 2,783 people per square mile |

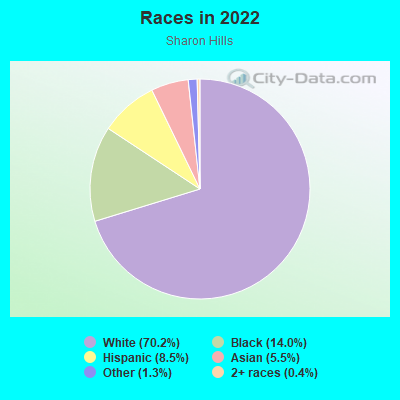
- 16570.2%White
- 3314.0%Black
- 208.5%Hispanic or Latino
- 135.5%Asian
- 31.3%Some other race
- 10.4%Two or more races
Distribution of median household income
![Distribution of median household income]()
- 6Less than $10,000
- 53$10,000 to $19,999
- 16$20,000 to $29,999
- 39$30,000 to $39,999
- 12$40,000 to $49,999
- 3$50,000 to $59,999
- 13$60,000 to $74,999
- 8$75,000 to $99,999
- 13$100,000 to $124,999
- 5$125,000 to $149,999
- 3$150,000 to $199,999
- 2$200,000 or more

Distribution of owner-occupied house/condo value
![Distribution of owner-occupied house/condo value]()
- 35Less than $50,000
- 24$50,000 to $99,999
- 24$100,000 to $149,999
- 16$150,000 to $199,999
- 6$200,000 to $249,999
- 2$250,000 to $299,999

Distribution of rent paid by renters
![Distribution of rent paid by renters]()
- 7Less than $100
- 2$100 to $199
- 11$200 to $299
- 6$300 to $399
- 17$400 to $499
- 14$600 to $699
- 40$700 to $799
- 4$800 to $899
- 3$900 to $999
- 4$1,000 to $1,249
- 4$1,500 to $1,999

Median rent in 2022:
| Sharon Hills: | $693 |
| Des Moines: | $873 |
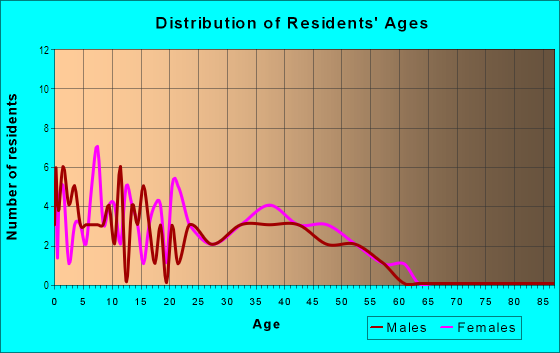
| Males: | 124 |
| Females: | 110 |
Males:
| This neighborhood: | 43.6 years |
| Whole city: | 34.7 years |
| This neighborhood: | 50.8 years |
| Whole city: | 35.5 years |
Average household size:
| Sharon Hills: | 1.7 people |
| Des Moines: | 2.2 people |
Percentage of family households:
| Sharon Hills: | 22.1% |
| Des Moines: | 40.8% |
| Here: | 16.3% |
| Des Moines: | 32.7% |
Percentage of married-couple families with children (among all households):
| Sharon Hills: | 38.1% |
| Des Moines: | 26.2% |
Percentage of single-mother households (among all households):
| Sharon Hills: | 26.2% |
| Des Moines: | 14.0% |
Percentage of never married males 15 years old and over:
Percentage of never married females 15 years old and over:
| Sharon Hills: | 18.3% |
| Des Moines: | 21.4% |
Percentage of never married females 15 years old and over:
| Sharon Hills: | 19.9% |
| city: | 19.3% |
Percentage of people that speak English not well or not at all:
| Sharon Hills: | 5.3% |
| Des Moines: | 5.0% |
Percentage of people born in this state:
Percentage of people born in another U.S. state:
Percentage of native residents but born outside the U.S.:
Percentage of foreign born residents:
| Here: | 64.7% |
| Des Moines: | 64.1% |
Percentage of people born in another U.S. state:
| Sharon Hills: | 22.0% |
| Des Moines: | 19.2% |
Percentage of native residents but born outside the U.S.:
| Here: | 0.2% |
| city: | 0.5% |
Percentage of foreign born residents:
| Here: | 13.1% |
| Des Moines: | 16.2% |
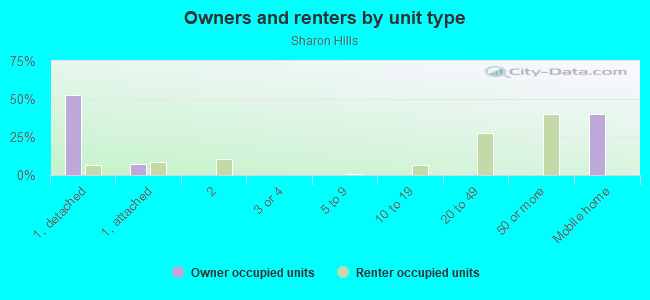
Owner-occupied
Renter-occupied

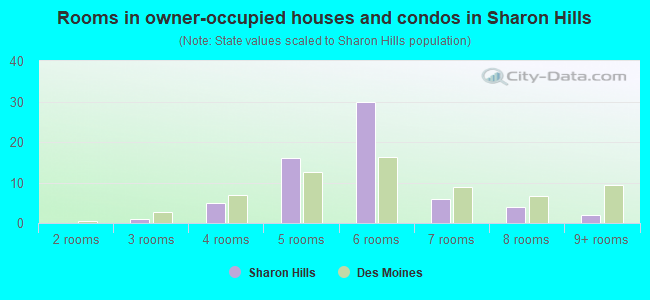
- Rooms in owner-occupied houses and condos in Sharon Hills
- 01 room
- 02 rooms
- 13 rooms
- 54 rooms
- 165 rooms
- 306 rooms
- 67 rooms
- 48 rooms
- 29+ rooms
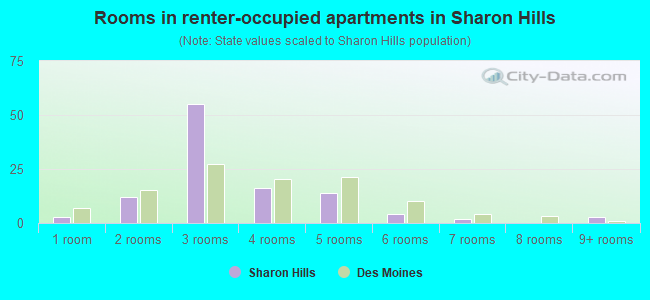
- Rooms in renter-occupied apartments in Sharon Hills
- 31 room
- 122 rooms
- 553 rooms
- 164 rooms
- 145 rooms
- 46 rooms
- 27 rooms
- 08 rooms
- 39+ rooms
Owner-occupied
Renter-occupied
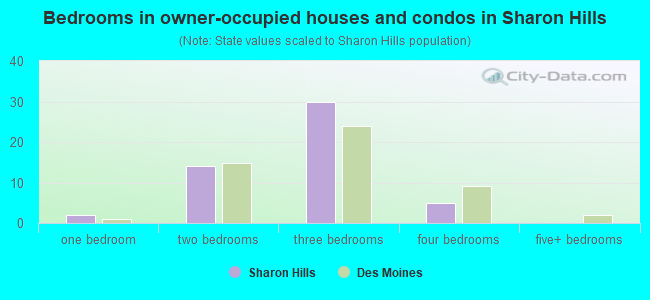
- Bedrooms in owner-occupied houses and condos in Sharon Hills
- 0no bedroom
- 21 bedroom
- 142 bedrooms
- 303 bedrooms
- 54 bedrooms
- 05+ bedrooms
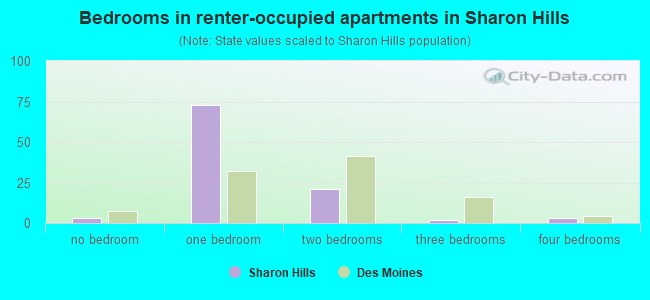
- Bedrooms in renter-occupied apartments in Sharon Hills
- 3no bedroom
- 731 bedroom
- 212 bedrooms
- 23 bedrooms
- 34 bedrooms
- 05+ bedrooms
Average number of cars or other vehicles available in houses/condos:
Average number of cars or other vehicles available in apartments:
| This neighborhood: | 1.8 |
| Des Moines: | 1.9 |
Average number of cars or other vehicles available in apartments:
| Here: | 0.7 |
| city: | 1.2 |
Percentage of units with a mortgage:
| Sharon Hills: | 39.7% |
| Des Moines: | 69.7% |
Housing prices:
- Average estimated value of detached houses in 2022 (31.8% of all units):
Sharon Hills: $149,276 Des Moines: $201,532
- Average estimated value of mobile home in 2022 (20.5% of all units):
Sharon Hills: $20,797 Des Moines: $46,079
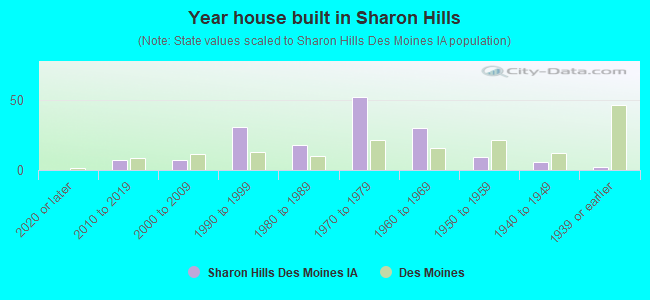
- Year house built in Sharon Hills
- 02020 or later
- 72010 to 2019
- 72000 to 2009
- 311990 to 1999
- 181980 to 1989
- 521970 to 1979
- 301960 to 1969
- 91950 to 1959
- 61940 to 1949
- 21939 or earlier
City-data.com crime index for city in 2020 (higher means more crime):
| City: | 422.4 |
| U.S. average: | 219.5 |
Travel time to work (commute)
![Travel time to work (commute)]()
- 195 to 9 minutes
- 1810 to 14 minutes
- 1815 to 19 minutes
- 4220 to 24 minutes
- 1825 to 29 minutes
- 2230 to 34 minutes
- 540 to 44 minutes
- 245 to 59 minutes
- 490 or more minutes

Means of transportation to work
![Means of transportation to work]()
- 62.5%69Drove a car alone
- 15.4%17Carpooled
- 1.8%2Bus
- 12.7%14Taxi
- 0.9%1Bicycle
- 3.6%4Walked
- 6.3%7Worked at home

Time leaving home to go to work
![Time leaving home to go to work]()
- 812:00 a.m. to 4:59 a.m.
- 65:00 a.m. to 5:29 a.m.
- 75:30 a.m. to 5:59 a.m.
- 146:00 a.m. to 6:29 a.m.
- 266:30 a.m. to 6:59 a.m.
- 177:00 a.m. to 7:29 a.m.
- 117:30 a.m. to 7:59 a.m.
- 58:00 a.m. to 8:29 a.m.
- 38:30 a.m. to 8:59 a.m.
- 109:00 a.m. to 9:59 a.m.
- 710:00 a.m. to 10:59 a.m.
- 111:00 a.m. to 11:59 a.m.
- 1212:00 p.m. to 3:59 p.m.
- 194:00 p.m. to 11:59 p.m.

Occupations of males:
- Percentage of males in management occupations (except farmers):
Here: 2.5% city: 9.3%
- Percentage of males in business and financial operations occupations:
Here: 2.1% city: 5.5%
- Percentage of males in computer and mathematical occupations:
Here: 1.3% city: 6.0%
- Percentage of males in architecture and engineering occupations:
Here: 2.4% city: 2.3%
- Percentage of males in education, training, and library occupations:
Here: 2.7% city: 2.1%
- Percentage of males in service occupations:
Here: 16.5% city: 13.1%
- Percentage of males in sales and office occupations:
Here: 44.5% city: 15.2%
- Percentage of males in construction, extraction, and maintenance occupations:
Here: 23.2% city: 10.0%
- Percentage of males in production occupations:
Here: 2.5% city: 9.9%
- Percentage of males in transportation occupations:
Here: 1.1% city: 6.3%
- Percentage of males in material moving occupations:
Here: 6.4% city: 7.2%
Occupations of females:
- Percentage of females in management occupations (except farmers):
Here: 15.3% city: 8.5%
- Percentage of females in business and financial operations occupations:
Here: 5.5% city: 7.3%
- Percentage of females in education, training, and library occupations:
Here: 4.8% city: 7.0%
- Percentage of females in arts, design, entertainment, sports, and media occupations:
Here: 1.7% city: 2.6%
- Percentage of females in healthcare practitioners and technical occupations:
Here: 4.4% city: 7.6%
- Percentage of females in service occupations:
Here: 35.5% city: 23.4%
- Percentage of females in sales and office occupations:
Here: 26.5% city: 27.7%
- Percentage of females in farming, fishing, and forestry occupations:
Here: 2.1% city: 0.1%
- Percentage of females in production occupations:
Here: 5.0% city: 5.0%
- Percentage of females in material moving occupations:
Here: 1.2% city: 2.1%
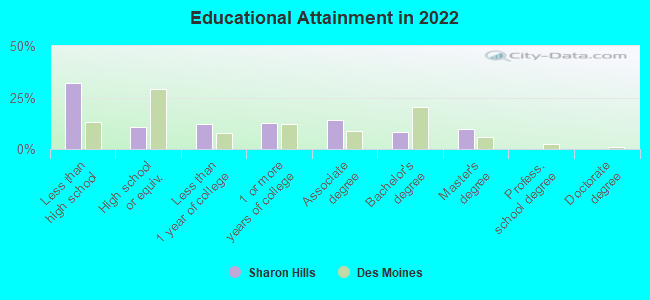
Education in this neighborhood (subdivision or community):
- Percentage of people 3 years and older in K-12 schools:
Sharon Hills: 31.7% Des Moines: 17.5%
- Percentage of people 3 years and older in undergraduate colleges:
Sharon Hills: 6.5% Des Moines: 3.7%
- Percentage of people 3 years and older in grad. or professional schools:
Sharon Hills: 0.4% Des Moines: 1.6%
- Percentage of students K-12 enrolled in private schools:
Sharon Hills: 4.1% Des Moines: 6.9%
Percentage of population below poverty level:
| Sharon Hills: | 11.3% |
| Des Moines: | 14.7% |
Median year owner moved in (as recorded in 2022):
Median year renter moved in (as recorded in 2022):
| Sharon Hills: | 1999 |
| Des Moines: | 2011 |
Median year renter moved in (as recorded in 2022):
| Sharon Hills: | 2018 |
| Des Moines: | 2020 |
Percentage of married-couple families with both working:
| Sharon Hills: | 162.7% |
| Des Moines: | 73.4% |
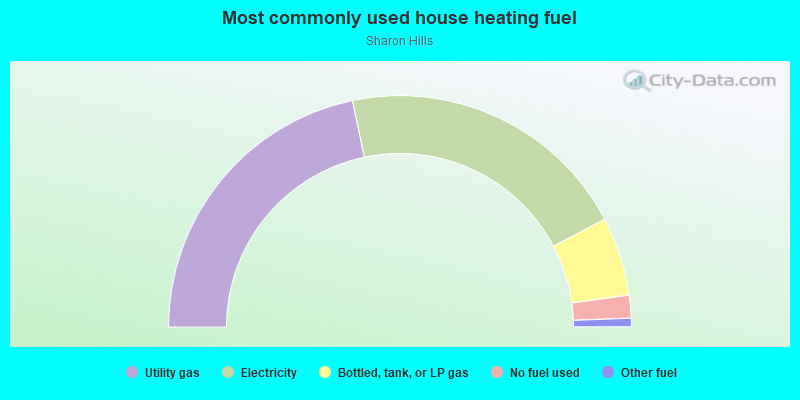
- 43.4%Utility gas
- 41.1%Electricity
- 11.0%Bottled, tank, or LP gas
- 3.2%No fuel used
- 1.2%Other fuel
Roads and streets:
SE Spring St (E Spring St)
Length: 0.24 miles
Directions: E-W, SE-NW
Address range: 600 to 908
Directions: E-W, SE-NW
Address range: 600 to 908
E Kenyon Ave
Length: 0.17 miles
Direction: E-W
Address range: 700 to 899
Direction: E-W
Address range: 700 to 899
SE 7th St
Length: 0.15 miles
Direction: N-S
Address range: 5200 to 5399
Direction: N-S
Address range: 5200 to 5399
SE 8th St
Length: 0.15 miles
Direction: N-S
Address range: 5200 to 5399
Direction: N-S
Address range: 5200 to 5399
SE 9th St
Length: 0.15 miles
Directions: N-S, SE-NW
Address range: 5113 to 5398
Directions: N-S, SE-NW
Address range: 5113 to 5398
SE 6th St
Length: 0.04 miles
Direction: N-S
Address range: 5200 to 5222
Direction: N-S
Address range: 5200 to 5222