South Main neighborhood in Ann Arbor, Michigan (MI), 48104 detailed profile
Settings
X


Business Search - 14 Million verified businesses
Area: 0.148 square miles
Population: 854
Population density:
| South Main: | 5,754 people per square mile |
| Ann Arbor: | 4,438 people per square mile |

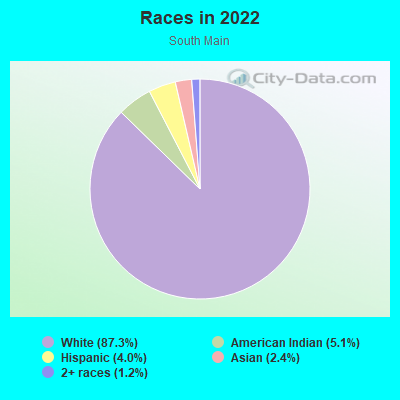
- 79487.3%White
- 465.1%American Indian
- 364.0%Hispanic or Latino
- 222.4%Asian
- 111.2%Two or more races
Median household income in 2022:
| South Main: | $119,180 |
| Ann Arbor: | $78,740 |
Distribution of median household income
![Distribution of median household income]()
- 16Less than $10,000
- 27$10,000 to $19,999
- 17$20,000 to $29,999
- 20$30,000 to $39,999
- 28$40,000 to $49,999
- 13$50,000 to $59,999
- 17$60,000 to $74,999
- 24$75,000 to $99,999
- 133$100,000 to $124,999
- 22$125,000 to $149,999
- 47$150,000 to $199,999
- 103$200,000 or more

Distribution of owner-occupied house/condo value
![Distribution of owner-occupied house/condo value]()
- 19$100,000 to $149,999
- 18$200,000 to $249,999
- 27$300,000 to $399,999
- 123$400,000 to $499,999
- 153$500,000 to $749,999
- 19$750,000 to $999,999
- 2$1,000,000 or more

Distribution of rent paid by renters
![Distribution of rent paid by renters]()
- 28$500 to $599
- 16$800 to $899
- 5$900 to $999
- 94$1,000 to $1,249
- 55$1,250 to $1,499
- 15$1,500 to $1,999
- 70$2,000 or more

Median rent in 2022:
| South Main: | $2,994 |
| Ann Arbor: | $1,381 |
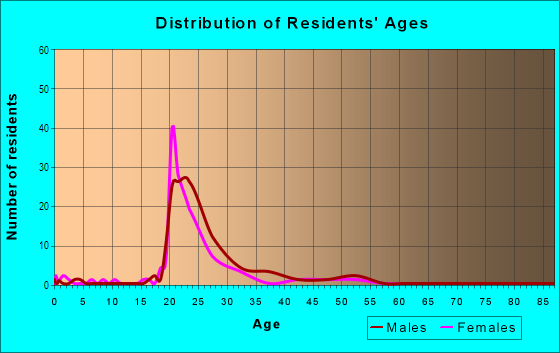
| Males: | 393 |
| Females: | 460 |
Males:
| This neighborhood: | 42.6 years |
| Whole city: | 25.8 years |
| This neighborhood: | 39.7 years |
| Whole city: | 26.4 years |
Average household size:
| South Main: | 13.1 people |
| Ann Arbor: | 2.2 people |
Percentage of family households:
| South Main: | 46.2% |
| Ann Arbor: | 30.6% |
| Here: | 57.4% |
| Ann Arbor: | 33.8% |
Percentage of married-couple families with children (among all households):
| South Main: | 44.9% |
| Ann Arbor: | 33.4% |
Percentage of single-mother households (among all households):
| South Main: | 1.1% |
| Ann Arbor: | 5.6% |
Percentage of never married males 15 years old and over:
Percentage of never married females 15 years old and over:
| South Main: | 13.0% |
| Ann Arbor: | 30.5% |
Percentage of never married females 15 years old and over:
| South Main: | 7.3% |
| city: | 27.5% |
Percentage of people that speak English not well or not at all:
| South Main: | 0.1% |
| Ann Arbor: | 1.5% |
Percentage of people born in this state:
Percentage of people born in another U.S. state:
Percentage of native residents but born outside the U.S.:
Percentage of foreign born residents:
| Here: | 56.3% |
| Ann Arbor: | 45.8% |
Percentage of people born in another U.S. state:
| South Main: | 31.8% |
| Ann Arbor: | 34.9% |
Percentage of native residents but born outside the U.S.:
| Here: | 0.8% |
| city: | 1.6% |
Percentage of foreign born residents:
| Here: | 11.1% |
| Ann Arbor: | 17.7% |
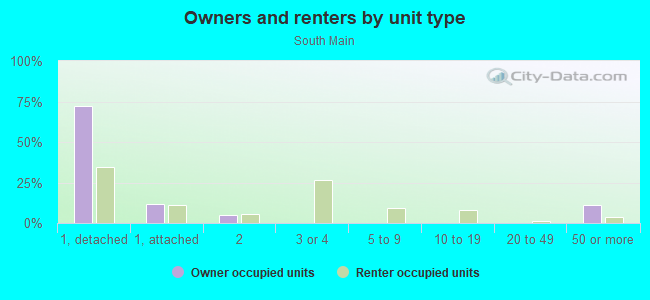
Owner-occupied
Renter-occupied

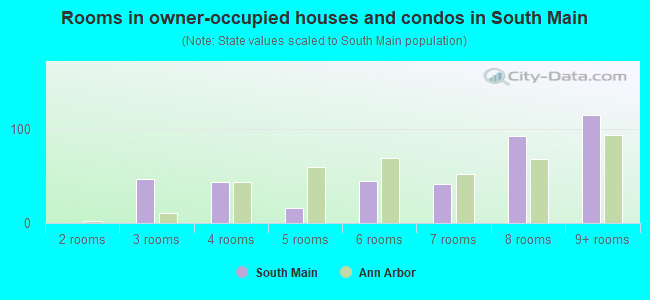
- Rooms in owner-occupied houses and condos in South Main
- 01 room
- 02 rooms
- 473 rooms
- 444 rooms
- 165 rooms
- 456 rooms
- 417 rooms
- 938 rooms
- 1159+ rooms
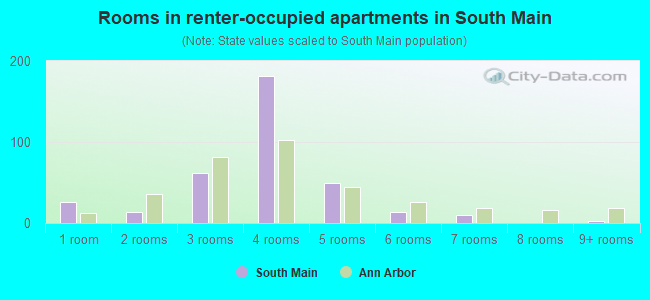
- Rooms in renter-occupied apartments in South Main
- 261 room
- 132 rooms
- 623 rooms
- 1814 rooms
- 495 rooms
- 136 rooms
- 107 rooms
- 08 rooms
- 39+ rooms
Owner-occupied
Renter-occupied
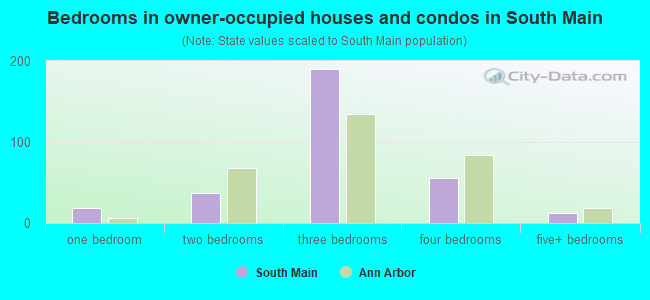
- Bedrooms in owner-occupied houses and condos in South Main
- 0no bedroom
- 181 bedroom
- 372 bedrooms
- 1903 bedrooms
- 554 bedrooms
- 125+ bedrooms
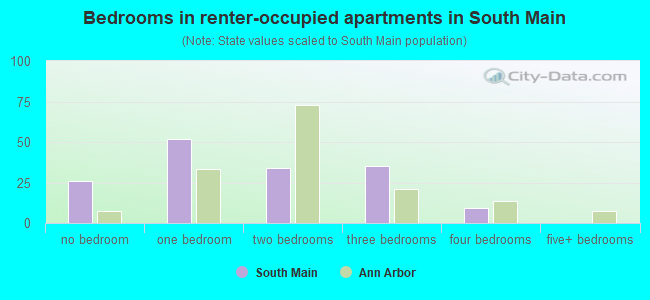
- Bedrooms in renter-occupied apartments in South Main
- 26no bedroom
- 521 bedroom
- 342 bedrooms
- 353 bedrooms
- 94 bedrooms
- 05+ bedrooms
Average number of cars or other vehicles available in houses/condos:
Average number of cars or other vehicles available in apartments:
| This neighborhood: | 1.7 |
| Ann Arbor: | 1.7 |
Average number of cars or other vehicles available in apartments:
| Here: | 1.7 |
| city: | 1.3 |
Percentage of units with a mortgage:
| South Main: | 48.4% |
| Ann Arbor: | 62.6% |
Average estimated value of detached houses in 2022 (81.0% of all units):
| South Main: | $536,913 |
| Ann Arbor: | $540,877 |
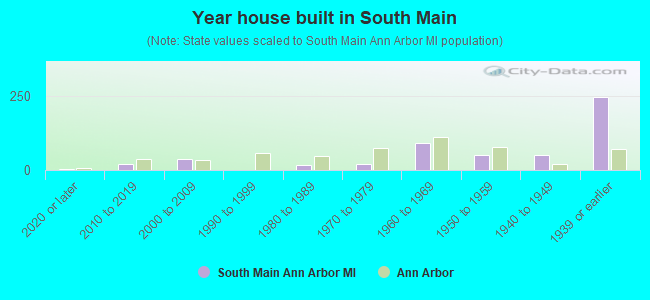
- Year house built in South Main
- 32020 or later
- 212010 to 2019
- 372000 to 2009
- 01990 to 1999
- 171980 to 1989
- 211970 to 1979
- 901960 to 1969
- 501950 to 1959
- 521940 to 1949
- 2441939 or earlier
City-data.com crime index for city in 2020 (higher means more crime):
| City: | 137.0 |
| U.S. average: | 219.5 |
Travel time to work (commute)
![Travel time to work (commute)]()
- 1Less than 5 minutes
- 285 to 9 minutes
- 6010 to 14 minutes
- 4115 to 19 minutes
- 3220 to 24 minutes
- 1725 to 29 minutes
- 2430 to 34 minutes
- 135 to 39 minutes
- 540 to 44 minutes
- 2545 to 59 minutes
- 460 to 89 minutes

Means of transportation to work
![Means of transportation to work]()
- 62.1%255Drove a car alone
- 2.7%11Carpooled
- 14.9%61Bus
- 0.7%3Subway or elevated rail
- 6.3%26Bicycle
- 4.9%20Walked
- 23.1%95Worked at home

Time leaving home to go to work
![Time leaving home to go to work]()
- 612:00 a.m. to 4:59 a.m.
- 15:00 a.m. to 5:29 a.m.
- 15:30 a.m. to 5:59 a.m.
- 46:00 a.m. to 6:29 a.m.
- 126:30 a.m. to 6:59 a.m.
- 107:00 a.m. to 7:29 a.m.
- 247:30 a.m. to 7:59 a.m.
- 448:00 a.m. to 8:29 a.m.
- 258:30 a.m. to 8:59 a.m.
- 509:00 a.m. to 9:59 a.m.
- 1610:00 a.m. to 10:59 a.m.
- 511:00 a.m. to 11:59 a.m.
- 1412:00 p.m. to 3:59 p.m.
- 164:00 p.m. to 11:59 p.m.

Occupations of males:
- Percentage of males in management occupations (except farmers):
Here: 14.0% city: 10.3%
- Percentage of males in computer and mathematical occupations:
Here: 15.4% city: 9.0%
- Percentage of males in architecture and engineering occupations:
Here: 10.3% city: 7.8%
- Percentage of males in legal occupations:
Here: 22.7% city: 2.2%
- Percentage of males in arts, design, entertainment, sports, and media occupations:
Here: 11.1% city: 2.4%
- Percentage of males in healthcare practitioners and technical occupations:
Here: 6.5% city: 6.9%
- Percentage of males in service occupations:
Here: 1.2% city: 8.2%
- Percentage of males in sales and office occupations:
Here: 15.6% city: 10.4%
Occupations of females:
- Percentage of females in management occupations (except farmers):
Here: 24.4% city: 8.5%
- Percentage of females in business and financial operations occupations:
Here: 10.0% city: 5.3%
- Percentage of females in computer and mathematical occupations:
Here: 20.5% city: 3.2%
- Percentage of females in life, physical, and social science occupations:
Here: 3.7% city: 4.8%
- Percentage of females in community and social services occupations:
Here: 4.9% city: 3.5%
- Percentage of females in education, training, and library occupations:
Here: 11.2% city: 20.2%
- Percentage of females in arts, design, entertainment, sports, and media occupations:
Here: 3.8% city: 4.6%
- Percentage of females in service occupations:
Here: 7.6% city: 15.5%
- Percentage of females in sales and office occupations:
Here: 12.1% city: 17.0%
- Percentage of females in farming, fishing, and forestry occupations:
Here: 1.1% city: 0.2%
- Percentage of females in material moving occupations:
Here: 1.0% city: 1.0%
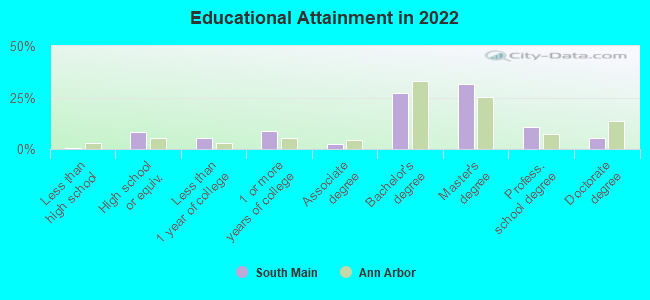
Education in this neighborhood (subdivision or community):
- Percentage of people 3 years and older in K-12 schools:
South Main: 14.2% Ann Arbor: 8.7%
- Percentage of people 3 years and older in undergraduate colleges:
South Main: 3.3% Ann Arbor: 25.6%
- Percentage of people 3 years and older in grad. or professional schools:
South Main: 6.2% Ann Arbor: 10.8%
- Percentage of students K-12 enrolled in private schools:
South Main: 21.4% Ann Arbor: 12.9%
Percentage of population below poverty level:
| South Main: | 11.6% |
| Ann Arbor: | 23.1% |
Median year owner moved in (as recorded in 2022):
Median year renter moved in (as recorded in 2022):
| South Main: | 2003 |
| Ann Arbor: | 2010 |
Median year renter moved in (as recorded in 2022):
| South Main: | 2017 |
| Ann Arbor: | 2022 |
Percentage of married-couple families with both working:
| South Main: | 101.1% |
| Ann Arbor: | 72.2% |
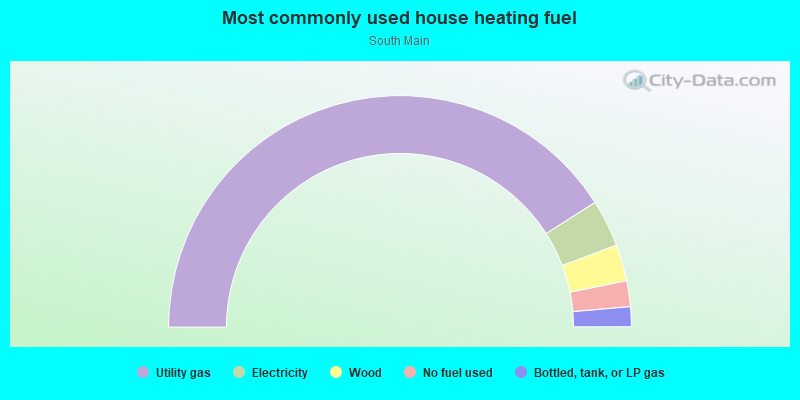
- 82.0%Utility gas
- 6.6%Electricity
- 5.1%Wood
- 3.6%No fuel used
- 2.8%Bottled, tank, or LP gas
Roads and streets:
Greene St
Length: 0.25 miles
Direction: N-S
Address range: 800 to 1099
Direction: N-S
Address range: 800 to 1099
Brown St
Length: 0.16 miles
Direction: N-S
Address range: 800 to 999
Direction: N-S
Address range: 800 to 999
S Main St
Length: 0.12 miles
Direction: N-S
Address range: 1001 to 1099
Direction: N-S
Address range: 1001 to 1099
E Keech Ave
Length: 0.10 miles
Directions: E-W, N-S, SW-NE
Address range: 100 to 199
Directions: E-W, N-S, SW-NE
Address range: 100 to 199
E Hoover Ave
Length: 0.09 miles
Direction: E-W
Address range: 100 to 199
Direction: E-W
Address range: 100 to 199
Hill St
Length: 0.08 miles
Direction: E-W
Address range: 112 to 198
Direction: E-W
Address range: 112 to 198
E Davis Ave
Length: 0.08 miles
Direction: E-W
Address range: 200 to 299
Direction: E-W
Address range: 200 to 299