South Park neighborhood in Midland, Texas (TX), 79701 detailed profile
Settings
X


Business Search - 14 Million verified businesses
Area: 0.288 square miles
Population: 2,051
Population density:
| South Park: | 7,117 people per square mile |
| Midland: | 2,018 people per square mile |

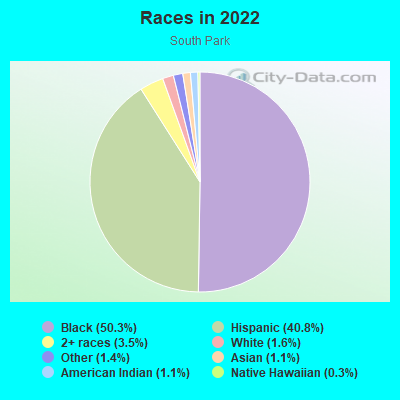
- 1,14151.1%Hispanic or Latino
- 93141.7%Black
- 622.8%Two or more races
- 391.7%White
- 371.7%American Indian
- 210.9%Asian

Distribution of median household income
![Distribution of median household income]()
- 95Less than $10,000
- 147$10,000 to $19,999
- 265$20,000 to $29,999
- 14$30,000 to $39,999
- 171$40,000 to $49,999
- 126$50,000 to $59,999
- 88$60,000 to $74,999
- 42$75,000 to $99,999
- 6$100,000 to $124,999
- 17$125,000 to $149,999
- 59$150,000 to $199,999
- 37$200,000 or more

Distribution of owner-occupied house/condo value
![Distribution of owner-occupied house/condo value]()
- 64Less than $50,000
- 275$50,000 to $99,999
- 138$100,000 to $149,999
- 103$150,000 to $199,999
- 33$200,000 to $249,999
- 178$250,000 to $299,999
- 83$300,000 to $399,999
- 8$400,000 to $499,999
- 2$750,000 to $999,999

Distribution of rent paid by renters
![Distribution of rent paid by renters]()
- 13$200 to $299
- 14$300 to $399
- 4$400 to $499
- 36$500 to $599
- 62$600 to $699
- 25$700 to $799
- 71$800 to $899
- 42$900 to $999
- 71$1,000 to $1,249
- 127$1,250 to $1,499
- 14$1,500 to $1,999
- 76$2,000 or more

| Males: | 1,019 |
| Females: | 1,032 |
Males:
| This neighborhood: | 27.1 years |
| Whole city: | 32.3 years |
| This neighborhood: | 32.5 years |
| Whole city: | 33.3 years |
Average household size:
| South Park: | 2.8 people |
| Midland: | 2.4 people |
Percentage of family households:
| South Park: | 54.8% |
| Midland: | 52.0% |
| Here: | 24.6% |
| Midland: | 46.4% |
Percentage of married-couple families with children (among all households):
| South Park: | 12.9% |
| Midland: | 30.9% |
Percentage of single-mother households (among all households):
| South Park: | 20.8% |
| Midland: | 8.1% |
Percentage of never married males 15 years old and over:
Percentage of never married females 15 years old and over:
| South Park: | 25.0% |
| Midland: | 15.2% |
Percentage of never married females 15 years old and over:
| South Park: | 24.8% |
| city: | 14.9% |
Percentage of people that speak English not well or not at all:
| South Park: | 9.4% |
| Midland: | 5.7% |
Percentage of people born in this state:
Percentage of people born in another U.S. state:
Percentage of native residents but born outside the U.S.:
Percentage of foreign born residents:
| Here: | 61.5% |
| Midland: | 69.5% |
Percentage of people born in another U.S. state:
| South Park: | 14.1% |
| Midland: | 18.2% |
Percentage of native residents but born outside the U.S.:
| Here: | 3.7% |
| city: | 1.2% |
Percentage of foreign born residents:
| Here: | 21.5% |
| Midland: | 11.2% |
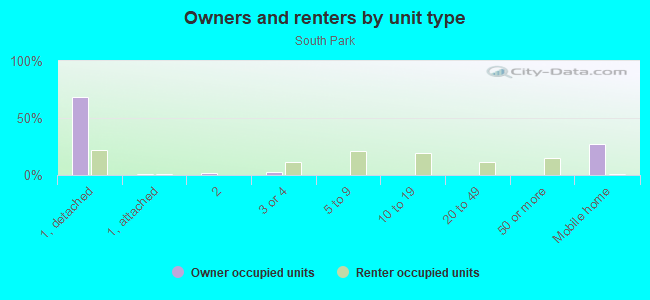
Owner-occupied
Renter-occupied

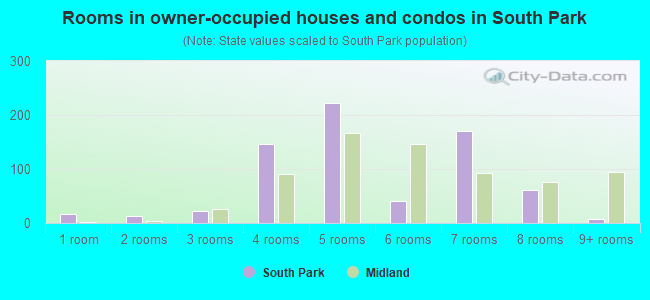
- Rooms in owner-occupied houses and condos in South Park
- 161 room
- 132 rooms
- 223 rooms
- 1474 rooms
- 2225 rooms
- 406 rooms
- 1717 rooms
- 618 rooms
- 89+ rooms
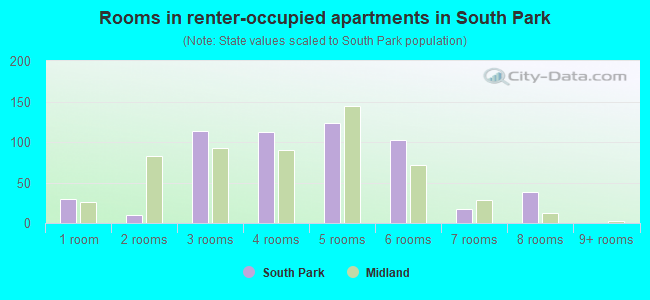
- Rooms in renter-occupied apartments in South Park
- 301 room
- 102 rooms
- 1143 rooms
- 1124 rooms
- 1245 rooms
- 1036 rooms
- 177 rooms
- 388 rooms
- 09+ rooms
Owner-occupied
Renter-occupied
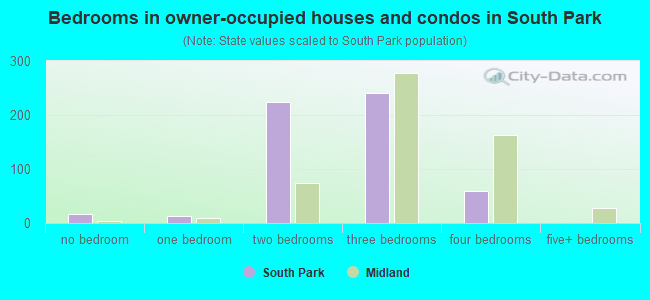
- Bedrooms in owner-occupied houses and condos in South Park
- 16no bedroom
- 131 bedroom
- 2242 bedrooms
- 2413 bedrooms
- 594 bedrooms
- 05+ bedrooms
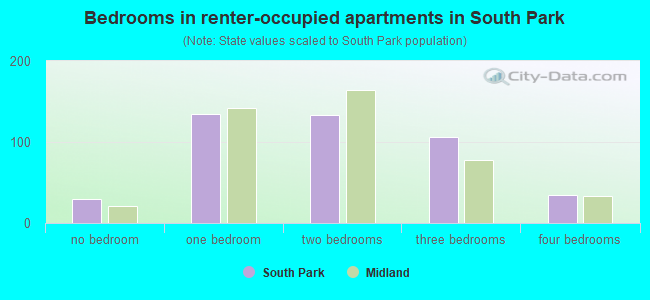
- Bedrooms in renter-occupied apartments in South Park
- 30no bedroom
- 1351 bedroom
- 1332 bedrooms
- 1063 bedrooms
- 354 bedrooms
- 05+ bedrooms
Average number of cars or other vehicles available in houses/condos:
Average number of cars or other vehicles available in apartments:
| This neighborhood: | 0.6 |
| Midland: | 2.1 |
Average number of cars or other vehicles available in apartments:
| Here: | 2.8 |
| city: | 1.4 |
Percentage of units with a mortgage:
| South Park: | 14.8% |
| Midland: | 58.2% |
Average estimated value of detached houses in 2022 (61.3% of all units):
| South Park: | $145,806 |
| Texas: | $369,058 |
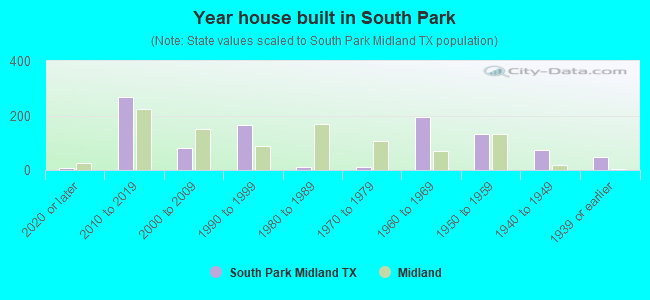
- Year house built in South Park
- 72020 or later
- 2682010 to 2019
- 802000 to 2009
- 1651990 to 1999
- 111980 to 1989
- 121970 to 1979
- 1941960 to 1969
- 1321950 to 1959
- 741940 to 1949
- 491939 or earlier
City-data.com crime index for city in 2020 (higher means more crime):
| City: | 223.8 |
| U.S. average: | 219.5 |
Travel time to work (commute)
![Travel time to work (commute)]()
- 24Less than 5 minutes
- 1265 to 9 minutes
- 12910 to 14 minutes
- 15615 to 19 minutes
- 7120 to 24 minutes
- 7625 to 29 minutes
- 12830 to 34 minutes
- 5245 to 59 minutes
- 1490 or more minutes

Means of transportation to work
![Means of transportation to work]()
- 77.7%664Drove a car alone
- 22.1%189Carpooled
- 0.2%2Motorcycle
- 0.4%3Walked
- 0.1%1Worked at home

Time leaving home to go to work
![Time leaving home to go to work]()
- 4912:00 a.m. to 4:59 a.m.
- 565:00 a.m. to 5:29 a.m.
- 105:30 a.m. to 5:59 a.m.
- 736:00 a.m. to 6:29 a.m.
- 366:30 a.m. to 6:59 a.m.
- 1647:00 a.m. to 7:29 a.m.
- 1007:30 a.m. to 7:59 a.m.
- 598:00 a.m. to 8:29 a.m.
- 168:30 a.m. to 8:59 a.m.
- 169:00 a.m. to 9:59 a.m.
- 4010:00 a.m. to 10:59 a.m.
- 2211:00 a.m. to 11:59 a.m.
- 2212:00 p.m. to 3:59 p.m.
- 824:00 p.m. to 11:59 p.m.

Occupations of males:
- Percentage of males in business and financial operations occupations:
Here: 7.8% city: 3.8%
- Percentage of males in architecture and engineering occupations:
Here: 1.4% city: 7.5%
- Percentage of males in service occupations:
Here: 19.0% city: 9.5%
- Percentage of males in sales and office occupations:
Here: 12.2% city: 14.8%
- Percentage of males in construction, extraction, and maintenance occupations:
Here: 12.1% city: 15.1%
- Percentage of males in production occupations:
Here: 5.7% city: 7.5%
- Percentage of males in transportation occupations:
Here: 23.4% city: 5.1%
- Percentage of males in material moving occupations:
Here: 13.2% city: 4.8%
Occupations of females:
- Percentage of females in legal occupations:
Here: 3.0% city: 0.8%
- Percentage of females in education, training, and library occupations:
Here: 1.6% city: 11.2%
- Percentage of females in healthcare practitioners and technical occupations:
Here: 1.0% city: 6.8%
- Percentage of females in service occupations:
Here: 35.5% city: 16.8%
- Percentage of females in sales and office occupations:
Here: 46.2% city: 33.2%
- Percentage of females in production occupations:
Here: 7.2% city: 2.0%
- Percentage of females in transportation occupations:
Here: 3.9% city: 0.7%
- Percentage of females in material moving occupations:
Here: 2.5% city: 1.8%
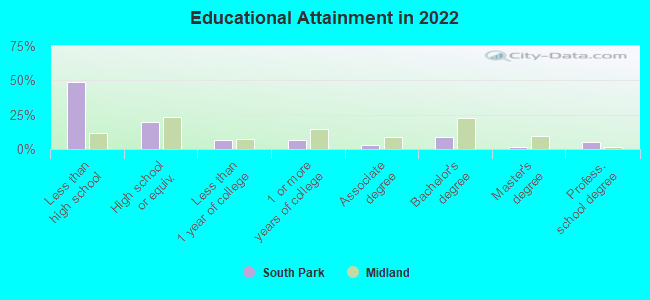
Education in this neighborhood (subdivision or community):
- Percentage of people 3 years and older in K-12 schools:
South Park: 25.3% Midland: 22.4%
- Percentage of people 3 years and older in undergraduate colleges:
South Park: 2.2% Midland: 3.0%
- Percentage of people 3 years and older in grad. or professional schools:
South Park: 0.2% Midland: 1.8%
- Percentage of students K-12 enrolled in private schools:
South Park: 7.6% Midland: 16.2%
Percentage of population below poverty level:
| South Park: | 29.5% |
| Midland: | 11.7% |
Median year owner moved in (as recorded in 2022):
| South Park: | 2007 |
| Midland: | 2015 |
Percentage of married-couple families with both working:
| South Park: | 81.3% |
| Midland: | 63.2% |
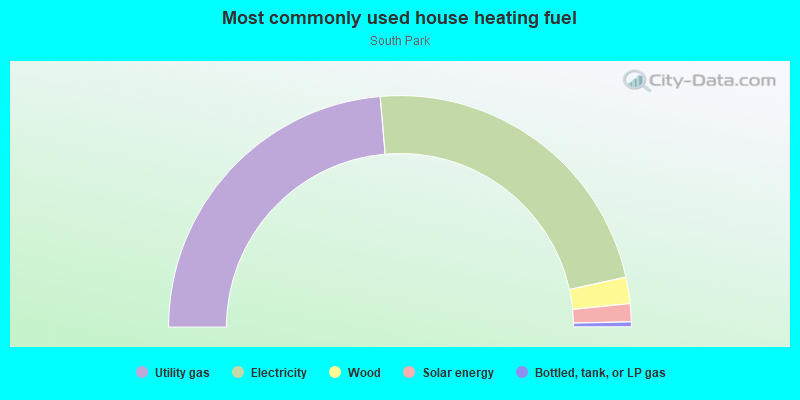
- 47.3%Utility gas
- 45.8%Electricity
- 3.7%Wood
- 2.5%Solar energy
- 0.7%Bottled, tank, or LP gas
Roads and streets:
E Taylor Ave
Length: 0.76 miles
Direction: E-W
Address range: 200 to 1199
Direction: E-W
Address range: 200 to 1199
E Hicks Ave
Length: 0.74 miles
Direction: E-W
Address range: 190 to 1199
Direction: E-W
Address range: 190 to 1199
E New Jersey Ave
Length: 0.56 miles
Directions: E-W, SW-NE
Address range: 500 to 1999
Directions: E-W, SW-NE
Address range: 500 to 1999
S Marshall St
Length: 0.48 miles
Direction: N-S
Address range: 1000 to 1899
Direction: N-S
Address range: 1000 to 1899
S Lamesa Rd
Length: 0.48 miles
Direction: N-S
Address range: 904 to 1899
Direction: N-S
Address range: 904 to 1899
S Jefferson St
Length: 0.46 miles
Direction: N-S
Address range: 1000 to 1899
Direction: N-S
Address range: 1000 to 1899
S Mineola St
Length: 0.43 miles
Direction: N-S
Address range: 1300 to 1899
Direction: N-S
Address range: 1300 to 1899
E Gist Ave
Length: 0.40 miles
Direction: E-W
Address range: 701 to 1198
Direction: E-W
Address range: 701 to 1198
S Terrell St
Length: 0.38 miles
Direction: N-S
Address range: 1300 to 1748
Direction: N-S
Address range: 1300 to 1748
S Atlanta St
Length: 0.37 miles
Directions: N-S, SE-NW
Address range: 1300 to 1899
Directions: N-S, SE-NW
Address range: 1300 to 1899
S Dallas St
Length: 0.32 miles
Direction: N-S
Address range: 1200 to 1599
Direction: N-S
Address range: 1200 to 1599
E Griffin Ave
Length: 0.28 miles
Direction: E-W
Address range: 200 to 599
Direction: E-W
Address range: 200 to 599
Harrison St
Length: 0.22 miles
Direction: N-S
Address range: 1700 to 1899
Direction: N-S
Address range: 1700 to 1899
S Baird St
Length: 0.21 miles
Direction: N-S
Address range: 1400 to 1699
Direction: N-S
Address range: 1400 to 1699
S Fort Worth St
Length: 0.21 miles
Direction: N-S
Address range: 1400 to 1699
Direction: N-S
Address range: 1400 to 1699
Weatherford St
Length: 0.21 miles
Direction: N-S
Address range: 1400 to 1699
Direction: N-S
Address range: 1400 to 1699
E Dakota Ave
Length: 0.08 miles
Direction: E-W
Address range: 800 to 899
Direction: E-W
Address range: 800 to 899